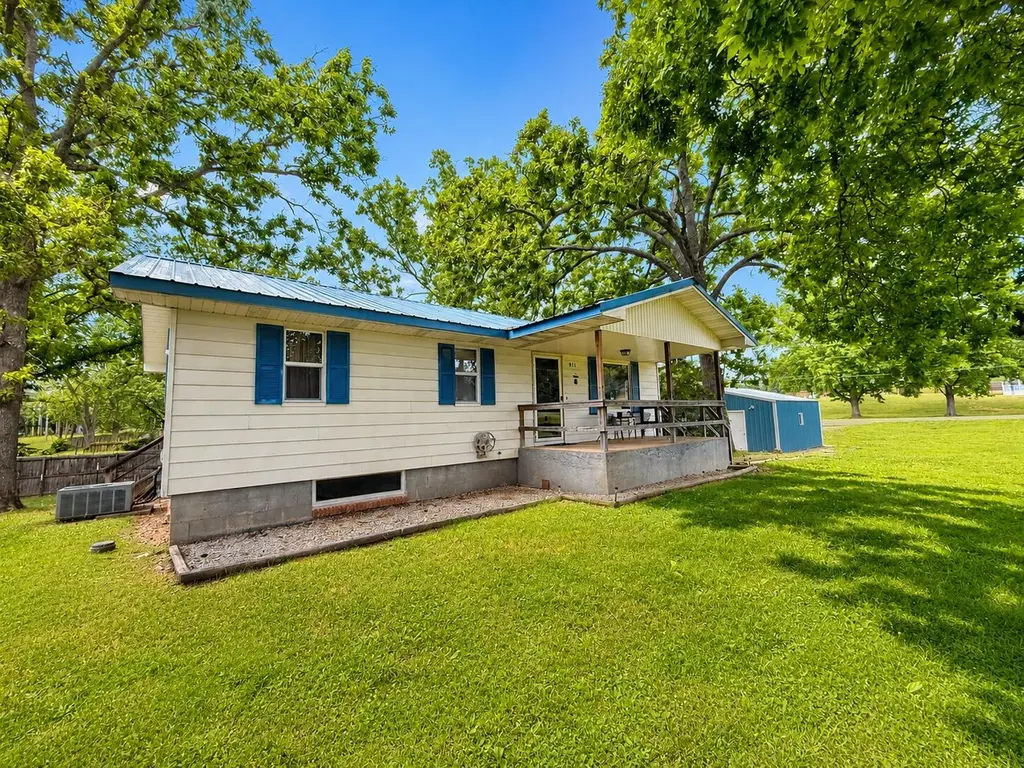
911 N Center St · Willow Springs, MO
Flood risk 1/10 · Minimal
- FEMA flood zone
- X (unshaded)
- Chance of flooding over 30 yrs
- 0.0%
- Est. flood insurance / yr
- $473 – $860
Fire risk 5/10 · Moderate
- Est. fire insurance / yr
- $1,054 – $1,958
Heat risk 4/10 · Minor
- Hot days now (above 105°F)
- 7 days/yr
- Hot days in 30 yrs
- 19 days/yr
Wind risk 2/10 · Minimal
- Chance of severe wind over 30 yrs
- 1.0%
Air-quality risk 1/10 · Minimal
- Unhealthy air days now
- 0 days/yr
- Unhealthy air days in 30 yrs
- 0 days/yr
Risk factors via First Street. Map © Google.
Why this score? — see what drove the D grade
The composite is a weighted blend of 9 inputs, each scored 0–100. Each bar is that input's sub-score; the figure is the points it added to the 100-point composite (weight × sub-score).
- Cash flow +13.7/30.0
- ARV discount +7.5/15.0
- DSCR +4.2/10.0
- Schools +3.4/10.0
- Livability +3.1/5.0
- 1% rule +2.7/10.0
- Rent growth +2.5/5.0
- Condition / age +2.5/5.0
- Appreciation +0.7/10.0
$165,500
🖨 Deal sheet (PDF) 📄 Offer letter ✓ Due diligence
Listing remarks MLS
Looking for a home that is within walking distance of city pool, school, and football field to root on your home town team? This home has that great location! This 3 bedroom 1 bath features an additional family room, stone fire place, and an unfinished basement to customize to your liking. For those who are not afraid of a little elbow grease and tools. Call to make your appointment today! In order to provide the best service, we work by appointment only.
Key facts
- Large lot
- Full basement
- Detached shop
Tags
Property features AI
Exterior
- Parking: 2-car garage with workshop space and garage door opener; Driveway and additional off-street parking; Garage faces front
- Security: Smoke detectors
- Utilities: Public water; Public sewer
- Home design: Single-family residence; One level
- Construction: Lap siding; Basement: full, concrete block; partially finished with interior and exterior entry and walk-out access; storage space; Year built not specified
- Exterior features: Covered front, side and rear porches (including screened); Privacy and wire fencing; Corner lot; Asphalt and gravel road access; Publicly maintained city street frontage; Metal roof
Interior
- Kitchen: Electric oven; Free-standing electric oven; Refrigerator
- Flooring: Carpet; Vinyl
- Bathrooms: 1 full bathroom; 1 half bathroom
- Heating & cooling: Central heating (forced air); Electric heating; Central air conditioning; Ceiling fans
- Interior features: High-speed internet; Insulated double-pane windows; Living room fireplace
- Laundry & utility: Laundry in basement; Gas water heater
Neighborhood map
What this means for you Summary
Snapshot
- This is a 4-bed/1.5-bath other listed at $166k.
Deal economics
- At list price, monthly cash flow is $14 ($163/yr) — positive.
- The deal already cash-flows at list — no discount required.
- To meet the 1% rule (rent ≥ 1% of price), the offer needs to be $127k (23.0% below list).
- Recommended offer: $127k (23.0% below list) — sets the bar for 1% rule.
- Cap rate 6.4% vs local median 3.7% in Willow Springs — top-decile yield for the area; either an underpriced asset or a hidden risk that comps aren't pricing in. Stress-test before assuming the spread holds.
Location & tenants
- Location reads 62/100 on livability (#386 in MO) — a middle-class / working-renter tenant base. Strengths: crime A+, cost of living A+; Watch: amenities F, commute F, employment F.
- Willow Springs R-IV (rural): math 34% / reading 50% proficiency, ranked #140 of 324 in MO (top 43%) — families likely to look elsewhere, expect single-tenant / working-renter base with shorter leases.
- Zoned schools: Willow Springs Elem. (math 37% / reading 42%, grade F, #537 of 1,115 statewide, top 53%, 525 students, 72% FRL); Willow Springs Middle (math 34% / reading 51%, grade D-, #140 of 391 statewide, top 38%, 369 students, 66% FRL); Willow Springs High (math 32% / reading 62%, grade D-, #155 of 521 statewide, top 32%, 387 students, 52% FRL).
- Market conditions: 82 active listings in the ZIP; 53 units permitted in Howell County in 2024 (0 in 5+ unit buildings).
Forward outlook
- Local home prices are declining (-3.0%/yr); year-one equity from $1k of loan paydown is wiped out by about $5k of value loss. Plan a longer hold.
- Howell County population projected at -18% by 2050 — secular population decline; favor cash flow + early exit over multi-decade hold.
Negotiation context
- It's been on market 25 days — a 2% lower offer ($163k) is reasonable based on typical stale-listing flexibility.
- 3 sale attempts since 12y ago with the ask held roughly flat each time — persistent listings suggest the price (not the market) is what's stuck; bring a comps-based counter.
Risks & watch-outs
- Watch-outs: built in 1957 — expect roof / HVAC / electrical / plumbing capex.
- Climate carrying-cost: moderate wildfire risk — expect insurance premiums to compound above CPI over the hold.
Questions for the listing agent
- Built in 1957 — when were the roof, HVAC, electrical panel, plumbing, and water heater last replaced?
- Is there a deadline driving the sale (1031 exchange, divorce, estate, relocation)? That informs how much negotiation room exists.
- Schools are F-rated, which usually means shorter tenancies and higher turnover. Who's the typical renter profile here, and what's been the actual vacancy rate?
- The area grade is low — what's the realistic commute time and amenity access for the typical tenant pool here? Any planned neighborhood developments (good or bad) we should know about?
- What's the average days-on-market for RENTAL listings here right now (not sales)? A rising rental-DOM trend means longer vacancies and softer asking-rent achievability than the comps imply.
- What's the recent tenant-quality profile in this submarket — average credit score on applications, eviction rate, late-payment / NSF rate, and stable-employment percentage? A property-management company in the area should have these aggregated.
- How much new for-sale + rental construction is in the pipeline within 1–3 miles? Heavy new supply typically softens prices + rents 12–24 months out; constrained supply supports both.
Investment metrics
- 1% rule
- 0.77% ✗
- Cap rate
- 6.39%
- Cash-on-cash
- 0.35%
- DSCR
- 1.02
- GRM
- 10.8
CMA / ARV
No comps found within radius.
Projected returns pro-forma
-3.0% appreciation · 3.0% rent growth · sell at horizon
- IRR
- -15.8%
- Equity multiple
- 0.44×
- Total profit
- $-26,025
- Equity at exit
- $24,677
- IRR
- -7.5%
- Equity multiple
- 0.53×
- Total profit
- $-21,845
- Equity at exit
- $14,309
Cash invested: $46,340 (down + closing). Projections, not guarantees.
Landlord ↔ Tenant lean methodology
- Overall (STATE)
- 81 Strongly Landlord-Friendly
- State Missouri
- 81 Strongly Landlord-Friendly · R+10
- County
- — inherits STATE
- City
- — inherits STATE
ZIP-level market 65793
- Home prices YoY
- -3.8%
- Active inventory
- 82
- Price-to-rent
- 10.8×
Monthly cashflow live
- Estimated rent
- $1,274 medium interval (Pro) →
- Mortgage (P&I)
- −$868
- Tax from tax record
- −$56 /mo · $672/yr
- Insurance
- −$69
- HOA
- −$0
- Vacancy / Maint / Mgmt
- −$268
- Net cashflow
- $14
Break-even live
Sensitivity live
| Price | -10% $107 | -5% $60 | +0% $14 | +5% $-33 | +10% $-80 |
|---|---|---|---|---|---|
| Rent | -10% $-87 | -5% $-37 | +0% $14 | +5% $64 | +10% $114 |
| Rate | -1.0pp $97 | -0.5pp $56 | base $14 | +0.5pp $-29 | +1.0pp $-73 |
UW: 25.0% down · 7.5% · 30yr · 1.5% tax · 5.0% vac · 8.0% maint · 8.0% mgmt
Financing live
Cash to close
- Down payment
- $41,375
- Closing costs
- $4,965
- Reserves months
- —
- Total cash needed
- —
Loan-product check · same deal, 3 products live
Conventional
25% down · 7.5% · 30yr
- Down + closing
- —
- Monthly P&I
- —
- Monthly cashflow
- —
- DSCR
- —
- Eligible?
- —
Personal DTI + credit; lowest rate.
DSCR
20% down · 8.5% · 30yr
- Down + closing
- —
- Monthly P&I
- —
- Monthly cashflow
- —
- DSCR
- —
- Eligible?
- —
No personal income docs; deal must DSCR.
Hard money
10% down · 12.0% · 12mo
- Down + closing
- —
- Monthly P&I
- —
- Monthly cashflow
- —
- DSCR
- —
- Eligible?
- —
Short-term bridge; refi at stabilization.
Listing history 24 events
-
2026-06-22days on market $165,500 Active 25 DOM
-
2026-06-21days on market $165,500 Active 24 DOM
-
2026-06-21days on market $165,500 Active 23 DOM
-
2026-06-18days on market $165,500 Active 21 DOM
-
2026-06-17days on market $165,500 Active 20 DOM
-
2026-06-16days on market $165,500 Active 19 DOM
-
2026-06-15days on market $165,500 Active 18 DOM
-
2026-06-13days on market $165,500 Active 16 DOM
-
2026-06-12days on market $165,500 Active 15 DOM
-
2026-06-09days on market $165,500 Active 12 DOM
-
2026-06-08days on market $165,500 Active 11 DOM
-
2026-06-07days on market $165,500 Active 10 DOM
-
2026-06-07days on market $165,500 Active 9 DOM
-
2026-06-04days on market $165,500 Active 6 DOM
-
2026-06-02days on market $165,500 Active 5 DOM
-
2026-06-01days on market $165,500 Active 4 DOM
-
2026-05-31days on market $165,500 Active 3 DOM
-
2026-05-28$165,500 Active
-
2017-04-03soldstatus 459-char remark
Show marketing remark (459 chars)
Looking for a home that is within walking distance of city pool, school, and football field to root on your home town team? This home has that great location! This 3 bedroom 1 bath features an additional family room, stone fire place, and an unfinished basement to customize to your liking. For those who are not afraid of a little elbow grease and tools. Call to make your appointment today! In order to provide the best service, we work by appointment only.
-
2016-11-18$42,380 459-char remark
Show marketing remark (459 chars)
Looking for a home that is within walking distance of city pool, school, and football field to root on your home town team? This home has that great location! This 3 bedroom 1 bath features an additional family room, stone fire place, and an unfinished basement to customize to your liking. For those who are not afraid of a little elbow grease and tools. Call to make your appointment today! In order to provide the best service, we work by appointment only.
-
2014-06-05$89,900
-
2009-03-16soldstatus
-
1995-05-30soldstatus
ⓘ Source: listings_history table (triggers on properties + properties_extension) + one-shot
backfill from property_details.listing_events for pre-trigger history.
Tax reassessment forecast MO · Resets to sale price
- Current annual tax
- $672 · $56/mo
- Projected year-2 tax
- $1,605 · $134/mo
- Expected delta
- +$933/yr (+$78/mo · 138.9%)
ⓘ Screening estimate from a state-policy table — verify with the county assessor before closing.
Climate risk First Street
- Flood 1/10 Low FEMA zone X (unshaded) · 0% chance over 30 yrs
- Wildfire 5/10 Major
- Heat 4/10 Moderate 7 d/yr ≥105°F today · 19 d/yr by 30 yrs out
- Wind 2/10 Low 100% chance of damaging wind over 30 yrs
- Air quality 1/10 Low 0 unhealthy d/yr today · 0 by 30 yrs out
Nearby sold comps map
Loading sold comps map…
Walkable amenities ~0.75 mi
Loading nearby amenities…
Taxation est. · year 1
- Rental income
- $15,288
- − Mortgage interest
- −$9,271
- − Property taxes
- −$672
- − Insurance
- −$828
- − Repairs & maintenance
- −$1,223
- − Management
- −$1,223
- − Depreciation
- −$4,815
- Taxable loss
- −$2,743
- Est. tax savings @ 24.0%
- +$658
- After-tax cash flow
- $821/yr
For passive investors: Depreciation is non-cash, so a rental often shows a tax loss while cash-flowing — sheltering income. Rental losses are passive: they offset passive income freely, and up to $25,000/yr can offset ordinary (W-2) income if you actively participate and your MAGI is under $100k (phasing out to $0 by $150k); unused losses carry forward. On sale, claimed depreciation is recaptured at up to 25%, and gains may owe capital-gains tax (a 1031 exchange can defer both). Figures are a year-1 estimate at your 24.0% rate — not tax advice; consult a CPA.
Schools (NCES district)
- District
- Willow Springs R-IV
- NCES district ID
- 2932070
- Math proficiency
- 34% ▲ 2.00%
- Reading proficiency
- 50% ▲ 2.00%
- Median HH income
- $32,334
- Composite
- 34.4/100
- National rank
- #5207
- State rank
- #140 of 324 in MO
Livability — Willow Springs
- Score
- 62/100
- State rank
- #386
- US rank
- #16837
Category grades
Schools grade is shown separately in the Schools card above.
Census & demographics
- Census place
- Willow Springs, MO
- City population
- 5,679
- Population (ZIP)
- 5,679
Population outlook (Howell County) Hauer SSP2
- Today (2025)
- 38,462 people
- By 2030
- 37,240 · -3.2%
- By 2040
- 34,495 · -10.3%
- By 2050
- 31,450 · -18.2%
- By 2075
- 23,660 · -38.5%
- By 2100
- 16,373 · -57.4%
Race, ethnicity, and origin ACS 2023
- Neighborhood character
- Predominantly White (89%)
- Race & ethnicity
- White 89% Two or more races 8% Hispanic / Latino 4%
- Common ancestry
- Romanian 2% Serbian 2% Slovak 1%
- Foreign-born
- 2%
- Languages at home
- 97% English-only · French/Haitian/Cajun 1% Spanish 1%
Political lean MEDSL · Howell
- 2024 margin
- Solid R (+66.8) · D 16.2% · R 83.0%
- 2008→2024 swing
- -36.0pp toward R · 2008: -30.8pp · 2024: -66.8pp
- All cycles
- 2024: R+66.8 2020: R+64.2 2016: R+63.2 2012: R+43.8 2008: R+30.8
Not yet ingested
- Civics
- —
Market trends
- HPI YoY
- ▼ -8.63%
- Current HPI
- 220.7596
- Rent YoY
- —
- Metro
- —
- State GDP YoY
- ▲ 1.84%
- F500 in state
- 20
Industry mix (Fortune 500 HQ in MO)
| Industry | F500 HQs | Revenue |
|---|---|---|
| Healthcare | 1 | $163B |
|
||
| Insurance | 1 | $21B |
|
||
| Industrial Technology | 1 | $17B |
|
||
| Retail | 1 | $16B |
|
||
| Industrial Distribution | 1 | $10B |
|
||
| Utilities | 1 | $9B |
|
||
Price history
+84.1% since first listed7 events — show timeline
- 2026-05-28 Listed $165,500 SOMO
- 2017-04-03 Sold (MLS) — SOMO
- 2017-04-03 Sold (MLS) — MARIS as Distributed by MLS Grid
- 2016-11-18 Listed $42,380 SOMO
- 2014-06-05 Listed $89,900 SOMO
- 2009-03-16 Sold (Public Records) — Public Records
- 1995-05-30 Sold (Public Records) — Public Records
Property tax history
+1.9%/yrLatest (2025): $672 · +11.8% YoY. Source: county tax records.
Cash-flow waterfall
monthlySold comps — $/sqft
last 12 mo · ≤1 miLoading sold comps…