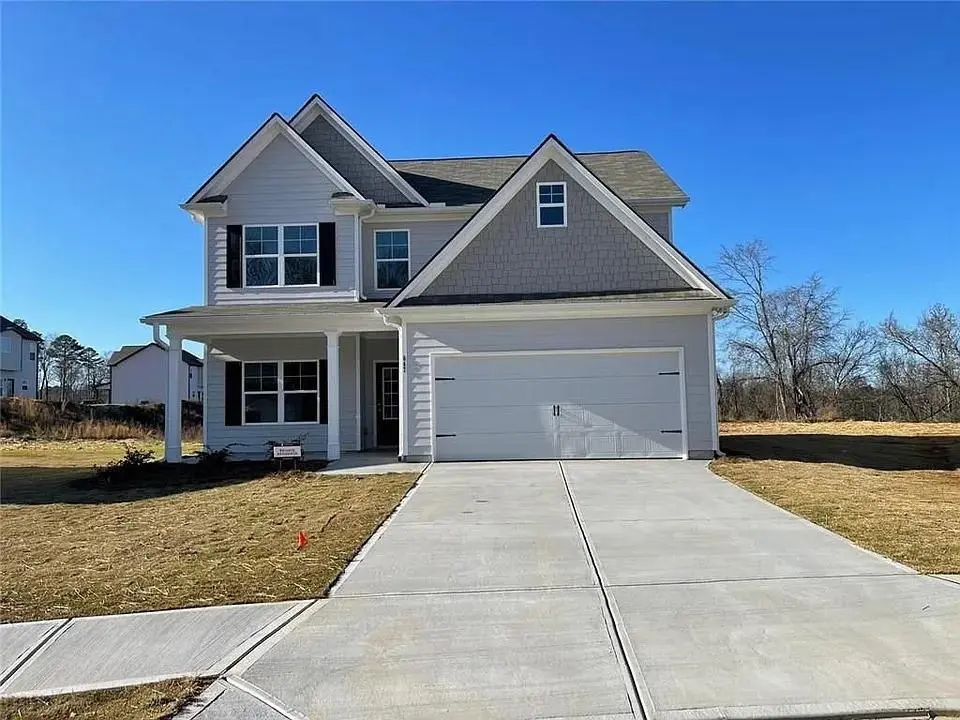
647 Skye Dr · Commerce, GA
Flood risk 1/10 · Minimal
- FEMA flood zone
- X (unshaded)
- Chance of flooding over 30 yrs
- 0.0%
- Est. flood insurance / yr
- $507 – $1,088
Fire risk 4/10 · Minor
- Est. fire insurance / yr
- $963 – $1,789
Heat risk 5/10 · Moderate
- Hot days now (above 104°F)
- 7 days/yr
- Hot days in 30 yrs
- 17 days/yr
Wind risk 4/10 · Minor
- Chance of severe wind over 30 yrs
- 11.0%
Air-quality risk 4/10 · Minor
- Unhealthy air days now
- 3 days/yr
- Unhealthy air days in 30 yrs
- 6 days/yr
Risk factors via First Street. Map © Google.
Why this score? — see what drove the D- grade
The composite is a weighted blend of 9 inputs, each scored 0–100. Each bar is that input's sub-score; the figure is the points it added to the 100-point composite (weight × sub-score).
- Appreciation +10.0/10.0
- ARV discount +8.5/15.0
- Cash flow +6.3/30.0
- Schools +4.1/10.0
- Livability +3.2/5.0
- Condition / age +2.5/5.0
- Rent growth +1.4/5.0
- 1% rule +1.2/10.0
- DSCR +0.6/10.0
$359,900
🖨 Deal sheet 📄 Offer letter ✓ Due diligence
Listing remarks MLS
Two story home with an open concept on Kitchen and family room area. Built in 2022. Four large and spacious rooms at second level. Convenient location close to I-85, Commerce downtown, Tanger Outlets and SK Battery Co. Spacious kitchen with an Island and open family room. Private and large back yard. Cul- De-Sac.
Key facts
- Open concept
- Private back yard
- Convenient location
Tags
Neighborhood map
What this means for you Summary
Snapshot
- This is a 4-bed/2.5-bath single-family listed at $360k.
Deal economics
- At list price, monthly cash flow is $-634 ($-8k/yr) — negative.
- To cash-flow at today's rent, offer at most $248k (31.1% below list).
- To meet the 1% rule (rent ≥ 1% of price), the offer needs to be $225k (37.6% below list).
- Recommended offer: $225k (37.6% below list) — sets the bar for 1% rule.
- Cap rate 4.2% vs local median 3.3% in Commerce — meaningfully above typical; check what's discounted (condition, days-on-market, listing class) to confirm the premium yield is real.
Location & tenants
- Location reads 64/100 on livability (#271 in GA) — a middle-class / working-renter tenant base. Strengths: cost of living A+, housing A+; Watch: employment D, schools D-, amenities F.
- Commerce City (town): math 49% / reading 49% proficiency, ranked #19 of 174 in GA (top 11%) — families likely to look elsewhere, expect single-tenant / working-renter base with shorter leases.
- Market conditions: Rents falling (-4.2%/yr); 151 active listings in the ZIP; 4 comparable units currently listed for rent nearby; rentals leasing fast (median 13d on market — plan ~1-2 weeks tenant-placement turnaround); 2,167 units permitted in Jackson County in 2024 (59 in 5+ unit buildings).
- This rent runs 43% of the median local income ($62k/yr) — at the standard rent-burdened threshold; future hikes will face affordability resistance.
Forward outlook
- In year one you build about $38k of equity ($2k loan paydown + $36k appreciation (10.0% local appreciation)).
- Jackson County population projected at +14% by 2050 — modest demand growth; plan on rents tracking national, not racing it.
- By year 2, paydown + projected appreciation supports a ~$62k cash-out refi (75% LTV) — recoverable capital for the next deal without selling this one.
Negotiation context
- It's been on market 189 days — a 12% lower offer ($317k) is reasonable based on typical stale-listing flexibility.
- 3 sale attempts since 3y ago; this cycle's ask is 14896% above the opening price — seller raised mid-cycle; expect resistance to lowballs.
Risks & watch-outs
- Climate carrying-cost: extreme-heat days projected 7→17/yr by 2055 (HVAC capex compounding) — expect insurance premiums to compound above CPI over the hold.
Questions for the listing agent
- What do current leases actually rent for vs. the listed asking? Can we see a recent rent roll and the last 12 months of T-12 income?
- It's been on market 189 days. Have you received any prior offers? Is the seller open to a 38% concession, seller financing, or rate buy-down credit?
- What does the HOA fee cover, when was the last increase, and are there any pending special assessments or reserve-fund shortfalls?
- Why hasn't it sold? Are there any deal-killer items the seller is aware of (foundation, flood, title, zoning, code violations)?
- Is there a deadline driving the sale (1031 exchange, divorce, estate, relocation)? That informs how much negotiation room exists.
- Schools are D-rated, which usually means shorter tenancies and higher turnover. Who's the typical renter profile here, and what's been the actual vacancy rate?
- The area grade is low — what's the realistic commute time and amenity access for the typical tenant pool here? Any planned neighborhood developments (good or bad) we should know about?
- What's the average days-on-market for RENTAL listings here right now (not sales)? A rising rental-DOM trend means longer vacancies and softer asking-rent achievability than the comps imply.
- What's the recent tenant-quality profile in this submarket — average credit score on applications, eviction rate, late-payment / NSF rate, and stable-employment percentage? A property-management company in the area should have these aggregated.
- How much new for-sale + rental construction is in the pipeline within 1–3 miles? Heavy new supply typically softens prices + rents 12–24 months out; constrained supply supports both.
Investment metrics
- 1% rule
- 0.62% ✗
- Cap rate
- 4.18%
- Cash-on-cash
- -7.55%
- DSCR
- 0.66
- GRM
- 13.3
CMA / ARV
- ARV (median comp)
- $368,409
- List price
- $359,900
- Delta
- -2.31%
- Verdict
- FAIR
- Comps
- 20 within 1.0 mi
Show comp detail 12 sales within ~0.75 mi
| Address | Dist | Beds/Ba | Sqft | Sold | Price | $/sf | Match |
|---|---|---|---|---|---|---|---|
| 131 Finley Dr | 0.14mi | 4/2.5 | 2,138 (-4%) | 14mo | $349,000 | $163 | 76 |
| 960 State St | 0.20mi | 4/3.0 | 2,238 (+1%) | 17mo | $429,000 | $192 | 73 |
| 129 Wood St | 0.38mi | 3/2.5 (-1) | 2,269 (+2%) | 1mo | $435,000 | $192 | 72 |
| 105 W E King Rd | 0.11mi | 3/2.0 (-1) | 2,004 (-10%) | 9mo | $352,500 | $176 | 65 |
| 495 Shankle Hts | 0.67mi | 4/3.0 | 2,276 (+3%) | 6mo | $305,000 | $134 | 57 |
| 992 Belmont Park Dr | 0.66mi | 3/2.5 (-1) | 2,356 (+6%) | 8mo | $349,900 | $149 | 47 |
| 992 Belmont Park Dr Lot 32B PH 1 | 0.66mi | 3/2.5 (-1) | 2,356 (+6%) | 8mo | $349,900 | $149 | 47 |
| 1088 Belmont Park Dr | 0.72mi | 3/2.5 (-1) | 2,356 (+6%) | 7mo | $357,000 | $152 | 45 |
| 1088 Belmont Park Dr Lot 37B PH1 | 0.72mi | 3/2.5 (-1) | 2,356 (+6%) | 7mo | $357,000 | $152 | 45 |
| 664 Belmont St | 0.59mi | 3/2.0 (-1) | 2,100 (-5%) | 16mo | $315,000 | $150 | 44 |
| 92 Belmont Park Dr | 0.71mi | 3/2.0 (-1) | 1,918 (-13%) | 6mo | $364,900 | $190 | 32 |
| 832 Belmont Park Dr Lot 22B PH 1 | 0.73mi | 3/2.5 (-1) | 1,971 (-11%) | 14mo | $352,900 | $179 | 31 |
Match score weights: distance 35% · size 25% · config 20% · recency 20%. Top-matched comps best support the ARV.
Projected returns pro-forma
10.0% appreciation · 0.0% rent growth · sell at horizon
- IRR
- 18.2%
- Equity multiple
- 2.48×
- Total profit
- $149,049
- Equity at exit
- $324,226
- IRR
- 16.5%
- Equity multiple
- 5.55×
- Total profit
- $458,848
- Equity at exit
- $699,207
Cash invested: $100,772 (down + closing). Projections, not guarantees.
Landlord ↔ Tenant lean methodology
- Overall (STATE)
- 90 Strongly Landlord-Friendly
- State Georgia
- 90 Strongly Landlord-Friendly · R+3
- County
- — inherits STATE
- City
- — inherits STATE
ZIP-level market 30529
- Home prices YoY
- 6.6%
- Rents YoY
- -4.2%
- Active inventory
- 151
- Price-to-rent
- 13.3×
Monthly cashflow live
- Estimated rent
- $2,247 medium interval (Pro) →
- Mortgage (P&I)
- −$1,887
- Tax from tax record
- −$346 /mo · $4,157/yr
- Insurance
- −$150
- HOA
- −$25
- Vacancy / Maint / Mgmt
- −$472
- Net cashflow
- $-634
Break-even live
UW: 25.0% down · 7.5% · 30yr · 1.5% tax · 5.0% vac · 8.0% maint · 8.0% mgmt
Financing live
Cash to close
- Down payment
- $89,975
- Closing costs
- $10,797
- Reserves months
- —
- Total cash needed
- —
Loan-product check · same deal, 3 products live
Conventional
25% down · 7.5% · 30yr
- Down + closing
- —
- Monthly P&I
- —
- Monthly cashflow
- —
- DSCR
- —
- Eligible?
- —
Personal DTI + credit; lowest rate.
DSCR
20% down · 8.5% · 30yr
- Down + closing
- —
- Monthly P&I
- —
- Monthly cashflow
- —
- DSCR
- —
- Eligible?
- —
No personal income docs; deal must DSCR.
Hard money
10% down · 12.0% · 12mo
- Down + closing
- —
- Monthly P&I
- —
- Monthly cashflow
- —
- DSCR
- —
- Eligible?
- —
Short-term bridge; refi at stabilization.
Rent comps 4 comps
| Address | Beds | Baths | Sqft | Rent | $/sqft | DOM | Units | Dist |
|---|---|---|---|---|---|---|---|---|
| 48 Leigh St Commerce, GA | 3.0 | 2.0 | 1670 | $1,950 | $1.17 | 43d | 1 | 1.26mi |
| 173 Madison St Commerce, GA | 4.0 | 2.0 | 1727 | $2,200 | $1.27 | 13d | 1 | 1.42mi |
| 71 Northwood Dr Commerce, GA | 3.0 | 3.0 | 1933 | $2,400 | $1.24 | 13d | 1 | 1.44mi |
| 2446 Remington Dr Commerce, GA | 4.0 | 2.5 | 2432 | $2,500 | $1.03 | 13d | 1 | 1.50mi |
HOA detail
- Monthly dues
- $25 · $300/yr
Listing history 22 events
-
2026-06-19days on market $359,900 Active 189 DOM
-
2026-06-18days on market $359,900 Active 188 DOM
-
2026-06-17days on market $359,900 Active 187 DOM
-
2026-06-16days on market $359,900 Active 186 DOM
-
2026-06-15days on market $359,900 Active 185 DOM
-
2026-06-14days on market $359,900 Active 183 DOM
-
2026-06-12days on market $359,900 Active 182 DOM
-
2026-06-09days on market $359,900 Active 179 DOM
-
2026-06-08days on market $359,900 Active 178 DOM
-
2026-06-07days on market $359,900 Active 177 DOM
-
2026-06-05days on market $359,900 Active 174 DOM
-
2026-06-03days on market $359,900 Active 173 DOM
-
2026-06-02days on market $359,900 Active 172 DOM
-
2026-06-01days on market $359,900 Active 171 DOM
-
2026-05-31days on market $359,900 Active 170 DOM
-
2026-05-30days on market $359,900 Active 169 DOM
-
2026-05-19price $359,900 314-char remark
Show marketing remark (314 chars)
Two story home with an open concept on Kitchen and family room area. Built in 2022. Four large and spacious rooms at second level. Convenient location close to I-85, Commerce downtown, Tanger Outlets and SK Battery Co. Spacious kitchen with an Island and open family room. Private and large back yard. Cul- De-Sac.
-
2026-04-29historical $2,400
-
2025-12-16$2,400
-
2025-12-11$369,900 Active 314-char remark
Show marketing remark (314 chars)
Two story home with an open concept on Kitchen and family room area. Built in 2022. Four large and spacious rooms at second level. Convenient location close to I-85, Commerce downtown, Tanger Outlets and SK Battery Co. Spacious kitchen with an Island and open family room. Private and large back yard. Cul- De-Sac.
-
2023-12-15historical $2,200
-
2023-11-16$2,200
ⓘ Source: listings_history table (triggers on properties + properties_extension) + one-shot
backfill from property_details.listing_events for pre-trigger history.
Tax reassessment forecast GA · Resets to sale price
- Current annual tax
- $4,157 · $346/mo
- Projected year-2 tax
- $4,157 · $346/mo
- Expected delta
- $0/yr ($0/mo · 0.0%)
ⓘ Screening estimate from a state-policy table — verify with the county assessor before closing.
Climate risk First Street
- Flood 1/10 Low FEMA zone X (unshaded) · 0% chance over 30 yrs
- Wildfire 4/10 Moderate
- Heat 5/10 Major 7 d/yr ≥104°F today · 17 d/yr by 30 yrs out
- Wind 4/10 Moderate 11% chance of damaging wind over 30 yrs
- Air quality 4/10 Moderate 3 unhealthy d/yr today · 6 by 30 yrs out
Nearby sold comps map
Loading sold comps map…
Walkable amenities ~0.75 mi
Loading nearby amenities…
Taxation est. · year 1
- Rental income
- $26,961
- − Mortgage interest
- −$20,160
- − Property taxes
- −$4,157
- − Insurance
- −$1,800
- − Repairs & maintenance
- −$2,157
- − Management
- −$2,157
- − HOA
- −$300
- − Depreciation
- −$10,470
- Taxable loss
- −$14,238
- Est. tax savings @ 24.0%
- +$3,417
- After-tax cash flow
- $-4,188/yr
For passive investors: Depreciation is non-cash, so a rental often shows a tax loss while cash-flowing — sheltering income. Rental losses are passive: they offset passive income freely, and up to $25,000/yr can offset ordinary (W-2) income if you actively participate and your MAGI is under $100k (phasing out to $0 by $150k); unused losses carry forward. On sale, claimed depreciation is recaptured at up to 25%, and gains may owe capital-gains tax (a 1031 exchange can defer both). Figures are a year-1 estimate at your 24.0% rate — not tax advice; consult a CPA.
Schools (NCES district)
- District
- Commerce City
- NCES district ID
- 1301440
- Math proficiency
- 49% ▼ -3.00%
- Reading proficiency
- 49% ▼ -6.00%
- Median HH income
- $40,945
- Composite
- 41.1/100
- National rank
- #3567
- State rank
- #19 of 174 in GA
Livability — Commerce
- Score
- 64/100
- State rank
- #271
- US rank
- #14693
Category grades
Schools grade is shown separately in the Schools card above.
Census & demographics
- Census place
- Commerce, GA
- County
- Jackson County · 50,436 people
- City population
- 12,874
- Metro
- Jefferson, GA
- Population (ZIP)
- 12,874
- Household income
- $62,168
- Rent vs Own
- Severe rent burden
- 297.0
Population outlook (Jackson County) Hauer SSP2
- Today (2025)
- 68,403 people
- By 2030
- 70,771 · +3.5%
- By 2040
- 75,050 · +9.7%
- By 2050
- 78,022 · +14.1%
- By 2075
- 82,646 · +20.8%
- By 2100
- 80,701 · +18.0%
Race, ethnicity, and origin ACS 2023
- Neighborhood character
- Predominantly White (72%)
- Race & ethnicity
- White 72% Hispanic / Latino 14% Black 11% Two or more races 9% Asian 2%
- Hispanic origin (detail)
- Mexican 8% Puerto Rican 1%
- Common ancestry
- Lithuanian 2% Slovak 2% Serbian 1%
- Foreign-born
- 5% · Canada, Jamaica
- Languages at home
- 89% English-only · Spanish 10% Other Indo-European 1%
Political lean MEDSL · Jackson
- 2024 margin
- Solid R (+55.1) · D 22.2% · R 77.2%
- 2008→2024 swing
- +0.8pp no change · 2008: -55.9pp · 2024: -55.1pp
- All cycles
- 2024: R+55.1 2020: R+58.0 2016: R+63.9 2012: R+62.9 2008: R+55.9
Not yet ingested
- Civics
- —
Market trends
- HPI YoY
- ▲ 28.53%
- Current HPI
- 458.5304
- Rent YoY
- ▼ -4.25%
- Metro
- Jefferson, GA
- State GDP YoY
- ▲ 2.66%
- F500 in state
- 28
Industry mix (Fortune 500 HQ in GA)
| Industry | F500 HQs | Revenue |
|---|---|---|
| Paper / Packaging | 2 | $29B |
|
||
| Retail | 1 | $160B |
|
||
| Transportation / Logistics | 1 | $91B |
|
||
| Airlines | 1 | $62B |
|
||
| Consumer Goods | 1 | $47B |
|
||
| Utilities | 1 | $25B |
|
||
Price history
+16259.1% since first listed6 events — show timeline
- 2026-05-19 Price Changed $359,900 FMLS
- 2026-04-29 Rental Removed $2,400 FMLS
- 2025-12-16 Listed for Rent $2,400 FMLS
- 2025-12-11 Listed $369,900 FMLS
- 2023-12-15 Rental Removed $2,200 FMLS
- 2023-11-16 Listed for Rent $2,200 FMLS
Property tax history
+66.0%/yrLatest (2025): $4,157 · -3.3% YoY. Source: county tax records.
Cash-flow waterfall
monthlySold comps — $/sqft
last 12 mo · ≤1 miLoading sold comps…