11651 NE 73rd Ln · East Bronson, FL
Flood risk 3/10 · Minor
- FEMA flood zone
- X (unshaded)
- Chance of flooding over 30 yrs
- 0.2%
- Est. flood insurance / yr
- $507 – $1,088
Fire risk 6/10 · Moderate
- Est. fire insurance / yr
- $947 – $1,759
Heat risk 9/10 · Severe
- Hot days now (above 107°F)
- 7 days/yr
- Hot days in 30 yrs
- 25 days/yr
Wind risk 9/10 · Severe
- Chance of severe wind over 30 yrs
- 99.0%
Air-quality risk 3/10 · Minor
- Unhealthy air days now
- 2 days/yr
- Unhealthy air days in 30 yrs
- 3 days/yr
Risk factors via First Street. Map © Google.
Why this score? — see what drove the C+ grade
The composite is a weighted blend of 9 inputs, each scored 0–100. Each bar is that input's sub-score; the figure is the points it added to the 100-point composite (weight × sub-score).
- Cash flow +23.8/30.0
- DSCR +7.7/10.0
- ARV discount +7.5/15.0
- Appreciation +6.2/10.0
- 1% rule +6.0/10.0
- Schools +3.6/10.0
- Livability +3.1/5.0
- Rent growth +2.5/5.0
- Condition / age +2.5/5.0
$145,000
🖨 Deal sheet (PDF) 📄 Offer letter ✓ Due diligence
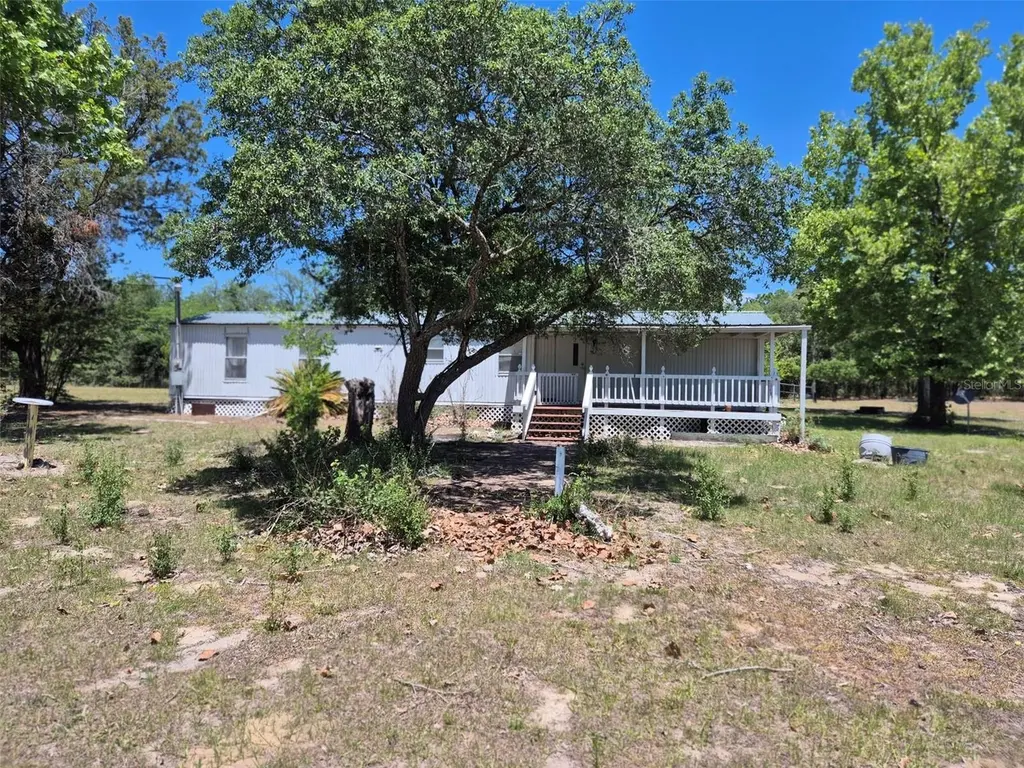
Listing remarks
5 ACRES WITH SINGLE WIDE IN BRONSON! Are you looking to own almost 5 acres in rural Levy County? Located less than 1/4 mile off paved road. Just 10 min. to Williston, 25 min to Chiefland, 35 min to Gainesville. This lot features a wide variety of mature trees including live oak, laural oak, sycamore and magnolia Cedar. Some landscaping that need to be tended to, Just waiting for your green thumb. Mobile home needs some fixing up or remove it and build your dream home or put a brand new Manufactured home.
Key facts
- Sycamore
- Laural oak
- Live oak
Tags
Property features AI
Finance
- Other: Partially furnished; Zoned RR
Exterior
- Parking: Carport with 2 spaces
- Utilities: Well water; Septic system; Electricity connected
- Home design: Residential manufactured single-wide home; Fixer condition; One story; Home faces south
- Construction: Metal siding; Metal roof; Crawlspace foundation; Built on a 4.75-acre parcel (2 to less than 5 acres)
- Exterior features: Front porch; Private mailbox; Wire fencing; Cleared lot; Located in-county; Mature landscaping with oak trees
Interior
- Kitchen: Range; Range hood
- Bedrooms: 2 bedrooms
- Flooring: Carpet; Linoleum
- Bathrooms: 2 full bathrooms
- Heating & cooling: No heating; No cooling
- Interior features: Ceiling fans
- Laundry & utility: Indoor laundry
Neighborhood map
What this means for you Summary
Snapshot
- This is a 2-bed/2.0-bath manufactured listed at $145k.
Deal economics
- At list price, monthly cash flow is $280 ($3k/yr) — positive.
- The deal already cash-flows at list — no discount required.
- Meets the 1% rule at list price ($2k rent vs $145k).
- Cap rate 8.6% vs local median 3.4% in East Bronson — top-decile yield for the area; either an underpriced asset or a hidden risk that comps aren't pricing in. Stress-test before assuming the spread holds.
Location & tenants
- Location reads 62/100 on livability (#768 in FL) — a middle-class / working-renter tenant base. Strengths: crime A+, cost of living A+, housing A+; Watch: health & safety D, amenities F, commute F.
- Levy (rural): math 45% / reading 43% proficiency, ranked #54 of 73 in FL (top 74%) — families likely to look elsewhere, expect single-tenant / working-renter base with shorter leases; 62% free/reduced lunch — lower-income household profile, screen leases tightly.
- Zoned schools: Nature Coast Middle School (math 32% / reading 42%, grade F, #399 of 571 statewide, top 71%, 90 students, 82% FRL, charter) — zoned schools average 82% FRL vs 62% district-wide (20 pts higher); higher-poverty schools than district average — tighter screening recommended.
- Market conditions: 154 active listings in the ZIP; 1 comparable units currently listed for rent nearby; 199 units permitted in Levy County in 2024 (0 in 5+ unit buildings).
Forward outlook
- In year one you build about $4k of equity ($1k loan paydown + $3k appreciation (2.4% local appreciation)).
- Levy County population projected at -28% by 2050 — secular population decline; favor cash flow + early exit over multi-decade hold.
- At projected returns (2.4% appreciation + 3.0% rent growth), your $41k cash investment doubles in ~5 years — after that, you're playing with house money.
- By year 8, paydown + projected appreciation supports a ~$33k cash-out refi (75% LTV) — recoverable capital for the next deal without selling this one.
Negotiation context
- Only 14 days on market — expect competitive offers; lowballing is unlikely to land.
Risks & watch-outs
- Climate carrying-cost: severe wind risk, 99% chance of damaging wind over 30y; major wildfire risk; extreme-heat days projected 7→25/yr by 2055 (HVAC capex compounding) — expect insurance premiums to compound above CPI over the hold.
Questions for the listing agent
- Is there a deadline driving the sale (1031 exchange, divorce, estate, relocation)? That informs how much negotiation room exists.
- Schools are F-rated, which usually means shorter tenancies and higher turnover. Who's the typical renter profile here, and what's been the actual vacancy rate?
- What's the average days-on-market for RENTAL listings here right now (not sales)? A rising rental-DOM trend means longer vacancies and softer asking-rent achievability than the comps imply.
- What's the recent tenant-quality profile in this submarket — average credit score on applications, eviction rate, late-payment / NSF rate, and stable-employment percentage? A property-management company in the area should have these aggregated.
- How much new for-sale + rental construction is in the pipeline within 1–3 miles? Heavy new supply typically softens prices + rents 12–24 months out; constrained supply supports both.
Investment metrics
- 1% rule
- 1.10% ✓
- Cap rate
- 8.61%
- Cash-on-cash
- 8.27%
- DSCR
- 1.37
- GRM
- 7.6
CMA / ARV
- ARV (on-the-fly)
- $45,360
- Comps found
- 1
Show comp detail 1 sale within ~0.75 mi
| Address | Dist | Beds/Ba | Sqft | Sold | Price | $/sf | Match |
|---|---|---|---|---|---|---|---|
| 6994 NE 106th Ter | 0.58mi | 2/1.0 | 784 (-7%) | 5mo | $42,500 | $54 | 53 |
Match score weights: distance 35% · size 25% · config 20% · recency 20%. Top-matched comps best support the ARV.
Projected returns pro-forma
2.35% appreciation · 3.0% rent growth · sell at horizon
- IRR
- 13.6%
- Equity multiple
- 1.75×
- Total profit
- $30,353
- Equity at exit
- $59,939
- IRR
- 15.9%
- Equity multiple
- 3.20×
- Total profit
- $89,435
- Equity at exit
- $88,474
Cash invested: $40,600 (down + closing). Projections, not guarantees.
Landlord ↔ Tenant lean methodology
- Overall (STATE)
- 87 Strongly Landlord-Friendly
- State Florida
- 87 Strongly Landlord-Friendly · R+3
- County
- — inherits STATE
- City
- — inherits STATE
ZIP-level market 32621
- Home prices YoY
- 0.7%
- Active inventory
- 154
- Price-to-rent
- 7.6×
Monthly cashflow live
- Estimated rent
- $1,595 medium interval (Pro) →
- Mortgage (P&I)
- −$760
- Tax from tax record
- −$159 /mo · $1,914/yr
- Insurance
- −$60
- HOA
- −$0
- Vacancy / Maint / Mgmt
- −$335
- Net cashflow
- $280
Break-even live
Sensitivity live
| Price | -10% $362 | -5% $321 | +0% $280 | +5% $239 | +10% $198 |
|---|---|---|---|---|---|
| Rent | -10% $154 | -5% $217 | +0% $280 | +5% $343 | +10% $406 |
| Rate | -1.0pp $353 | -0.5pp $317 | base $280 | +0.5pp $242 | +1.0pp $204 |
UW: 25.0% down · 7.5% · 30yr · 1.5% tax · 5.0% vac · 8.0% maint · 8.0% mgmt
Financing live
Cash to close
- Down payment
- $36,250
- Closing costs
- $4,350
- Reserves months
- —
- Total cash needed
- —
Loan-product check · same deal, 3 products live
Conventional
25% down · 7.5% · 30yr
- Down + closing
- —
- Monthly P&I
- —
- Monthly cashflow
- —
- DSCR
- —
- Eligible?
- —
Personal DTI + credit; lowest rate.
DSCR
20% down · 8.5% · 30yr
- Down + closing
- —
- Monthly P&I
- —
- Monthly cashflow
- —
- DSCR
- —
- Eligible?
- —
No personal income docs; deal must DSCR.
Hard money
10% down · 12.0% · 12mo
- Down + closing
- —
- Monthly P&I
- —
- Monthly cashflow
- —
- DSCR
- —
- Eligible?
- —
Short-term bridge; refi at stabilization.
Rent comps 1 comps
| Address | Beds | Baths | Sqft | Rent | $/sqft | DOM | Units | Dist |
|---|---|---|---|---|---|---|---|---|
| 10230 NE 72nd St Bronson, FL | 3.0 | 2.0 | 1071 | $1,595 | $1.49 | 22d | 1 | 1.39mi |
Listing history 6 events
-
2026-06-02status $145,000 Pending 14 DOM
-
2026-06-01days on market $145,000 Active 14 DOM
-
2026-05-31days on market $145,000 Active 13 DOM
-
2026-05-30days on market $145,000 Active 12 DOM
-
2026-05-13status Pending
-
2026-05-06$145,000 Active
ⓘ Source: listings_history table (triggers on properties + properties_extension) + one-shot
backfill from property_details.listing_events for pre-trigger history.
Tax reassessment forecast FL · Resets to sale price
- Current annual tax
- $1,914 · $159/mo
- Projected year-2 tax
- $1,914 · $159/mo
- Expected delta
- $0/yr ($0/mo · 0.0%)
ⓘ Screening estimate from a state-policy table — verify with the county assessor before closing.
Climate risk First Street
- Flood 3/10 Moderate FEMA zone X (unshaded) · 20% chance over 30 yrs
- Wildfire 6/10 Major
- Heat 9/10 Extreme 7 d/yr ≥107°F today · 25 d/yr by 30 yrs out
- Wind 9/10 Extreme 99% chance of damaging wind over 30 yrs
- Air quality 3/10 Moderate 2 unhealthy d/yr today · 3 by 30 yrs out
Nearby sold comps map
Loading sold comps map…
Walkable amenities ~0.75 mi
Loading nearby amenities…
Taxation est. · year 1
- Rental income
- $19,140
- − Mortgage interest
- −$8,122
- − Property taxes
- −$1,914
- − Insurance
- −$725
- − Repairs & maintenance
- −$1,531
- − Management
- −$1,531
- − Depreciation
- −$4,218
- Taxable income
- $1,099
- Est. tax owed @ 24.0%
- −$264
- After-tax cash flow
- $3,094/yr
For passive investors: Depreciation is non-cash, so a rental often shows a tax loss while cash-flowing — sheltering income. Rental losses are passive: they offset passive income freely, and up to $25,000/yr can offset ordinary (W-2) income if you actively participate and your MAGI is under $100k (phasing out to $0 by $150k); unused losses carry forward. On sale, claimed depreciation is recaptured at up to 25%, and gains may owe capital-gains tax (a 1031 exchange can defer both). Figures are a year-1 estimate at your 24.0% rate — not tax advice; consult a CPA.
Schools (NCES district)
- District
- Levy
- NCES district ID
- 1201140
- Math proficiency
- 45% ▼ -8.00%
- Reading proficiency
- 43% ▼ -3.00%
- Median HH income
- $35,254
- Composite
- 36.42/100
- National rank
- #4673
- State rank
- #54 of 73 in FL
Livability — East Bronson
- Score
- 62/100
- State rank
- #768
- US rank
- #17230
Category grades
Schools grade is shown separately in the Schools card above.
Census & demographics
- Census place
- East Bronson, FL
- Population (ZIP)
- 5,540
Population outlook (Levy County) Hauer SSP2
- Today (2025)
- 36,536 people
- By 2030
- 34,498 · -5.6%
- By 2040
- 30,294 · -17.1%
- By 2050
- 26,368 · -27.8%
- By 2075
- 19,003 · -48.0%
- By 2100
- 13,169 · -64.0%
Race, ethnicity, and origin ACS 2023
- Neighborhood character
- Predominantly White (68%)
- Race & ethnicity
- White 68% Hispanic / Latino 14% Black 9% Two or more races 9% Asian 3%
- Hispanic origin (detail)
- Mexican 4% Puerto Rican 6% Cuban 1%
- Common ancestry
- Romanian 2% Lithuanian 2% Serbian 1%
- Foreign-born
- 4% · Canada, Jamaica
- Languages at home
- 91% English-only · Spanish 8%
Political lean MEDSL · Levy
- 2024 margin
- Solid R (+50.3) · D 24.6% · R 74.8%
- 2008→2024 swing
- -23.3pp toward R · 2008: -26.9pp · 2024: -50.3pp
- All cycles
- 2024: R+50.3 2020: R+45.6 2016: R+44.8 2012: R+32.2 2008: R+26.9
Not yet ingested
- Civics
- —
Market trends
- HPI YoY
- ▲ 2.35%
- Current HPI
- 340.879
- Rent YoY
- —
- Metro
- —
- State GDP YoY
- ▲ 3.28%
- F500 in state
- 36
Industry mix (Fortune 500 HQ in FL)
| Industry | F500 HQs | Revenue |
|---|---|---|
| Industrial Technology | 2 | $29B |
|
||
| Insurance | 2 | $17B |
|
||
| Retail | 1 | $60B |
|
||
| Technology Distribution | 1 | $58B |
|
||
| Homebuilding | 1 | $35B |
|
||
| Technology Manufacturing | 1 | $35B |
|
||
Price history
2 events — show timeline
- 2026-05-13 Pending — Stellar MLS as Distributed by MLS Grid
- 2026-05-06 Listed $145,000 Stellar MLS as Distributed by MLS Grid
Property tax history
+14.4%/yrLatest (2025): $1,914 · +16.7% YoY. Source: county tax records.
Cash-flow waterfall
monthlySold comps — $/sqft
last 12 mo · ≤1 miLoading sold comps…