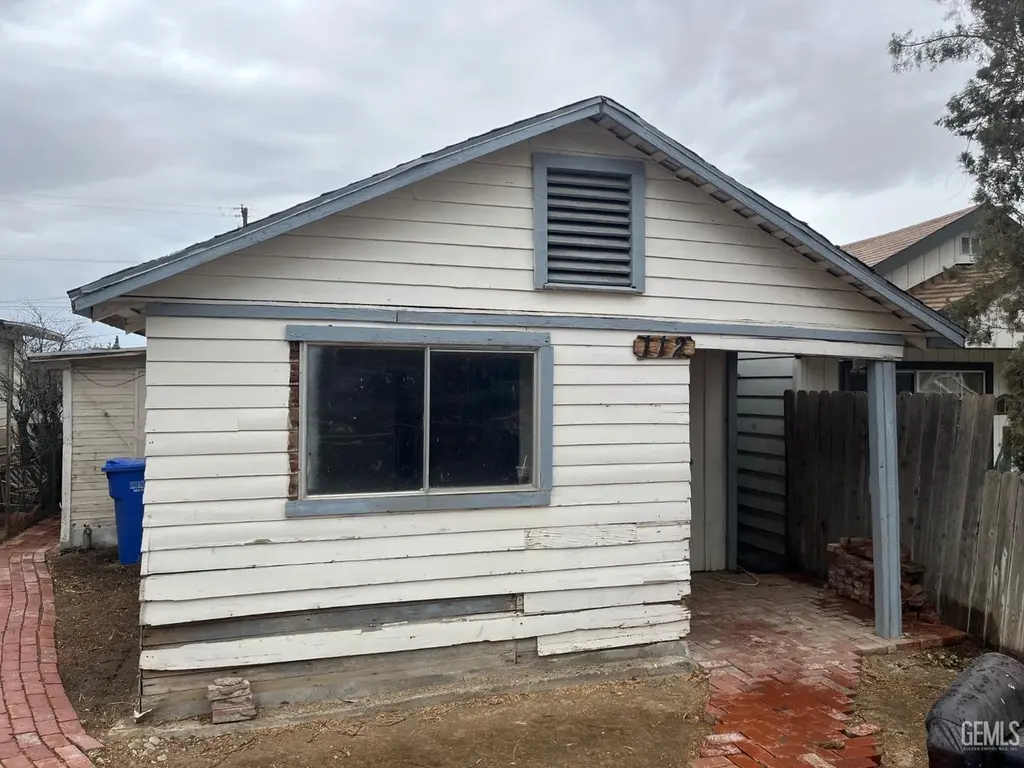
112 Lucard St · Taft, CA
Flood risk 1/10 · Minimal
- FEMA flood zone
- X (unshaded)
- Chance of flooding over 30 yrs
- 0.0%
- Est. flood insurance / yr
- $507 – $1,088
Fire risk 7/10 · Major
- Est. fire insurance / yr
- $659 – $1,223
Heat risk 8/10 · Major
- Hot days now (above 102°F)
- 5 days/yr
- Hot days in 30 yrs
- 12 days/yr
Wind risk 1/10 · Minimal
- Chance of severe wind over 30 yrs
- —
Air-quality risk 8/10 · Major
- Unhealthy air days now
- 18 days/yr
- Unhealthy air days in 30 yrs
- 22 days/yr
Risk factors via First Street. Map © Google.
Why this score? — see what drove the C- grade
The composite is a weighted blend of 9 inputs, each scored 0–100. Each bar is that input's sub-score; the figure is the points it added to the 100-point composite (weight × sub-score).
- ARV discount +14.9/15.0
- Cash flow +13.7/30.0
- Rent growth +5.0/5.0
- 1% rule +4.8/10.0
- DSCR +4.1/10.0
- Schools +3.1/10.0
- Livability +2.7/5.0
- Condition / age +2.5/5.0
- Appreciation +0.0/10.0
$92,500
🖨 Deal sheet (PDF) 📄 Offer letter ✓ Due diligence
Listing remarks
Investors Special!Cute 1-bedroom, 1 bath home with great potnetial!This property needs some TLC but offers an excellent opportunity for investors, first-time buyers, or anyone looking to create their own cozy space. Ideal as a starter home for a small family. Conviently located close to schools , shopping and evertday amenities. Bring your vision and make this property shine!Don't miss the affordable opportunity - schedule your showing today !
Key facts
- 3,049 sq ft lot
- Built 1925
- Listed 6 days
Property features AI
Finance
- Other: Lot is approximately 0.07 acre; Subdivision: Southern Pacific La; Cross street: 2nd
Exterior
- Parking: Uncovered parking
- Utilities: Public water; Sewer
- Home design: Single-family residence (R1 zoning)
- Construction: Composition roof
- Exterior features: Uncovered patio; Vacant occupant status
Interior
- Bathrooms: 1 full bathroom
- Heating & cooling: Evaporative cooling; Floor/wall heating
- Interior features: Evaporative cooling; Floor/wall heaters; No fireplace
Neighborhood map
What this means for you Summary
Snapshot
- This is a 1-bed/1.0-bath single-family listed at $92k.
Deal economics
- At list price, monthly cash flow is $6 ($73/yr) — positive.
- The deal already cash-flows at list — no discount required.
- To meet the 1% rule (rent ≥ 1% of price), the offer needs to be $91k (1.9% below list).
- Recommended offer: $91k (1.9% below list) — sets the bar for 1% rule.
- Cap rate 6.4% vs local median 3.3% in Taft — top-decile yield for the area; either an underpriced asset or a hidden risk that comps aren't pricing in. Stress-test before assuming the spread holds.
Location & tenants
- Location reads 53/100 on livability (#945 in CA) — a working-class tenant base; expect higher turnover. Strengths: housing A+; Watch: cost of living C-, employment D+, crime F.
- Taft City (town): math 28% / reading 39% proficiency, ranked #946 of 1,400 in CA (top 68%) — families likely to look elsewhere, expect single-tenant / working-renter base with shorter leases; 67% free/reduced lunch — lower-income household profile, screen leases tightly.
- Zoned schools: Roosevelt Elementary (math 24% / reading 24%, grade F, #973 of 1,571 statewide, top 73%, 475 students, 89% FRL); Lincoln Junior High (math 75% / reading 75%, grade A, #25 of 498 statewide, top 6%, 795 students, 89% FRL); Taft Union High (math 8% / reading 47%, grade F, #785 of 1,170 statewide, top 67%, 1,102 students, 59% FRL).
- Market conditions: Rents rising fast (+13.6%/yr); 125 active listings in the ZIP; 2 comparable units currently listed for rent nearby; 3,244 units permitted in Kern County in 2024 (73 in 5+ unit buildings).
Forward outlook
- Local home prices are declining (-3.0%/yr); year-one equity from $640 of loan paydown is wiped out by about $3k of value loss. Plan a longer hold.
- Kern County population projected at +17% by 2050 — long-run rental-demand tailwind backs the buy-and-hold thesis.
Negotiation context
- Only 6 days on market — expect competitive offers; lowballing is unlikely to land.
- Current owner paid $56k; list at $92k implies a 64% gain — meaningful room to come down on a strong offer.
Risks & watch-outs
- Watch-outs: built in 1925 — expect roof / HVAC / electrical / plumbing capex.
- Climate carrying-cost: major wildfire risk; extreme-heat days projected 5→12/yr by 2055 (HVAC capex compounding) — expect insurance premiums to compound above CPI over the hold.
Questions for the listing agent
- Built in 1925 — when were the roof, HVAC, electrical panel, plumbing, and water heater last replaced?
- Is there a deadline driving the sale (1031 exchange, divorce, estate, relocation)? That informs how much negotiation room exists.
- Schools are D-rated, which usually means shorter tenancies and higher turnover. Who's the typical renter profile here, and what's been the actual vacancy rate?
- Crime grade is F in this area — have there been break-ins, vandalism, or insurance claims at this property in the last 3 years? What carrier currently insures it and at what premium?
- What's the average days-on-market for RENTAL listings here right now (not sales)? A rising rental-DOM trend means longer vacancies and softer asking-rent achievability than the comps imply.
- What's the recent tenant-quality profile in this submarket — average credit score on applications, eviction rate, late-payment / NSF rate, and stable-employment percentage? A property-management company in the area should have these aggregated.
- How much new for-sale + rental construction is in the pipeline within 1–3 miles? Heavy new supply typically softens prices + rents 12–24 months out; constrained supply supports both.
Investment metrics
- 1% rule
- 0.98% ✗
- Cap rate
- 6.37%
- Cash-on-cash
- 0.28%
- DSCR
- 1.01
- GRM
- 8.5
CMA / ARV
- ARV (on-the-fly)
- $110,732
- Comps found
- 6
Show comp detail 6 sales within ~0.75 mi
| Address | Dist | Beds/Ba | Sqft | Sold | Price | $/sf | Match |
|---|---|---|---|---|---|---|---|
| 112 Lucard St | 0.00mi | 1/1.0 | 589 (0%) | 0mo | $90,000 | $153 | 100 |
| 406 5th St | 0.31mi | 2/1.0 (+1) | 612 (+4%) | 11mo | $115,000 | $188 | 64 |
| 325 Lucard St | 0.21mi | 1/1.0 | 507 (-14%) | 17mo | $108,000 | $213 | 53 |
| 505 5th St | 0.33mi | 1/1.0 | 512 (-13%) | 17mo | $48,000 | $94 | 49 |
| 218 Warren St | 0.22mi | 2/1.0 (+1) | 660 (+12%) | 20mo | $154,500 | $234 | 48 |
| 1016 Buena Vista St | 0.72mi | 2/1.0 (+1) | 646 (+10%) | 4mo | $60,000 | $93 | 42 |
Match score weights: distance 35% · size 25% · config 20% · recency 20%. Top-matched comps best support the ARV.
Projected returns pro-forma
-3.0% appreciation · 8.0% rent growth · sell at horizon
- IRR
- -9.8%
- Equity multiple
- 0.62×
- Total profit
- $-9,746
- Equity at exit
- $13,792
- IRR
- 5.9%
- Equity multiple
- 1.54×
- Total profit
- $14,077
- Equity at exit
- $7,998
Cash invested: $25,900 (down + closing). Projections, not guarantees.
Landlord ↔ Tenant lean methodology
- Overall (STATE)
- 18 Strongly Tenant-Friendly
- State California
- 18 Strongly Tenant-Friendly · D+13
- County
- — inherits STATE
- City
- — inherits STATE
ZIP-level market 93268
- Home prices YoY
- -29.6%
- Rents YoY
- 13.6%
- Active inventory
- 125
- Price-to-rent
- 8.5×
Monthly cashflow live
- Estimated rent
- $908 medium interval (Pro) →
- Mortgage (P&I)
- −$485
- Tax from tax record
- −$187 /mo · $2,247/yr
- Insurance
- −$39
- HOA
- −$0
- Vacancy / Maint / Mgmt
- −$191
- Net cashflow
- $6
Break-even live
Sensitivity live
| Price | -10% $58 | -5% $32 | +0% $6 | +5% $-20 | +10% $-46 |
|---|---|---|---|---|---|
| Rent | -10% $-66 | -5% $-30 | +0% $6 | +5% $42 | +10% $78 |
| Rate | -1.0pp $53 | -0.5pp $30 | base $6 | +0.5pp $-18 | +1.0pp $-42 |
UW: 25.0% down · 7.5% · 30yr · 1.5% tax · 5.0% vac · 8.0% maint · 8.0% mgmt
Financing live
Cash to close
- Down payment
- $23,125
- Closing costs
- $2,775
- Reserves months
- —
- Total cash needed
- —
Loan-product check · same deal, 3 products live
Conventional
25% down · 7.5% · 30yr
- Down + closing
- —
- Monthly P&I
- —
- Monthly cashflow
- —
- DSCR
- —
- Eligible?
- —
Personal DTI + credit; lowest rate.
DSCR
20% down · 8.5% · 30yr
- Down + closing
- —
- Monthly P&I
- —
- Monthly cashflow
- —
- DSCR
- —
- Eligible?
- —
No personal income docs; deal must DSCR.
Hard money
10% down · 12.0% · 12mo
- Down + closing
- —
- Monthly P&I
- —
- Monthly cashflow
- —
- DSCR
- —
- Eligible?
- —
Short-term bridge; refi at stabilization.
Rent comps 2 comps
| Address | Beds | Baths | Sqft | Rent | $/sqft | DOM | Units | Dist |
|---|---|---|---|---|---|---|---|---|
| 155 1/2 North St Unit C Taft, CA | 1.0 | 1.0 | 644 | $875 | $1.36 | 4d | 1 | 0.18mi |
| 319 1/2 San Emidio St Apt B Taft, CA | 1.0 | 1.0 | 700 | $900 | $1.29 | 12d | 1 | 0.22mi |
Listing history 6 events
-
2026-06-09status $92,500 Pending 6 DOM
-
2026-06-08days on market $92,500 Active 6 DOM
-
2026-06-07days on market $92,500 Active 5 DOM
-
2026-06-05days on market $92,500 Active 2 DOM
-
2026-06-03remarks 447-char remark
-
2026-06-03$92,500 Active 1 DOM
ⓘ Source: listings_history table (triggers on properties + properties_extension) + one-shot
backfill from property_details.listing_events for pre-trigger history.
Tax reassessment forecast CA · Resets to sale price
- Current annual tax
- $2,247 · $187/mo
- Projected year-2 tax
- $2,247 · $187/mo
- Expected delta
- $0/yr ($0/mo · 0.0%)
ⓘ Screening estimate from a state-policy table — verify with the county assessor before closing.
Climate risk First Street
- Flood 1/10 Low FEMA zone X (unshaded) · 0% chance over 30 yrs
- Wildfire 7/10 Severe
- Heat 8/10 Severe 5 d/yr ≥102°F today · 12 d/yr by 30 yrs out
- Wind 1/10 Low
- Air quality 8/10 Severe 18 unhealthy d/yr today · 22 by 30 yrs out
Nearby sold comps map
Loading sold comps map…
Walkable amenities ~0.75 mi
Loading nearby amenities…
Taxation est. · year 1
- Rental income
- $10,890
- − Mortgage interest
- −$5,181
- − Property taxes
- −$2,247
- − Insurance
- −$462
- − Repairs & maintenance
- −$871
- − Management
- −$871
- − Depreciation
- −$2,691
- Taxable loss
- −$1,434
- Est. tax savings @ 24.0%
- +$344
- After-tax cash flow
- $417/yr
For passive investors: Depreciation is non-cash, so a rental often shows a tax loss while cash-flowing — sheltering income. Rental losses are passive: they offset passive income freely, and up to $25,000/yr can offset ordinary (W-2) income if you actively participate and your MAGI is under $100k (phasing out to $0 by $150k); unused losses carry forward. On sale, claimed depreciation is recaptured at up to 25%, and gains may owe capital-gains tax (a 1031 exchange can defer both). Figures are a year-1 estimate at your 24.0% rate — not tax advice; consult a CPA.
Schools (NCES district)
- District
- Taft City
- NCES district ID
- 0638700
- Math proficiency
- 28% ▲ 2.00%
- Reading proficiency
- 39% ▲ 2.00%
- Median HH income
- $42,498
- Composite
- 31.06/100
- National rank
- #11302
- State rank
- #946 of 1400 in CA
Livability — Taft
- Score
- 53/100
- State rank
- #945
- US rank
- #24400
Category grades
Schools grade is shown separately in the Schools card above.
Census & demographics
- Census place
- Taft, CA
- County
- Kern County · 710,371 people
- City population
- 16,963
- Metro
- Bakersfield, CA
- Population (ZIP)
- 16,963
- Household income
- $57,778
- Rent vs Own
- Severe rent burden
- 819.0
Population outlook (Kern County) Hauer SSP2
- Today (2025)
- 947,286 people
- By 2030
- 978,984 · +3.3%
- By 2040
- 1,045,018 · +10.3%
- By 2050
- 1,105,232 · +16.7%
- By 2075
- 1,229,538 · +29.8%
- By 2100
- 1,238,059 · +30.7%
Race, ethnicity, and origin ACS 2023
- Neighborhood character
- Majority White (51%)
- Race & ethnicity
- White 51% Hispanic / Latino 44% Two or more races 14%
- Hispanic origin (detail)
- Mexican 42%
- Common ancestry
- Slovak 2% Italian 1% Portuguese 1%
- Foreign-born
- 16% · Canada
- Languages at home
- 65% English-only · Spanish 34%
Political lean MEDSL · Kern
- 2024 margin
- Strong R (+21.1) · D 38.2% · R 59.3% · Other 2.5%
- 2008→2024 swing
- -3.3pp toward R · 2008: -17.8pp · 2024: -21.1pp
- All cycles
- 2024: R+21.1 2020: R+10.2 2016: R+15.0 2012: R+20.9 2008: R+17.8
Not yet ingested
- Civics
- —
Market trends
- HPI YoY
- ▼ -124.10%
- Current HPI
- 295.2655
- Rent YoY
- ▲ 13.62%
- Metro
- Bakersfield, CA
- State GDP YoY
- ▲ 3.21%
- F500 in state
- 116
Industry mix (Fortune 500 HQ in CA)
| Industry | F500 HQs | Revenue |
|---|---|---|
| Technology | 27 | $1,492B |
|
||
| Financial Services | 3 | $174B |
|
||
| Retail | 3 | $44B |
|
||
| Insurance | 3 | $26B |
|
||
| Media / Entertainment | 2 | $115B |
|
||
| Pharmaceuticals / Biotech | 2 | $62B |
|
||
Price history
+63.7% since first listed2 events — show timeline
- 2026-06-02 Listed $92,500 GEMLS
- 2004-12-23 Sold (Public Records) $56,500 Public Records
Property tax history
+8.2%/yrLatest (2025): $2,247 · +1.6% YoY. Source: county tax records.
Cash-flow waterfall
monthlySold comps — $/sqft
last 12 mo · ≤1 miLoading sold comps…