46-01 39th Ave #106 · New York, NY
Flood risk 7/10 · Major
- FEMA flood zone
- X (unshaded)
- Chance of flooding over 30 yrs
- 0.77%
- Est. flood insurance / yr
- $507 – $1,088
Fire risk 1/10 · Minimal
- Est. fire insurance / yr
- $691 – $1,283
Heat risk 6/10 · Moderate
- Hot days now (above 99°F)
- 7 days/yr
- Hot days in 30 yrs
- 15 days/yr
Wind risk 6/10 · Moderate
- Chance of severe wind over 30 yrs
- 27.0%
Air-quality risk 5/10 · Moderate
- Unhealthy air days now
- 6 days/yr
- Unhealthy air days in 30 yrs
- 8 days/yr
Risk factors via First Street. Map © Google.
Why this score? — see what drove the D grade
The composite is a weighted blend of 9 inputs, each scored 0–100. Each bar is that input's sub-score; the figure is the points it added to the 100-point composite (weight × sub-score).
- Cash flow +9.8/30.0
- ARV discount +7.5/15.0
- Schools +5.0/10.0
- Rent growth +4.1/5.0
- Livability +3.8/5.0
- Appreciation +3.6/10.0
- 1% rule +2.9/10.0
- DSCR +2.8/10.0
- Condition / age +2.5/5.0
$599,000
🖨 Deal sheet 📄 Offer letter ✓ Due diligence
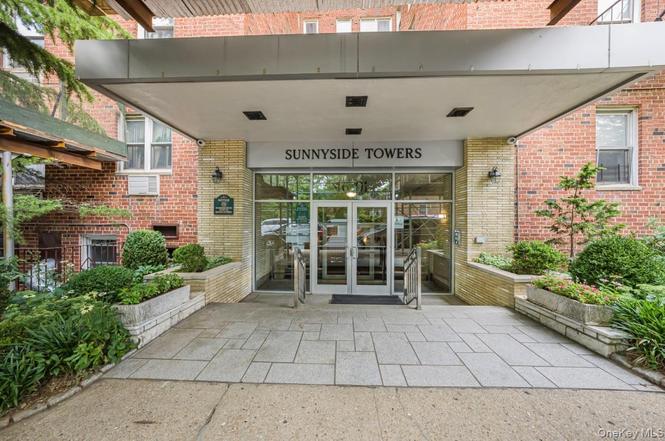
Listing remarks
NEW PRICE! . .. .. .. Location. .Location. .. Discover this spacious 2- bedroom, 2- bathroom apartment in the heart of Sunnyside Gardens. Located in the sought-after Sunnyside Towers co-op, this home offers exclusive access to a beautiful outdoor pool, perfect for summer relaxation. Enjoy the barbecue area to grill up some bbq treats. The building also features two convenient 24 hour laundry facilities with washers and dryers. All this in a charming, tree-lined neighborhood just minutes from Manhattan. 3 blocks for the 7-train. The Q60 & Q32 are located on Queens Blvd & 46th street. A rare opportunity-come see it before it's gone.
Key facts
- Built 1961
- Listed 289 days
Property features AI
Exterior
- Parking: No carport
- Utilities: Public sewer; Trash collection (public)
- Home design: Stock cooperative
- Construction: Brick construction
- Exterior features: Brick exterior; Not waterfront
Interior
- Kitchen: Appliances: Other
- Bedrooms: 5 total rooms (bedroom count not specified)
- Bathrooms: 2 full bathrooms
- Heating & cooling: Hot water heating; Wall or window cooling units
- Interior features: Elevator; Cats allowed
- Laundry & utility: No basement
Neighborhood map
What this means for you Summary
Snapshot
- This is a 2-bed/2.0-bath condo listed at $599k.
Deal economics
- At list price, monthly cash flow is $-452 ($-5k/yr) — negative.
- To cash-flow at today's rent, offer at most $534k (10.9% below list).
- To meet the 1% rule (rent ≥ 1% of price), the offer needs to be $475k (20.7% below list).
- Recommended offer: $475k (20.7% below list) — sets the bar for 1% rule.
- Cap rate 5.5% vs local median 2.6% in New York — top-decile yield for the area; either an underpriced asset or a hidden risk that comps aren't pricing in. Stress-test before assuming the spread holds.
Location & tenants
- Location reads 75/100 on livability (#268 in NY, #4,188 nationally) — a middle-class / working-renter tenant base. Strengths: amenities A+, commute A+, health & safety A; Watch: crime F, cost of living F.
- Market conditions: Rents rising fast (+6.3%/yr); 78 active listings in the ZIP; 6 comparable units currently listed for rent nearby; rentals at typical pace (median 14d on market — plan ~3-4 weeks tenant-placement turnaround); solid renter incomes; 5,302 units permitted in Queens County in 2024 (4,918 in 5+ unit buildings).
- At $4,752/mo this rent would consume 71% of the median local household income ($81k/yr) (locally 1859% of renters already pay >50% of income on rent) — very limited rent-growth headroom before tenants either downsize or default.
Forward outlook
- Local home prices are declining (-2.7%/yr); year-one equity from $4k of loan paydown is wiped out by about $16k of value loss. Plan a longer hold.
- Queens County population projected at +16% by 2050 — long-run rental-demand tailwind backs the buy-and-hold thesis.
Negotiation context
- It's been on market 289 days — a 12% lower offer ($527k) is reasonable based on typical stale-listing flexibility.
Risks & watch-outs
- Watch-outs: flood insurance adds $66/mo.
- Climate carrying-cost: major flood risk; major wind risk, 27% chance of damaging wind over 30y; extreme-heat days projected 7→15/yr by 2055 (HVAC capex compounding) — expect insurance premiums to compound above CPI over the hold.
Questions for the listing agent
- What do current leases actually rent for vs. the listed asking? Can we see a recent rent roll and the last 12 months of T-12 income?
- It's been on market 289 days. Have you received any prior offers? Is the seller open to a 21% concession, seller financing, or rate buy-down credit?
- Built in 1961 — when were the roof, HVAC, electrical panel, plumbing, and water heater last replaced?
- What's the actual annual flood-insurance premium (NFIP or private), and is the property in a SFHA with mandatory coverage?
- Any open or pending special assessments — roof, HVAC, plumbing, elevator, façade? What's the per-unit balance and payoff schedule, and is the seller paying it off at close or rolling it to the buyer?
- Why hasn't it sold? Are there any deal-killer items the seller is aware of (foundation, flood, title, zoning, code violations)?
- Is there a deadline driving the sale (1031 exchange, divorce, estate, relocation)? That informs how much negotiation room exists.
- Schools are B-rated — typically a magnet for longer-tenancy family renters. What's the average tenant stay here, and is there a school-zone premium baked into asking?
- Crime grade is F in this area — have there been break-ins, vandalism, or insurance claims at this property in the last 3 years? What carrier currently insures it and at what premium?
- The area grade is low — what's the realistic commute time and amenity access for the typical tenant pool here? Any planned neighborhood developments (good or bad) we should know about?
- What's the average days-on-market for RENTAL listings here right now (not sales)? A rising rental-DOM trend means longer vacancies and softer asking-rent achievability than the comps imply.
- What's the recent tenant-quality profile in this submarket — average credit score on applications, eviction rate, late-payment / NSF rate, and stable-employment percentage? A property-management company in the area should have these aggregated.
- How much new apartment / multifamily construction is in the pipeline within 1–3 miles? Heavy new supply (>2% of stock underway) typically softens rents 12–24 months out; light construction supports rent growth.
Investment metrics
- 1% rule
- 0.79% ✗
- Cap rate
- 5.52%
- Cash-on-cash
- -2.76%
- DSCR
- 0.88
- GRM
- 10.5
CMA / ARV
No comps found within radius.
Projected returns pro-forma
-2.71% appreciation · 6.31% rent growth · sell at horizon
- IRR
- -16.2%
- Equity multiple
- 0.39×
- Total profit
- $-102,060
- Equity at exit
- $97,094
- IRR
- -3.6%
- Equity multiple
- 0.72×
- Total profit
- $-47,351
- Equity at exit
- $65,255
Cash invested: $167,720 (down + closing). Projections, not guarantees.
Landlord ↔ Tenant lean methodology
- Overall (CITY)
- 0 Strongly Tenant-Friendly
- State New York
- 15 Strongly Tenant-Friendly · D+10
- County
- — inherits STATE
- City New York
- 0 Strongly Tenant-Friendly · D+34
ZIP-level market 11104
- Home prices YoY
- -1.2%
- Rents YoY
- 6.3%
- Active inventory
- 78
- Price-to-rent
- 10.5×
Monthly cashflow live
- Estimated rent
- $4,752 high interval (Pro) →
- Mortgage (P&I)
- −$3,141
- Tax est. 1.5%
- −$749 /mo · $8,985/yr
- Insurance
- −$250
- Flood insurance flood zone
- −$66 /mo · $798/yr
- HOA
- −$0
- Vacancy / Maint / Mgmt
- −$998
- Net cashflow
- $-452
Break-even live
UW: 25.0% down · 7.5% · 30yr · 1.5% tax · 5.0% vac · 8.0% maint · 8.0% mgmt
Financing live
Cash to close
- Down payment
- $149,750
- Closing costs
- $17,970
- Reserves months
- —
- Total cash needed
- —
Loan-product check · same deal, 3 products live
Conventional
25% down · 7.5% · 30yr
- Down + closing
- —
- Monthly P&I
- —
- Monthly cashflow
- —
- DSCR
- —
- Eligible?
- —
Personal DTI + credit; lowest rate.
DSCR
20% down · 8.5% · 30yr
- Down + closing
- —
- Monthly P&I
- —
- Monthly cashflow
- —
- DSCR
- —
- Eligible?
- —
No personal income docs; deal must DSCR.
Hard money
10% down · 12.0% · 12mo
- Down + closing
- —
- Monthly P&I
- —
- Monthly cashflow
- —
- DSCR
- —
- Eligible?
- —
Short-term bridge; refi at stabilization.
Rent comps 6 comps
| Address | Beds | Baths | Sqft | Rent | $/sqft | DOM | Units | Dist |
|---|---|---|---|---|---|---|---|---|
| 34-35 44th St Astoria, NY | 1.0–2.0 | 1.0–2.0 | 613 | $5,794 | $9.45 | 1d | 26 | 0.32mi |
| 3705 30th St Long Island City, NY | 2.0 | 1.0–2.0 | 700 | $6,180 | $8.83 | 10d | 3 | 0.86mi |
| 30-37 38th St Unit 4 Astoria, NY | 3.0 | 2.0 | 1200 | $5,200 | $4.33 | 14d | 1 | 0.91mi |
| 4126 27th St Unit 6D Long Island City, NY | 2.0 | 2.0 | 1203 | $4,990 | $4.15 | 24d | 1 | 1.16mi |
| 2719 44th Dr Long Island City, NY | 1.0 | 1.0 | 628 | $4,945 | $7.87 | 7d | 2 | 1.32mi |
| 3 Court Sq W #907 Long Island City, NY | 2.0 | 2.0 | 930 | $6,300 | $6.77 | 24d | 1 | 1.45mi |
HOA detail condo
- Monthly dues
- $0 · $0/yr
- Likely covers
- pool
- Assessments
- None detected in remarks — confirm with the listing agent.
Listing history 6 events
-
2026-04-21status Pending
-
2026-02-18price $599,000
-
2026-01-02price $625,000
-
2025-07-23price $675,000
-
2025-07-07$699,000 Active
-
2025-06-25historical $699,000
ⓘ Source: listings_history table (triggers on properties + properties_extension) + one-shot
backfill from property_details.listing_events for pre-trigger history.
Climate risk First Street
- Flood 7/10 Severe FEMA zone X (unshaded) · 77% chance over 30 yrs
- Wildfire 1/10 Low
- Heat 6/10 Major 7 d/yr ≥99°F today · 15 d/yr by 30 yrs out
- Wind 6/10 Major 27% chance of damaging wind over 30 yrs
- Air quality 5/10 Major 6 unhealthy d/yr today · 8 by 30 yrs out
Nearby sold comps map
Loading sold comps map…
Walkable amenities ~0.75 mi
Loading nearby amenities…
Taxation est. · year 1
- Rental income
- $57,026
- − Mortgage interest
- −$33,553
- − Property taxes
- −$8,985
- − Insurance
- −$3,792
- − Repairs & maintenance
- −$4,562
- − Management
- −$4,562
- − Depreciation
- −$17,425
- Taxable loss
- −$15,854
- Est. tax savings @ 24.0%
- +$3,805
- After-tax cash flow
- $-1,616/yr
For passive investors: Depreciation is non-cash, so a rental often shows a tax loss while cash-flowing — sheltering income. Rental losses are passive: they offset passive income freely, and up to $25,000/yr can offset ordinary (W-2) income if you actively participate and your MAGI is under $100k (phasing out to $0 by $150k); unused losses carry forward. On sale, claimed depreciation is recaptured at up to 25%, and gains may owe capital-gains tax (a 1031 exchange can defer both). Figures are a year-1 estimate at your 24.0% rate — not tax advice; consult a CPA.
Schools (NCES district)
No district data.
Livability — New York
- Score
- 75/100
- State rank
- #268
- US rank
- #4188
Category grades
Schools grade is shown separately in the Schools card above.
Census & demographics
- Census place
- New York, NY
- County
- Queens County · 1,914,869 people
- City population
- 7,731,280
- Metro
- New York-Newark-Jersey City, NY-NJ-PA
- Population (ZIP)
- 26,132
- Household income
- $80,709
- Rent vs Own
- Severe rent burden
- 1859.0
Population outlook (Queens County) Hauer SSP2
- Today (2025)
- 2,546,320 people
- By 2030
- 2,643,059 · +3.8%
- By 2040
- 2,815,563 · +10.6%
- By 2050
- 2,944,423 · +15.6%
- By 2075
- 3,123,338 · +22.7%
- By 2100
- 3,098,688 · +21.7%
Race, ethnicity, and origin ACS 2023
- Neighborhood character
- Highly diverse neighborhood (Simpson 0.70)
- Race & ethnicity
- White 38% Asian 28% Hispanic / Latino 27% Two or more races 16% Black 2%
- Hispanic origin (detail)
- Mexican 3% Puerto Rican 3% Dominican 2%
- Common ancestry
- Scandinavian 4% Romanian 3% Lithuanian 2%
- Foreign-born
- 46% · Canada, Jamaica, China
- Languages at home
- 38% English-only · Spanish 24% Other Indo-European 18% Other Asian/Pacific 6%
Political lean MEDSL · Queens
- 2024 margin
- Strong D (+24.6) · D 62.3% · R 37.7%
- 2008→2024 swing
- -26.2pp toward R · 2008: 50.8pp · 2024: 24.6pp
- All cycles
- 2024: D+24.6 2020: D+45.2 2016: D+53.4 2012: D+58.5 2008: D+50.8
Not yet ingested
- Civics
- —
Market trends
- HPI YoY
- ▼ -2.71%
- Current HPI
- 224.0688
- Rent YoY
- ▲ 6.31%
- Metro
- New York-Newark-Jersey City, NY-NJ-PA
- State GDP YoY
- ▲ 2.60%
- F500 in state
- 92
Industry mix (Fortune 500 HQ in NY)
| Industry | F500 HQs | Revenue |
|---|---|---|
| Financial Services | 10 | $950B |
|
||
| Consumer Goods | 9 | $162B |
|
||
| Insurance | 4 | $225B |
|
||
| Telecommunications | 2 | $144B |
|
||
| Pharmaceuticals | 2 | $112B |
|
||
| Media / Entertainment | 2 | $69B |
|
||
Price history
-14.3% since first listed6 events — show timeline
- 2026-04-21 Pending — OneKey® MLS as Distributed by MLS Grid
- 2026-02-18 Price Changed $599,000 OneKey® MLS as Distributed by MLS Grid
- 2026-01-02 Price Changed $625,000 OneKey® MLS as Distributed by MLS Grid
- 2025-07-23 Price Changed $675,000 OneKey® MLS as Distributed by MLS Grid
- 2025-07-07 Listed $699,000 OneKey® MLS as Distributed by MLS Grid
- 2025-06-25 Coming Soon $699,000 OneKey® MLS as Distributed by MLS Grid
Cash-flow waterfall
monthlySold comps — $/sqft
last 12 mo · ≤1 miLoading sold comps…