16413 Grape Way · Delray Beach, FL
Flood risk 1/10 · Minimal
- FEMA flood zone
- X (unshaded)
- Chance of flooding over 30 yrs
- 0.0%
- Est. flood insurance / yr
- $507 – $1,088
Fire risk 1/10 · Minimal
- Est. fire insurance / yr
- $947 – $1,759
Heat risk 9/10 · Severe
- Hot days now (above 106°F)
- 7 days/yr
- Hot days in 30 yrs
- 25 days/yr
Wind risk 10/10 · Severe
- Chance of severe wind over 30 yrs
- 99.0%
Air-quality risk 3/10 · Minor
- Unhealthy air days now
- 2 days/yr
- Unhealthy air days in 30 yrs
- 3 days/yr
Risk factors via First Street. Map © Google.
Why this score? — see what drove the D grade
The composite is a weighted blend of 9 inputs, each scored 0–100. Each bar is that input's sub-score; the figure is the points it added to the 100-point composite (weight × sub-score).
- Cash flow +11.2/30.0
- ARV discount +7.5/15.0
- 1% rule +4.9/10.0
- Schools +4.3/10.0
- Livability +3.9/5.0
- Rent growth +3.6/5.0
- DSCR +3.3/10.0
- Condition / age +2.5/5.0
- Appreciation +0.0/10.0
$380,000
🖨 Deal sheet 📄 Offer letter ✓ Due diligence
Listing remarks MLS
Large unit in a gated community. One bedroom and full bath downstairs and three bedrooms upstairs. Close to restaurants and shopping. Buyer to verify HOA info with HOA. Buyer pays doc stamps on deed.
Key facts
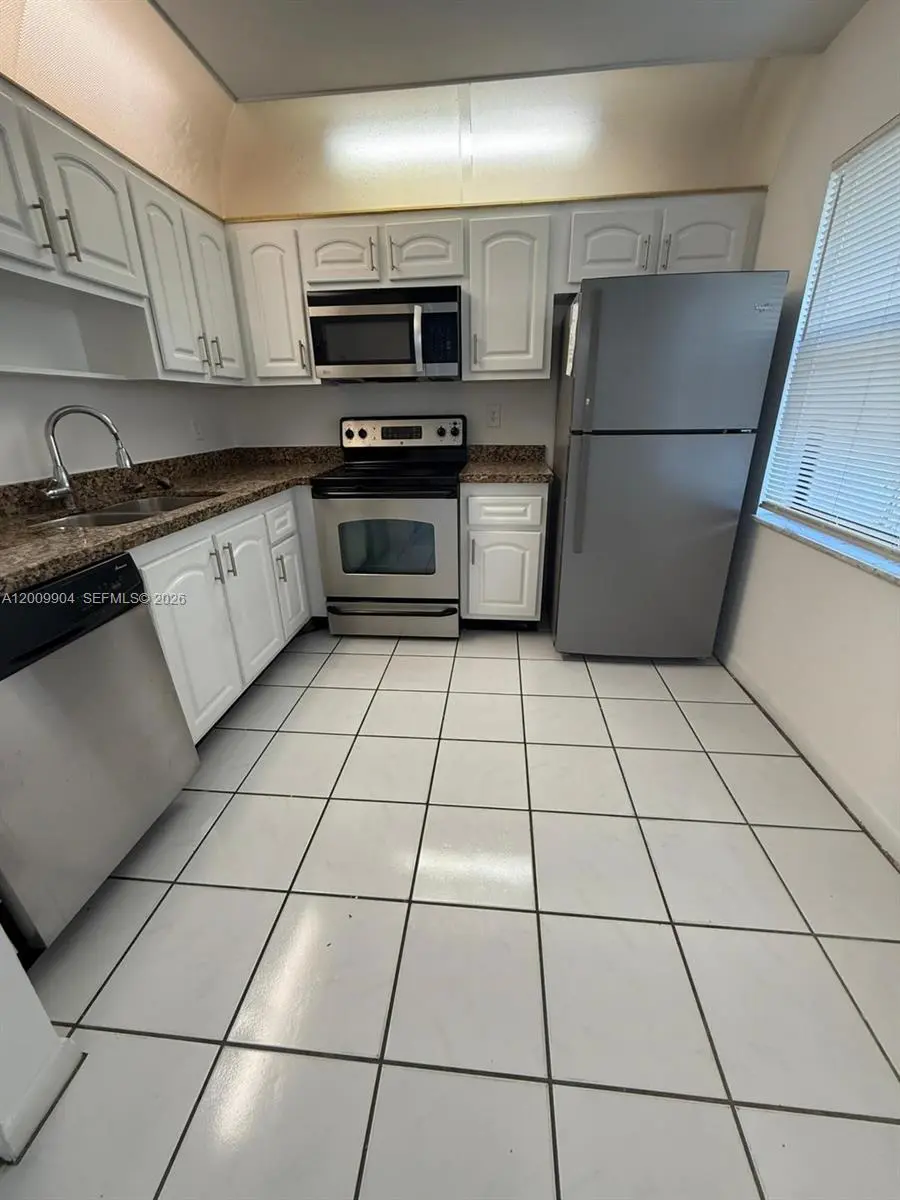
- Upgraded kitchen
- Swimming pool
- Safe gated community
Tags
Property features AI
Finance
- Financial info: Association fee: $563 monthly; Pets allowed with conditions; restrictions may apply
- HOA & community: Monthly association fee; Association fee covers amenities, common areas, cable TV, insurance, grounds maintenance, pool(s), roof, security and trash; Community amenities include basketball court, playground, pool and tennis courts
Exterior
- Parking: Two or more parking spaces
- Security: Security guard
- Utilities: Has cooling (Central Air); Has heating (Central)
- Home design: 2-story property; Property attached (attached unit); Entry level: 1
- Construction: Block construction
- Exterior features: Patio; Association-maintained pool
Interior
- Kitchen: Dishwasher; Electric range; Microwave; Refrigerator
- Flooring: Laminate flooring; Tile flooring
- Bathrooms: 2 full bathrooms; 1 half bathroom
- Heating & cooling: Central heating; Central air conditioning
- Interior features: First-floor entry; Bedroom located on the main level
- Laundry & utility: Washer
Neighborhood map
What this means for you Summary
Snapshot
- This is a 4-bed/2.5-bath townhouse listed at $380k.
Deal economics
- At list price, monthly cash flow is $-149 ($-2k/yr) — negative.
- To cash-flow at today's rent, offer at most $354k (6.9% below list).
- To meet the 1% rule (rent ≥ 1% of price), the offer needs to be $375k (1.2% below list).
- Recommended offer: $354k (6.9% below list) — sets the bar for cash-flow.
- Cap rate 5.8% vs local median 4.3% in Delray Beach — top-decile yield for the area; either an underpriced asset or a hidden risk that comps aren't pricing in. Stress-test before assuming the spread holds.
Location & tenants
- Location reads 77/100 on livability (#202 in FL, #3,160 nationally) — a middle-class / working-renter tenant base. Strengths: housing A+, health & safety A+, commute A-; Watch: cost of living C-, crime D-, amenities F.
- Palm Beach (suburban): math 46% / reading 53% proficiency, ranked #34 of 73 in FL (top 47%) — families likely to look elsewhere, expect single-tenant / working-renter base with shorter leases.
- Market conditions: Rents rising fast (+4.3%/yr); 546 active listings in the ZIP; 23 comparable units currently listed for rent nearby; rentals at typical pace (median 19d on market — plan ~3-4 weeks tenant-placement turnaround); 3,974 units permitted in Palm Beach County in 2024 (1,012 in 5+ unit buildings).
- At $3,753/mo this rent would consume 72% of the median local household income ($62k/yr) (locally 991% of renters already pay >50% of income on rent) — very limited rent-growth headroom before tenants either downsize or default.
Forward outlook
- Local home prices are declining (-3.0%/yr); year-one equity from $3k of loan paydown is wiped out by about $11k of value loss. Plan a longer hold.
- Palm Beach County population projected at +30% by 2050 — long-run rental-demand tailwind backs the buy-and-hold thesis.
Negotiation context
- It's been on market 50 days — a 3% lower offer ($369k) is reasonable based on typical stale-listing flexibility.
- 6 sale attempts since 16y ago with the ask held roughly flat each time — persistent listings suggest the price (not the market) is what's stuck; bring a comps-based counter.
- Current owner paid $210k; list at $380k implies a 81% gain — meaningful room to come down on a strong offer.
Risks & watch-outs
- Climate carrying-cost: severe wind risk, 99% chance of damaging wind over 30y; extreme-heat days projected 7→25/yr by 2055 (HVAC capex compounding) — expect insurance premiums to compound above CPI over the hold.
Questions for the listing agent
- What do current leases actually rent for vs. the listed asking? Can we see a recent rent roll and the last 12 months of T-12 income?
- It's been on market 50 days. Have you received any prior offers? Is the seller open to a 7% concession, seller financing, or rate buy-down credit?
- What does the HOA fee cover, when was the last increase, and are there any pending special assessments or reserve-fund shortfalls?
- Is there a deadline driving the sale (1031 exchange, divorce, estate, relocation)? That informs how much negotiation room exists.
- Schools are B-rated — typically a magnet for longer-tenancy family renters. What's the average tenant stay here, and is there a school-zone premium baked into asking?
- Crime grade is D in this area — have there been break-ins, vandalism, or insurance claims at this property in the last 3 years? What carrier currently insures it and at what premium?
- The area grade is low — what's the realistic commute time and amenity access for the typical tenant pool here? Any planned neighborhood developments (good or bad) we should know about?
- What's the average days-on-market for RENTAL listings here right now (not sales)? A rising rental-DOM trend means longer vacancies and softer asking-rent achievability than the comps imply.
- What's the recent tenant-quality profile in this submarket — average credit score on applications, eviction rate, late-payment / NSF rate, and stable-employment percentage? A property-management company in the area should have these aggregated.
- How much new for-sale + rental construction is in the pipeline within 1–3 miles? Heavy new supply typically softens prices + rents 12–24 months out; constrained supply supports both.
Investment metrics
- 1% rule
- 0.99% ✗
- Cap rate
- 5.82%
- Cash-on-cash
- -1.68%
- DSCR
- 0.93
- GRM
- 8.4
CMA / ARV
No comps found within radius.
Projected returns pro-forma
-3.0% appreciation · 4.28% rent growth · sell at horizon
- IRR
- -17.3%
- Equity multiple
- 0.38×
- Total profit
- $-65,840
- Equity at exit
- $56,659
- IRR
- -6.5%
- Equity multiple
- 0.55×
- Total profit
- $-47,518
- Equity at exit
- $32,855
Cash invested: $106,400 (down + closing). Projections, not guarantees.
Landlord ↔ Tenant lean methodology
- Overall (STATE)
- 87 Strongly Landlord-Friendly
- State Florida
- 87 Strongly Landlord-Friendly · R+3
- County
- — inherits STATE
- City
- — inherits STATE
ZIP-level market 33484
- Rents YoY
- 4.3%
- Active inventory
- 546
- Price-to-rent
- 8.4×
Monthly cashflow live
- Estimated rent
- $3,753 high interval (Pro) →
- Mortgage (P&I)
- −$1,993
- Tax from tax record
- −$400 /mo · $4,803/yr
- Insurance
- −$158
- HOA
- −$563
- Vacancy / Maint / Mgmt
- −$788
- Net cashflow
- $-149
Break-even live
UW: 25.0% down · 7.5% · 30yr · 1.5% tax · 5.0% vac · 8.0% maint · 8.0% mgmt
Financing live
Cash to close
- Down payment
- $95,000
- Closing costs
- $11,400
- Reserves months
- —
- Total cash needed
- —
Loan-product check · same deal, 3 products live
Conventional
25% down · 7.5% · 30yr
- Down + closing
- —
- Monthly P&I
- —
- Monthly cashflow
- —
- DSCR
- —
- Eligible?
- —
Personal DTI + credit; lowest rate.
DSCR
20% down · 8.5% · 30yr
- Down + closing
- —
- Monthly P&I
- —
- Monthly cashflow
- —
- DSCR
- —
- Eligible?
- —
No personal income docs; deal must DSCR.
Hard money
10% down · 12.0% · 12mo
- Down + closing
- —
- Monthly P&I
- —
- Monthly cashflow
- —
- DSCR
- —
- Eligible?
- —
Short-term bridge; refi at stabilization.
Rent comps 23 comps
| Address | Beds | Baths | Sqft | Rent | $/sqft | DOM | Units | Dist |
|---|---|---|---|---|---|---|---|---|
| 16415 Berry Way Delray Beach, FL | 4.0 | 2.5 | 1605 | $3,000 | $1.87 | 16d | 1 | 0.11mi |
| 5241 Jog Ln Delray Beach, FL | 3.0 | 2.5 | 1806 | $3,650 | $2.02 | 5d | 1 | 0.16mi |
| 16658 La Mesa Dr Delray Beach, FL | 3.0 | 2.0 | 1779 | $4,000 | $2.25 | 24d | 1 | 0.22mi |
| 5072 Alencia Ct Delray Beach, FL | 3.0 | 2.0 | 1638 | $4,500 | $2.75 | 24d | 1 | 0.23mi |
| 4983 Garden Dr Delray Beach, FL | 3.0 | 2.0 | 2000 | $15,000 | $7.50 | 24d | 1 | 0.31mi |
| 4801 S Citation Dr Delray Beach, FL | 1.0–3.0 | 1.0–2.0 | 1180 | $3,696 | $3.13 | 1d | 38 | 0.36mi |
| 16075 Sims Rd #203 Delray Beach, FL | 3.0 | 2.0 | 1716 | $3,900 | $2.27 | 24d | 1 | 0.46mi |
| 5241 Breadfruit Cir Delray Beach, FL | 3.0 | 2.0 | 1462 | $3,500 | $2.39 | 20d | 1 | 0.49mi |
| 5605 Forest Oaks Ter Delray Beach, FL | 3.0 | 3.0 | 2092 | $10,000 | $4.78 | 13d | 1 | 0.56mi |
| 2023 Valencia Dr Delray Beach, FL | 3.0 | 2.0 | 1711 | $3,895 | $2.28 | 14d | 1 | 0.61mi |
| 16218 Sierra Palms Dr Delray Beach, FL | 3.0 | 2.5 | 1474 | $3,250 | $2.20 | 20d | 1 | 0.67mi |
| 2200 Bloods Grove Cir Delray Beach, FL | 2.0–3.0 | 2.5 | 1611 | $4,043 | $2.51 | 5d | 5 | 0.70mi |
| 599 Burgundy M Delray Beach, FL | 3.0 | 2.0 | 1097 | $2,100 | $1.91 | 3d | 1 | 0.91mi |
| 16129 Poppyseed Cir #1603 Delray Beach, FL | 3.0 | 2.5 | 1652 | $3,350 | $2.03 | 20d | 1 | 1.09mi |
| 16129 Poppyseed Cir #1603 Delray Beach, FL | 3.0 | 2.5 | 1652 | $3,250 | $1.97 | 2d | 1 | 1.09mi |
| 16089 Poppyseed Cir #2006 Delray Beach, FL | 3.0 | 2.5 | 1652 | $3,200 | $1.94 | 24d | 1 | 1.17mi |
| 804 Foxpointe Cir Delray Beach, FL | 3.0 | 2.0 | 2027 | $8,000 | $3.95 | 24d | 1 | 1.17mi |
| 3250 Lakeview Blvd Delray Beach, FL | 3.0 | 2.0 | 2071 | $7,900 | $3.81 | 24d | 1 | 1.19mi |
| 3313 Sherwood Blvd Delray Beach, FL | 3.0 | 2.0 | 1589 | $6,000 | $3.78 | 12d | 1 | 1.20mi |
| 6077 Lake Hibiscus Dr Unit 6077 Delray Beach, FL | 3.0 | 2.0 | 1570 | $3,200 | $2.04 | 18d | 1 | 1.29mi |
| 1845 Palm Cove Blvd Unit 8-103 Delray Beach, FL | 3.0 | 2.0 | 1065 | $2,500 | $2.35 | 18d | 1 | 1.35mi |
| 1740 Palm Cove Blvd Apt 103 Delray Beach, FL | 3.0 | 2.0 | 1065 | $2,900 | $2.72 | 24d | 1 | 1.37mi |
| 167 Gramercy Square Dr Delray Beach, FL | 3.0 | 2.5 | 1758 | $3,200 | $1.82 | 5d | 1 | 1.48mi |
HOA detail
- Monthly dues
- $563 · $6,756/yr
- Likely covers
- security
Listing history 30 events
-
2026-06-18days on market $380,000 Active 50 DOM
-
2026-06-17days on market $380,000 Active 49 DOM
-
2026-06-16days on market $380,000 Active 48 DOM
-
2026-06-15days on market $380,000 Active 47 DOM
-
2026-06-13days on market $380,000 Active 45 DOM
-
2026-06-09days on market $380,000 Active 41 DOM
-
2026-06-08days on market $380,000 Active 40 DOM
-
2026-06-07days on market $380,000 Active 39 DOM
-
2026-06-04days on market $380,000 Active 36 DOM
-
2026-06-03pricedays on market $380,000 Active 35 DOM
-
2026-06-02days on market $385,000 Active 34 DOM
-
2026-06-01days on market $385,000 Active 33 DOM
-
2026-05-31days on market $385,000 Active 32 DOM
-
2026-04-29$385,000 Active
-
2025-06-19historical $2,900
-
2025-04-23price $2,900
-
2025-02-11$3,000
-
2023-12-28historical $2,950
-
2023-12-09$2,950
-
2023-12-03historical $2,950
-
2023-11-16$2,950
-
2023-11-16historical $2,950
-
2023-09-02$2,950
-
2016-08-11soldstatus $210,000
-
2016-06-21soldstatus $164,130
-
2011-10-06soldstatus $95,150
-
2011-09-27soldstatus $95,150 199-char remark
Show marketing remark (199 chars)
Large unit in a gated community. One bedroom and full bath downstairs and three bedrooms upstairs. Close to restaurants and shopping. Buyer to verify HOA info with HOA. Buyer pays doc stamps on deed.
-
2011-08-20historical 199-char remark
Show marketing remark (199 chars)
Large unit in a gated community. One bedroom and full bath downstairs and three bedrooms upstairs. Close to restaurants and shopping. Buyer to verify HOA info with HOA. Buyer pays doc stamps on deed.
-
2010-10-13$103,000 199-char remark
Show marketing remark (199 chars)
Large unit in a gated community. One bedroom and full bath downstairs and three bedrooms upstairs. Close to restaurants and shopping. Buyer to verify HOA info with HOA. Buyer pays doc stamps on deed.
-
2002-06-14soldstatus $125,000
ⓘ Source: listings_history table (triggers on properties + properties_extension) + one-shot
backfill from property_details.listing_events for pre-trigger history.
Tax reassessment forecast FL · Resets to sale price
- Current annual tax
- $4,803 · $400/mo
- Projected year-2 tax
- $4,803 · $400/mo
- Expected delta
- $0/yr ($0/mo · 0.0%)
ⓘ Screening estimate from a state-policy table — verify with the county assessor before closing.
Climate risk First Street
- Flood 1/10 Low FEMA zone X (unshaded) · 0% chance over 30 yrs
- Wildfire 1/10 Low
- Heat 9/10 Extreme 7 d/yr ≥106°F today · 25 d/yr by 30 yrs out
- Wind 10/10 Extreme 99% chance of damaging wind over 30 yrs
- Air quality 3/10 Moderate 2 unhealthy d/yr today · 3 by 30 yrs out
Nearby sold comps map
Loading sold comps map…
Walkable amenities ~0.75 mi
Loading nearby amenities…
Taxation est. · year 1
- Rental income
- $45,037
- − Mortgage interest
- −$21,286
- − Property taxes
- −$4,803
- − Insurance
- −$1,900
- − Repairs & maintenance
- −$3,603
- − Management
- −$3,603
- − HOA
- −$6,756
- − Depreciation
- −$11,055
- Taxable loss
- −$7,968
- Est. tax savings @ 24.0%
- +$1,912
- After-tax cash flow
- $120/yr
For passive investors: Depreciation is non-cash, so a rental often shows a tax loss while cash-flowing — sheltering income. Rental losses are passive: they offset passive income freely, and up to $25,000/yr can offset ordinary (W-2) income if you actively participate and your MAGI is under $100k (phasing out to $0 by $150k); unused losses carry forward. On sale, claimed depreciation is recaptured at up to 25%, and gains may owe capital-gains tax (a 1031 exchange can defer both). Figures are a year-1 estimate at your 24.0% rate — not tax advice; consult a CPA.
Schools (NCES district)
- District
- Palm Beach
- NCES district ID
- 1201500
- Math proficiency
- 46% ▼ -16.00%
- Reading proficiency
- 53% ▼ -4.00%
- Median HH income
- $53,943
- Composite
- 42.72/100
- National rank
- #3160
- State rank
- #34 of 73 in FL
Livability — Delray Beach
- Score
- 77/100
- State rank
- #202
- US rank
- #3160
Category grades
Schools grade is shown separately in the Schools card above.
Census & demographics
- County
- Palm Beach County · 1,438,312 people
- City population
- 123,167
- Metro
- Miami-Fort Lauderdale-Pompano Beach, FL
- Population (ZIP)
- 26,208
- Household income
- $62,151
- Rent vs Own
- Severe rent burden
- 991.0
Population outlook (Palm Beach County) Hauer SSP2
- Today (2025)
- 1,637,487 people
- By 2030
- 1,743,255 · +6.5%
- By 2040
- 1,948,712 · +19.0%
- By 2050
- 2,132,979 · +30.3%
- By 2075
- 2,530,027 · +54.5%
- By 2100
- 2,706,979 · +65.3%
Race, ethnicity, and origin ACS 2023
- Neighborhood character
- Predominantly White (74%)
- Race & ethnicity
- White 74% Hispanic / Latino 14% Two or more races 10% Black 5% Asian 2%
- Hispanic origin (detail)
- Puerto Rican 2% Cuban 2%
- Common ancestry
- Scotch-Irish 7% Romanian 6% Italian 2%
- Foreign-born
- 23% · Canada, Jamaica, China
- Languages at home
- 76% English-only · Spanish 13% Russian/Polish/Slavic 3% French/Haitian/Cajun 3%
Political lean MEDSL · Palm Beach
- 2024 margin
- Toss-up / Even · D 50.0% · R 49.2%
- 2008→2024 swing
- -22.1pp toward R · 2008: 22.9pp · 2024: 0.8pp
- All cycles
- 2024: D+0.8 2020: D+12.8 2016: D+15.3 2012: D+17.0 2008: D+22.9
Not yet ingested
- Civics
- —
Market trends
- HPI YoY
- ▼ -232.73%
- Current HPI
- 254.5016
- Rent YoY
- ▲ 4.28%
- Metro
- Miami-Fort Lauderdale-Pompano Beach, FL
- State GDP YoY
- ▲ 3.28%
- F500 in state
- 36
Industry mix (Fortune 500 HQ in FL)
| Industry | F500 HQs | Revenue |
|---|---|---|
| Industrial Technology | 2 | $29B |
|
||
| Insurance | 2 | $17B |
|
||
| Retail | 1 | $60B |
|
||
| Technology Distribution | 1 | $58B |
|
||
| Homebuilding | 1 | $35B |
|
||
| Technology Manufacturing | 1 | $35B |
|
||
Price history
+208.0% since first listed17 events — show timeline
- 2026-04-29 Listed $385,000 MARMLS
- 2025-06-19 Rental Removed $2,900 BUILDIUM
- 2025-04-23 Price Changed $2,900 BUILDIUM
- 2025-02-11 Listed for Rent $3,000 BUILDIUM
- 2023-12-28 Rental Removed $2,950 MARMLS
- 2023-12-09 Listed for Rent $2,950 MARMLS
- 2023-12-03 Rental Removed $2,950 MARMLS
- 2023-11-16 Listed for Rent $2,950 MARMLS
- 2023-11-16 Rental Removed $2,950 BUILDIUM
- 2023-09-02 Listed for Rent $2,950 BUILDIUM
- 2016-08-11 Sold (Public Records) $210,000 Public Records
- 2016-06-21 Sold (Public Records) $164,130 Public Records
- 2011-10-06 Sold (Public Records) $95,150 Public Records
- 2011-09-27 Sold (MLS) $95,150 Beaches MLS
- 2011-08-20 Listing Removed — Beaches MLS
- 2010-10-13 Listed $103,000 Beaches MLS
- 2002-06-14 Sold (Public Records) $125,000 Public Records
Property tax history
+10.1%/yrLatest (2025): $4,803 · +9.0% YoY. Source: county tax records.
Cash-flow waterfall
monthlySold comps — $/sqft
last 12 mo · ≤1 miLoading sold comps…