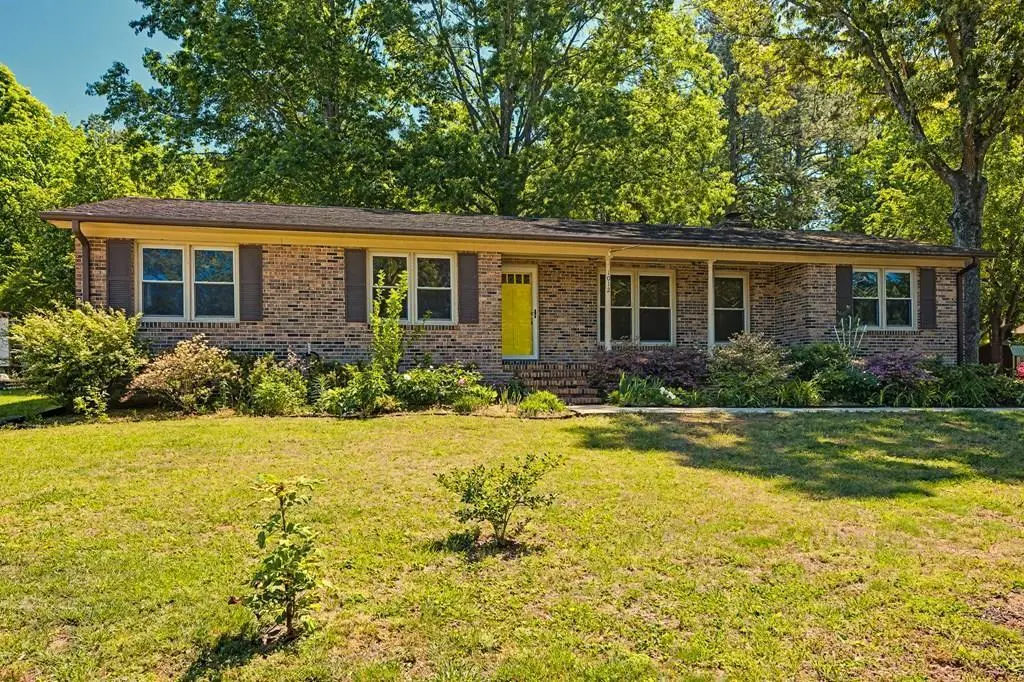
1012 Donna Ct · South Boston, VA
Flood risk 1/10 · Minimal
- FEMA flood zone
- X (unshaded)
- Chance of flooding over 30 yrs
- 0.0%
- Est. flood insurance / yr
- $507 – $1,088
Fire risk 3/10 · Minor
- Est. fire insurance / yr
- $666 – $1,236
Heat risk 6/10 · Moderate
- Hot days now (above 104°F)
- 7 days/yr
- Hot days in 30 yrs
- 17 days/yr
Wind risk 4/10 · Minor
- Chance of severe wind over 30 yrs
- 13.0%
Air-quality risk 2/10 · Minimal
- Unhealthy air days now
- 1 days/yr
- Unhealthy air days in 30 yrs
- 1 days/yr
Risk factors via First Street. Map © Google.
Why this score? — see what drove the D grade
The composite is a weighted blend of 9 inputs, each scored 0–100. Each bar is that input's sub-score; the figure is the points it added to the 100-point composite (weight × sub-score).
- ARV discount +15.0/15.0
- Cash flow +9.3/30.0
- Livability +3.7/5.0
- Schools +3.6/10.0
- DSCR +2.6/10.0
- Rent growth +2.5/5.0
- Condition / age +2.5/5.0
- 1% rule +1.6/10.0
- Appreciation +0.0/10.0
$224,000
🖨 Deal sheet 📄 Offer letter ✓ Due diligence
Listing remarks
Discover easy living in this inviting brick rancher nestled in the Fordland Estates subdivision of Halifax County. Featuring 3 bedrooms and 2.5 baths, this home offers a functional, single-level layout designed for both comfort and convenience. The welcoming family room is anchored by a gas log fireplace, creating the perfect spot to unwind or gather with guests. Enjoy outdoor living in the fenced backyard—ideal for pets, gardening, or weekend cookouts. Located just minutes from town, you'll appreciate quick access to shopping and dining while still enjoying a quiet neighborhood setting. This is a great opportunity to own a well-located home with space, charm, and everyday practicali
Key facts
- Gas log fireplace
- Fenced backyard
- 0.34 acre lot
Tags
Property features AI
Exterior
- Security: Smoke detectors
- Utilities: Private well water; Public sewer; Cable available and connected
- Home design: Single family residence; Residential property; Has a view
- Construction: Brick construction
- Exterior features: Covered patio and porch
Interior
- Kitchen: Electric range; Refrigerator
- Flooring: Vinyl flooring; Carpet
- Bathrooms: 2 full bathrooms; 1 half bathroom
- Heating & cooling: Heat pump; Baseboard heating; Ceiling fans for cooling
- Interior features: Ceiling fans; High-speed internet; Gas fireplace in the family room
- Laundry & utility: Washer and dryer hookups; Electric dryer hookup; Laundry room; Electric water heater
Neighborhood map
What this means for you Summary
Snapshot
- This is a 3-bed/2.5-bath single-family listed at $224k.
Deal economics
- At list price, monthly cash flow is $-165 ($-2k/yr) — negative.
- To cash-flow at today's rent, offer at most $195k (13.0% below list).
- To meet the 1% rule (rent ≥ 1% of price), the offer needs to be $148k (34.0% below list).
- Recommended offer: $148k (34.0% below list) — sets the bar for 1% rule.
Location & tenants
- Location reads 74/100 on livability (#147 in VA, #4,742 nationally) — a middle-class / working-renter tenant base. Strengths: cost of living A+, housing A+, health & safety A+; Watch: crime F, amenities F, commute F.
- Halifax County Public School District (town): math 29% / reading 59% proficiency, ranked #116 of 131 in VA (top 88%) — families likely to look elsewhere, expect single-tenant / working-renter base with shorter leases.
- Market conditions: 38 active listings in the ZIP; 97 units permitted in Halifax County in 2024 (0 in 5+ unit buildings).
Forward outlook
- Local home prices are declining (-3.0%/yr); year-one equity from $2k of loan paydown is wiped out by about $7k of value loss. Plan a longer hold.
- Halifax County population projected at -22% by 2050 — secular population decline; favor cash flow + early exit over multi-decade hold.
Negotiation context
- It's been on market 37 days — a 3% lower offer ($217k) is reasonable based on typical stale-listing flexibility.
- Current owner paid $107k; list at $224k implies a 109% gain — meaningful room to come down on a strong offer.
Risks & watch-outs
- Climate carrying-cost: extreme-heat days projected 7→17/yr by 2055 (HVAC capex compounding) — expect insurance premiums to compound above CPI over the hold.
Questions for the listing agent
- What do current leases actually rent for vs. the listed asking? Can we see a recent rent roll and the last 12 months of T-12 income?
- It's been on market 37 days. Have you received any prior offers? Is the seller open to a 34% concession, seller financing, or rate buy-down credit?
- Built in 1974 — when were the roof, HVAC, electrical panel, plumbing, and water heater last replaced?
- Is there a deadline driving the sale (1031 exchange, divorce, estate, relocation)? That informs how much negotiation room exists.
- Schools are B-rated — typically a magnet for longer-tenancy family renters. What's the average tenant stay here, and is there a school-zone premium baked into asking?
- Crime grade is F in this area — have there been break-ins, vandalism, or insurance claims at this property in the last 3 years? What carrier currently insures it and at what premium?
- The area grade is low — what's the realistic commute time and amenity access for the typical tenant pool here? Any planned neighborhood developments (good or bad) we should know about?
- What's the average days-on-market for RENTAL listings here right now (not sales)? A rising rental-DOM trend means longer vacancies and softer asking-rent achievability than the comps imply.
- What's the recent tenant-quality profile in this submarket — average credit score on applications, eviction rate, late-payment / NSF rate, and stable-employment percentage? A property-management company in the area should have these aggregated.
- How much new for-sale + rental construction is in the pipeline within 1–3 miles? Heavy new supply typically softens prices + rents 12–24 months out; constrained supply supports both.
Investment metrics
- 1% rule
- 0.66% ✗
- Cap rate
- 5.41%
- Cash-on-cash
- -3.16%
- DSCR
- 0.86
- GRM
- 12.6
CMA / ARV
- ARV (median comp)
- $277,608
- List price
- $224,000
- Delta
- -19.31%
- Verdict
- UNDERPRICED
- Comps
- 20 within 1.0 mi
Show comp detail 4 sales within ~0.75 mi
| Address | Dist | Beds/Ba | Sqft | Sold | Price | $/sf | Match |
|---|---|---|---|---|---|---|---|
| 1182 Dan River Church Rd | 0.19mi | 3/2.0 | 1,632 (-5%) | 6mo | $302,500 | $185 | 77 |
| 116 Woods Ct | 0.36mi | 3/2.0 | 1,680 (-2%) | 6mo | $440,000 | $262 | 73 |
| 2031 Dan River Church Rd | 0.38mi | 3/2.0 | 1,731 (+1%) | 11mo | $205,000 | $118 | 69 |
| 1074 Bellevue Rd | 0.27mi | 3/2.0 | 1,500 (-12%) | 14mo | $360,000 | $240 | 54 |
Match score weights: distance 35% · size 25% · config 20% · recency 20%. Top-matched comps best support the ARV.
Projected returns pro-forma
-3.0% appreciation · 3.0% rent growth · sell at horizon
- IRR
- -21.7%
- Equity multiple
- 0.25×
- Total profit
- $-46,940
- Equity at exit
- $33,399
- IRR
- -15.5%
- Equity multiple
- 0.12×
- Total profit
- $-54,884
- Equity at exit
- $19,367
Cash invested: $62,720 (down + closing). Projections, not guarantees.
Landlord ↔ Tenant lean methodology
- Overall (STATE)
- 55 Moderately Landlord-Leaning
- State Virginia
- 55 Moderately Landlord-Leaning · D+2
- County
- — inherits STATE
- City
- — inherits STATE
ZIP-level market 24558
- Home prices YoY
- -7.3%
- Active inventory
- 38
- Price-to-rent
- 12.6×
Monthly cashflow live
- Estimated rent
- $1,478 medium interval (Pro) →
- Mortgage (P&I)
- −$1,175
- Tax from tax record
- −$65 /mo · $780/yr
- Insurance
- −$93
- HOA
- −$0
- Vacancy / Maint / Mgmt
- −$310
- Net cashflow
- $-165
Break-even live
UW: 25.0% down · 7.5% · 30yr · 1.5% tax · 5.0% vac · 8.0% maint · 8.0% mgmt
Financing live
Cash to close
- Down payment
- $56,000
- Closing costs
- $6,720
- Reserves months
- —
- Total cash needed
- —
Loan-product check · same deal, 3 products live
Conventional
25% down · 7.5% · 30yr
- Down + closing
- —
- Monthly P&I
- —
- Monthly cashflow
- —
- DSCR
- —
- Eligible?
- —
Personal DTI + credit; lowest rate.
DSCR
20% down · 8.5% · 30yr
- Down + closing
- —
- Monthly P&I
- —
- Monthly cashflow
- —
- DSCR
- —
- Eligible?
- —
No personal income docs; deal must DSCR.
Hard money
10% down · 12.0% · 12mo
- Down + closing
- —
- Monthly P&I
- —
- Monthly cashflow
- —
- DSCR
- —
- Eligible?
- —
Short-term bridge; refi at stabilization.
Listing history 12 events
-
2026-06-13days on market $224,000 Active 37 DOM
-
2026-06-12days on market $224,000 Active 36 DOM
-
2026-06-09days on market $224,000 Active 33 DOM
-
2026-06-08days on market $224,000 Active 32 DOM
-
2026-06-08days on market $224,000 Active 31 DOM
-
2026-06-07days on market $224,000 Active 30 DOM
-
2026-06-03days on market $224,000 Active 27 DOM
-
2026-06-02days on market $224,000 Active 26 DOM
-
2026-06-01days on market $224,000 Active 25 DOM
-
2026-05-31days on market $224,000 Active 24 DOM
-
2026-05-07$224,000 Active 905-char remark
-
2006-08-30soldstatus $107,000
ⓘ Source: listings_history table (triggers on properties + properties_extension) + one-shot
backfill from property_details.listing_events for pre-trigger history.
Tax reassessment forecast VA · Resets to sale price
- Current annual tax
- $780 · $65/mo
- Projected year-2 tax
- $1,837 · $153/mo
- Expected delta
- +$1,057/yr (+$88/mo · 135.6%)
ⓘ Screening estimate from a state-policy table — verify with the county assessor before closing.
Climate risk First Street
- Flood 1/10 Low FEMA zone X (unshaded) · 0% chance over 30 yrs
- Wildfire 3/10 Moderate
- Heat 6/10 Major 7 d/yr ≥104°F today · 17 d/yr by 30 yrs out
- Wind 4/10 Moderate 13% chance of damaging wind over 30 yrs
- Air quality 2/10 Low 1 unhealthy d/yr today · 1 by 30 yrs out
Nearby sold comps map
Loading sold comps map…
Walkable amenities ~0.75 mi
Loading nearby amenities…
Taxation est. · year 1
- Rental income
- $17,736
- − Mortgage interest
- −$12,547
- − Property taxes
- −$780
- − Insurance
- −$1,120
- − Repairs & maintenance
- −$1,419
- − Management
- −$1,419
- − Depreciation
- −$6,516
- Taxable loss
- −$6,065
- Est. tax savings @ 24.0%
- +$1,456
- After-tax cash flow
- $-529/yr
For passive investors: Depreciation is non-cash, so a rental often shows a tax loss while cash-flowing — sheltering income. Rental losses are passive: they offset passive income freely, and up to $25,000/yr can offset ordinary (W-2) income if you actively participate and your MAGI is under $100k (phasing out to $0 by $150k); unused losses carry forward. On sale, claimed depreciation is recaptured at up to 25%, and gains may owe capital-gains tax (a 1031 exchange can defer both). Figures are a year-1 estimate at your 24.0% rate — not tax advice; consult a CPA.
Schools (NCES district)
- District
- Halifax County Public School District
- NCES district ID
- 5101770
- Math proficiency
- 29% ▼ -51.00%
- Reading proficiency
- 59% ▼ -15.00%
- Median HH income
- $36,137
- Composite
- 36.36/100
- National rank
- #4687
- State rank
- #116 of 131 in VA
Livability — South Boston
- Score
- 74/100
- State rank
- #147
- US rank
- #4742
Category grades
Schools grade is shown separately in the Schools card above.
Census & demographics
- Population (ZIP)
- 6,044
Population outlook (Halifax County) Hauer SSP2
- Today (2025)
- 32,892 people
- By 2030
- 31,438 · -4.4%
- By 2040
- 28,350 · -13.8%
- By 2050
- 25,553 · -22.3%
- By 2075
- 20,217 · -38.5%
- By 2100
- 14,645 · -55.5%
Race, ethnicity, and origin ACS 2023
- Neighborhood character
- Majority White (61%)
- Race & ethnicity
- White 61% Black 33% Two or more races 3% Hispanic / Latino 2%
- Common ancestry
- Italian 2% Slovak 1%
- Foreign-born
- 2% · Canada
- Languages at home
- 96% English-only · Spanish 3% Arabic 1%
Political lean MEDSL · Halifax
- 2024 margin
- Strong R (+21.1) · D 39.1% · R 60.2%
- 2008→2024 swing
- -18.2pp toward R · 2008: -2.8pp · 2024: -21.1pp
- All cycles
- 2024: R+21.1 2020: R+15.1 2016: R+16.6 2012: R+5.6 2008: R+2.8
Not yet ingested
- Civics
- —
Market trends
- HPI YoY
- ▼ -15.54%
- Current HPI
- 198.1694
- Rent YoY
- —
- Metro
- —
- State GDP YoY
- ▲ 2.40%
- F500 in state
- 50
Industry mix (Fortune 500 HQ in VA)
| Industry | F500 HQs | Revenue |
|---|---|---|
| Aerospace / Defense | 4 | $236B |
|
||
| Technology / Defense | 3 | $32B |
|
||
| Financial Services | 2 | $176B |
|
||
| Utilities | 2 | $27B |
|
||
| Insurance | 2 | $25B |
|
||
| Technology | 2 | $15B |
|
||
Price history
+109.3% since first listed2 events — show timeline
- 2026-05-07 Listed $224,000 SPLLAR
- 2006-08-30 Sold (Public Records) $107,000 Public Records
Property tax history
+3.4%/yrLatest (2025): $780 · +0.0% YoY. Source: county tax records.
Cash-flow waterfall
monthlySold comps — $/sqft
last 12 mo · ≤1 miLoading sold comps…