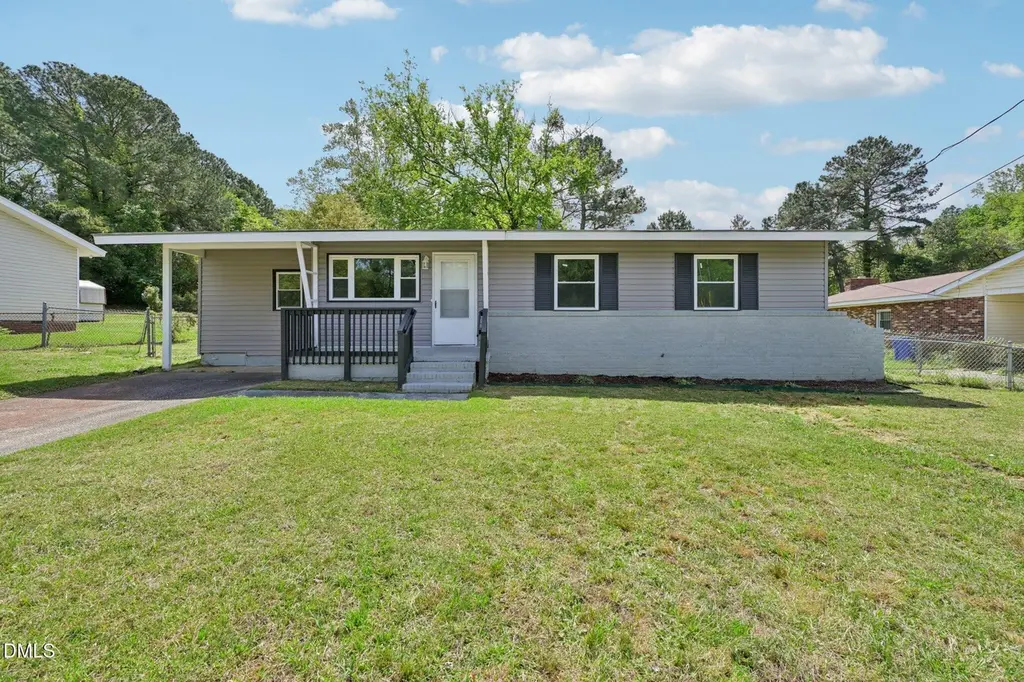
2809 Coronada Pkwy · Fayetteville, NC
Flood risk 4/10 · Minor
- FEMA flood zone
- X (unshaded)
- Chance of flooding over 30 yrs
- 0.22%
- Est. flood insurance / yr
- $473 – $860
Fire risk 4/10 · Minor
- Est. fire insurance / yr
- $906 – $1,684
Heat risk 7/10 · Major
- Hot days now (above 106°F)
- 7 days/yr
- Hot days in 30 yrs
- 16 days/yr
Wind risk 7/10 · Major
- Chance of severe wind over 30 yrs
- 78.0%
Air-quality risk 1/10 · Minimal
- Unhealthy air days now
- 0 days/yr
- Unhealthy air days in 30 yrs
- 0 days/yr
Risk factors via First Street. Map © Google.
Why this score? — see what drove the D- grade
The composite is a weighted blend of 9 inputs, each scored 0–100. Each bar is that input's sub-score; the figure is the points it added to the 100-point composite (weight × sub-score).
- Appreciation +10.0/10.0
- Cash flow +9.2/30.0
- Livability +3.8/5.0
- Schools +3.1/10.0
- DSCR +2.6/10.0
- Rent growth +2.5/5.0
- Condition / age +2.5/5.0
- 1% rule +2.2/10.0
- ARV discount +0.0/15.0
$185,000
🖨 Deal sheet 📄 Offer letter ✓ Due diligence
Listing remarks
This beautifully updated ranch-style home offers the perfect blend of comfort and modern convenience. Featuring 4 spacious bedrooms and 2 full bathrooms, the layout is designed for easy living. The open kitchen and dining area create a welcoming space for gatherings, complete with sleek granite countertops and stainless steel appliances. A dedicated laundry room adds everyday practicality. Enjoy relaxing mornings on the covered front porch or unwind in the private, fenced-in backyard with a rear patio--ideal for entertaining or quiet evenings outdoors. Situated on a generous 0.32-acre lot, this home provides plenty of space both inside and out. * The preferred lender is willing to give back
Key facts
- Covered front porch
- Granite countertops
- 0.32 acre lot
Tags
Property features AI
Finance
- Other: Lot size approximately 0.32 acres; Publicly maintained road access; County: Cumberland
- HOA & community: No homeowners association; Not a senior community
Exterior
- Parking: 2 open parking spaces
- Utilities: Public water; Public sewer
- Home design: Single-story house; Facing direction not specified; Entry level not specified
- Construction: House construction; Built with brick and vinyl siding
- Exterior features: Shingle roof; Brick and vinyl siding
Interior
- Bedrooms: 4 bedrooms (all on the main level)
- Flooring: Carpet; Laminate
- Bathrooms: 2 full bathrooms
- Heating & cooling: Forced air heating; Central air conditioning
- Interior features: Crawl space basement; Carpet and laminate flooring
Neighborhood map
What this means for you Summary
Snapshot
- This is a 3-bed/1.0-bath single-family listed at $185k.
Deal economics
- At list price, monthly cash flow is $-139 ($-2k/yr) — negative.
- To cash-flow at today's rent, offer at most $160k (13.3% below list).
- To meet the 1% rule (rent ≥ 1% of price), the offer needs to be $134k (27.5% below list).
- Recommended offer: $134k (27.5% below list) — sets the bar for 1% rule.
Location & tenants
- Location reads 75/100 on livability (#45 in NC, #4,031 nationally) — a middle-class / working-renter tenant base. Strengths: commute A+, cost of living A+, housing A+; Watch: crime F, employment D-.
- Cumberland County Schools (urban): math 32% / reading 41% proficiency, ranked #126 of 178 in NC (top 71%) — families likely to look elsewhere, expect single-tenant / working-renter base with shorter leases.
- Zoned schools: Douglas Byrd Middle (math 13% / reading 30%, grade F, #422 of 475 statewide, top 89%, 935 students, 100% FRL); Douglas Byrd High (math 22% / reading 42%, grade F, #445 of 535 statewide, top 84%, 940 students, 99% FRL) — zoned schools average 99% FRL vs 55% district-wide (45 pts higher); higher-poverty schools than district average — tighter screening recommended.
- Market conditions: 222 active listings in the ZIP; 11 comparable units currently listed for rent nearby; rentals at typical pace (median 24d on market — plan ~3-4 weeks tenant-placement turnaround); 1,125 units permitted in Cumberland County in 2024 (104 in 5+ unit buildings).
Forward outlook
- In year one you build about $20k of equity ($1k loan paydown + $18k appreciation (10.0% local appreciation)).
- By year 2, paydown + projected appreciation supports a ~$32k cash-out refi (75% LTV) — recoverable capital for the next deal without selling this one.
Negotiation context
- It's been on market 38 days — a 3% lower offer ($179k) is reasonable based on typical stale-listing flexibility.
- 6 sale attempts since 2y ago with the ask held roughly flat each time — persistent listings suggest the price (not the market) is what's stuck; bring a comps-based counter.
- Current owner paid $115k; list at $185k implies a 61% gain — meaningful room to come down on a strong offer.
Risks & watch-outs
- Climate carrying-cost: major wind risk, 78% chance of damaging wind over 30y; extreme-heat days projected 7→16/yr by 2055 (HVAC capex compounding) — expect insurance premiums to compound above CPI over the hold.
Questions for the listing agent
- What do current leases actually rent for vs. the listed asking? Can we see a recent rent roll and the last 12 months of T-12 income?
- It's been on market 38 days. Have you received any prior offers? Is the seller open to a 28% concession, seller financing, or rate buy-down credit?
- Built in 1963 — when were the roof, HVAC, electrical panel, plumbing, and water heater last replaced?
- Is there a deadline driving the sale (1031 exchange, divorce, estate, relocation)? That informs how much negotiation room exists.
- Crime grade is F in this area — have there been break-ins, vandalism, or insurance claims at this property in the last 3 years? What carrier currently insures it and at what premium?
- The area grade is low — what's the realistic commute time and amenity access for the typical tenant pool here? Any planned neighborhood developments (good or bad) we should know about?
- What's the average days-on-market for RENTAL listings here right now (not sales)? A rising rental-DOM trend means longer vacancies and softer asking-rent achievability than the comps imply.
- What's the recent tenant-quality profile in this submarket — average credit score on applications, eviction rate, late-payment / NSF rate, and stable-employment percentage? A property-management company in the area should have these aggregated.
- How much new for-sale + rental construction is in the pipeline within 1–3 miles? Heavy new supply typically softens prices + rents 12–24 months out; constrained supply supports both.
Investment metrics
- 1% rule
- 0.72% ✗
- Cap rate
- 5.39%
- Cash-on-cash
- -3.22%
- DSCR
- 0.86
- GRM
- 11.5
CMA / ARV
- ARV (on-the-fly)
- $155,952
- Comps found
- 4
Show comp detail 4 sales within ~0.75 mi
| Address | Dist | Beds/Ba | Sqft | Sold | Price | $/sf | Match |
|---|---|---|---|---|---|---|---|
| 3205 Bolton St | 0.70mi | 3/1.0 | 960 (+5%) | 10mo | $133,000 | $139 | 51 |
| 718 W Mountain Dr | 0.69mi | 3/1.0 | 874 (-4%) | 14mo | $110,000 | $126 | 50 |
| 2111 Dillon Dr | 0.49mi | 3/1.0 | 1,025 (+12%) | 14mo | $175,000 | $171 | 45 |
| 3301 Madison Ave | 0.75mi | 3/1.5 | 995 (+9%) | 22mo | $180,000 | $181 | 30 |
Match score weights: distance 35% · size 25% · config 20% · recency 20%. Top-matched comps best support the ARV.
Projected returns pro-forma
10.0% appreciation · 3.0% rent growth · sell at horizon
- IRR
- 22.0%
- Equity multiple
- 2.77×
- Total profit
- $91,879
- Equity at exit
- $166,663
- IRR
- 19.8%
- Equity multiple
- 6.36×
- Total profit
- $277,467
- Equity at exit
- $359,414
Cash invested: $51,800 (down + closing). Projections, not guarantees.
Landlord ↔ Tenant lean methodology
- Overall (STATE)
- 85 Strongly Landlord-Friendly
- State North Carolina
- 85 Strongly Landlord-Friendly · R+3
- County
- — inherits STATE
- City
- — inherits STATE
ZIP-level market 28312
- Home prices YoY
- 6.9%
- Active inventory
- 222
- Price-to-rent
- 11.5×
Monthly cashflow live
- Estimated rent
- $1,341 high interval (Pro) →
- Mortgage (P&I)
- −$970
- Tax from tax record
- −$151 /mo · $1,808/yr
- Insurance
- −$77
- HOA
- −$0
- Vacancy / Maint / Mgmt
- −$282
- Net cashflow
- $-139
Break-even live
UW: 25.0% down · 7.5% · 30yr · 1.5% tax · 5.0% vac · 8.0% maint · 8.0% mgmt
Financing live
Cash to close
- Down payment
- $46,250
- Closing costs
- $5,550
- Reserves months
- —
- Total cash needed
- —
Loan-product check · same deal, 3 products live
Conventional
25% down · 7.5% · 30yr
- Down + closing
- —
- Monthly P&I
- —
- Monthly cashflow
- —
- DSCR
- —
- Eligible?
- —
Personal DTI + credit; lowest rate.
DSCR
20% down · 8.5% · 30yr
- Down + closing
- —
- Monthly P&I
- —
- Monthly cashflow
- —
- DSCR
- —
- Eligible?
- —
No personal income docs; deal must DSCR.
Hard money
10% down · 12.0% · 12mo
- Down + closing
- —
- Monthly P&I
- —
- Monthly cashflow
- —
- DSCR
- —
- Eligible?
- —
Short-term bridge; refi at stabilization.
Rent comps 11 comps
| Address | Beds | Baths | Sqft | Rent | $/sqft | DOM | Units | Dist |
|---|---|---|---|---|---|---|---|---|
| 29 Briar Cir Fayetteville, NC | 1.0–2.0 | 1.0–1.5 | 765 | $1,283 | $1.68 | 14d | 36 | 0.41mi |
| 2123 Burnett Ave Fayetteville, NC | 3.0 | 2.0 | 1100 | $1,600 | $1.45 | 23d | 1 | 0.82mi |
| 1347 Levy Dr Fayetteville, NC | 3.0 | 1.0 | 999 | $1,000 | $1.00 | 23d | 1 | 0.99mi |
| 1805 Wayne Ln Fayetteville, NC | 3.0 | 1.0 | 975 | $2,400 | $2.46 | 23d | 1 | 1.19mi |
| 3918 Donna St Fayetteville, NC | 3.0 | 1.0 | 1000 | $1,350 | $1.35 | 23d | 1 | 1.19mi |
| 3526 Furman Dr Fayetteville, NC | 3.0 | 1.5 | 1050 | $1,500 | $1.43 | 23d | 1 | 1.23mi |
| 1100 Marlborough Rd Fayetteville, NC | 2.0 | 2.0 | 1025 | $1,198 | $1.17 | 21d | 5 | 1.30mi |
| 1100 Marlborough Rd Fayetteville, NC | 2.0 | 2.0 | 1025 | $1,198 | $1.17 | 14d | 5 | 1.30mi |
| 1031 Ancestry Dr Fayetteville, NC | 2.0 | 2.0 | 950 | $935 | $0.98 | 23d | 1 | 1.44mi |
| 1005 Ancestry Dr #2 Fayetteville, NC | 2.0 | 2.0 | 950 | $995 | $1.05 | 14d | 1 | 1.47mi |
| 479 McBain Dr Fayetteville, NC | 2.0 | 1.0 | 858 | $1,200 | $1.40 | 23d | 1 | 1.49mi |
Listing history 18 events
-
2026-05-18status Pending
-
2026-05-02price $185,000
-
2026-04-10$190,000 Active
-
2026-02-02historical
-
2025-09-03$214,500 Active
-
2025-08-25historical
-
2025-06-04$214,990 Active
-
2025-05-29historical
-
2025-05-19price $217,499
-
2025-03-19price $217,500
-
2025-02-17$220,000 Active
-
2024-12-31historical
-
2024-12-05price $220,000
-
2024-10-25$225,000 Active
-
2024-06-14soldstatus $115,000 Sold
-
2024-06-14soldstatus $115,000
-
2024-05-21status Pending
-
2024-05-09$130,000 Active
ⓘ Source: listings_history table (triggers on properties + properties_extension) + one-shot
backfill from property_details.listing_events for pre-trigger history.
Tax reassessment forecast NC · Resets to sale price
- Current annual tax
- $1,808 · $151/mo
- Projected year-2 tax
- $1,808 · $151/mo
- Expected delta
- $0/yr ($0/mo · 0.0%)
ⓘ Screening estimate from a state-policy table — verify with the county assessor before closing.
Climate risk First Street
- Flood 4/10 Moderate FEMA zone X (unshaded) · 22% chance over 30 yrs
- Wildfire 4/10 Moderate
- Heat 7/10 Severe 7 d/yr ≥106°F today · 16 d/yr by 30 yrs out
- Wind 7/10 Severe 78% chance of damaging wind over 30 yrs
- Air quality 1/10 Low 0 unhealthy d/yr today · 0 by 30 yrs out
Nearby sold comps map
Loading sold comps map…
Walkable amenities ~0.75 mi
Loading nearby amenities…
Taxation est. · year 1
- Rental income
- $16,086
- − Mortgage interest
- −$10,363
- − Property taxes
- −$1,808
- − Insurance
- −$925
- − Repairs & maintenance
- −$1,287
- − Management
- −$1,287
- − Depreciation
- −$5,382
- Taxable loss
- −$4,966
- Est. tax savings @ 24.0%
- +$1,192
- After-tax cash flow
- $-475/yr
For passive investors: Depreciation is non-cash, so a rental often shows a tax loss while cash-flowing — sheltering income. Rental losses are passive: they offset passive income freely, and up to $25,000/yr can offset ordinary (W-2) income if you actively participate and your MAGI is under $100k (phasing out to $0 by $150k); unused losses carry forward. On sale, claimed depreciation is recaptured at up to 25%, and gains may owe capital-gains tax (a 1031 exchange can defer both). Figures are a year-1 estimate at your 24.0% rate — not tax advice; consult a CPA.
Schools (NCES district)
- District
- Cumberland County Schools
- NCES district ID
- 3700011
- Math proficiency
- 32% ▼ -2.00%
- Reading proficiency
- 41% ▼ -1.00%
- Median HH income
- $44,168
- Composite
- 31.0/100
- National rank
- #6096
- State rank
- #126 of 178 in NC
Livability — Fayetteville
- Score
- 75/100
- State rank
- #45
- US rank
- #4031
Category grades
Schools grade is shown separately in the Schools card above.
Census & demographics
- Census place
- Fayetteville, NC
- City population
- 226,118
- Population (ZIP)
- 19,889
Population outlook (Cumberland County) Hauer SSP2
- Today (2025)
- 330,855 people
- By 2030
- 333,523 · +0.8%
- By 2040
- 335,583 · +1.4%
- By 2050
- 335,325 · +1.4%
- By 2075
- 342,853 · +3.6%
- By 2100
- 340,698 · +3.0%
Race, ethnicity, and origin ACS 2023
- Neighborhood character
- Diverse neighborhood (Simpson 0.61)
- Race & ethnicity
- White 55% Black 29% Two or more races 8% Hispanic / Latino 8% Native American 2%
- Hispanic origin (detail)
- Mexican 4% Puerto Rican 2%
- Common ancestry
- Slovak 3% Serbian 2% Italian 2%
- Foreign-born
- 4% · Canada
- Languages at home
- 93% English-only · Spanish 5% French/Haitian/Cajun 1%
Political lean MEDSL · Cumberland
- 2024 margin
- D (+13.4) · D 56.1% · R 42.7% · Other 1.2%
- 2008→2024 swing
- -4.3pp toward R · 2008: 17.7pp · 2024: 13.4pp
- All cycles
- 2024: D+13.4 2020: D+16.6 2016: D+16.0 2012: D+19.7 2008: D+17.7
Not yet ingested
- Civics
- —
Market trends
- HPI YoY
- ▲ 19.75%
- Current HPI
- 306.7749
- Rent YoY
- —
- Metro
- —
- State GDP YoY
- ▲ 3.28%
- F500 in state
- 26
Industry mix (Fortune 500 HQ in NC)
| Industry | F500 HQs | Revenue |
|---|---|---|
| Financial Services | 2 | $213B |
|
||
| Retail | 2 | $95B |
|
||
| Industrial Conglomerate | 1 | $38B |
|
||
| Metals / Steel | 1 | $35B |
|
||
| Utilities | 1 | $30B |
|
||
| Industrial Machinery | 1 | $19B |
|
||
Price history
+42.3% since first listed18 events — show timeline
- 2026-05-18 Pending — TMLS
- 2026-05-02 Price Changed $185,000 TMLS
- 2026-04-10 Listed $190,000 TMLS
- 2026-02-02 Listing Removed — TMLS
- 2025-09-03 Listed $214,500 TMLS
- 2025-08-25 Listing Removed — TMLS
- 2025-06-04 Listed $214,990 TMLS
- 2025-05-29 Listing Removed — TMLS
- 2025-05-19 Price Changed $217,499 TMLS
- 2025-03-19 Price Changed $217,500 TMLS
- 2025-02-17 Listed $220,000 TMLS
- 2024-12-31 Listing Removed — TMLS
- 2024-12-05 Price Changed $220,000 TMLS
- 2024-10-25 Listed $225,000 TMLS
- 2024-06-14 Sold (Public Records) $115,000 Public Records
- 2024-06-14 Sold (MLS) $115,000 TMLS
- 2024-05-21 Pending — TMLS
- 2024-05-09 Listed $130,000 TMLS
Property tax history
+8.0%/yrLatest (2025): $1,808 · +56.0% YoY. Source: county tax records.
Cash-flow waterfall
monthlySold comps — $/sqft
last 12 mo · ≤1 miLoading sold comps…