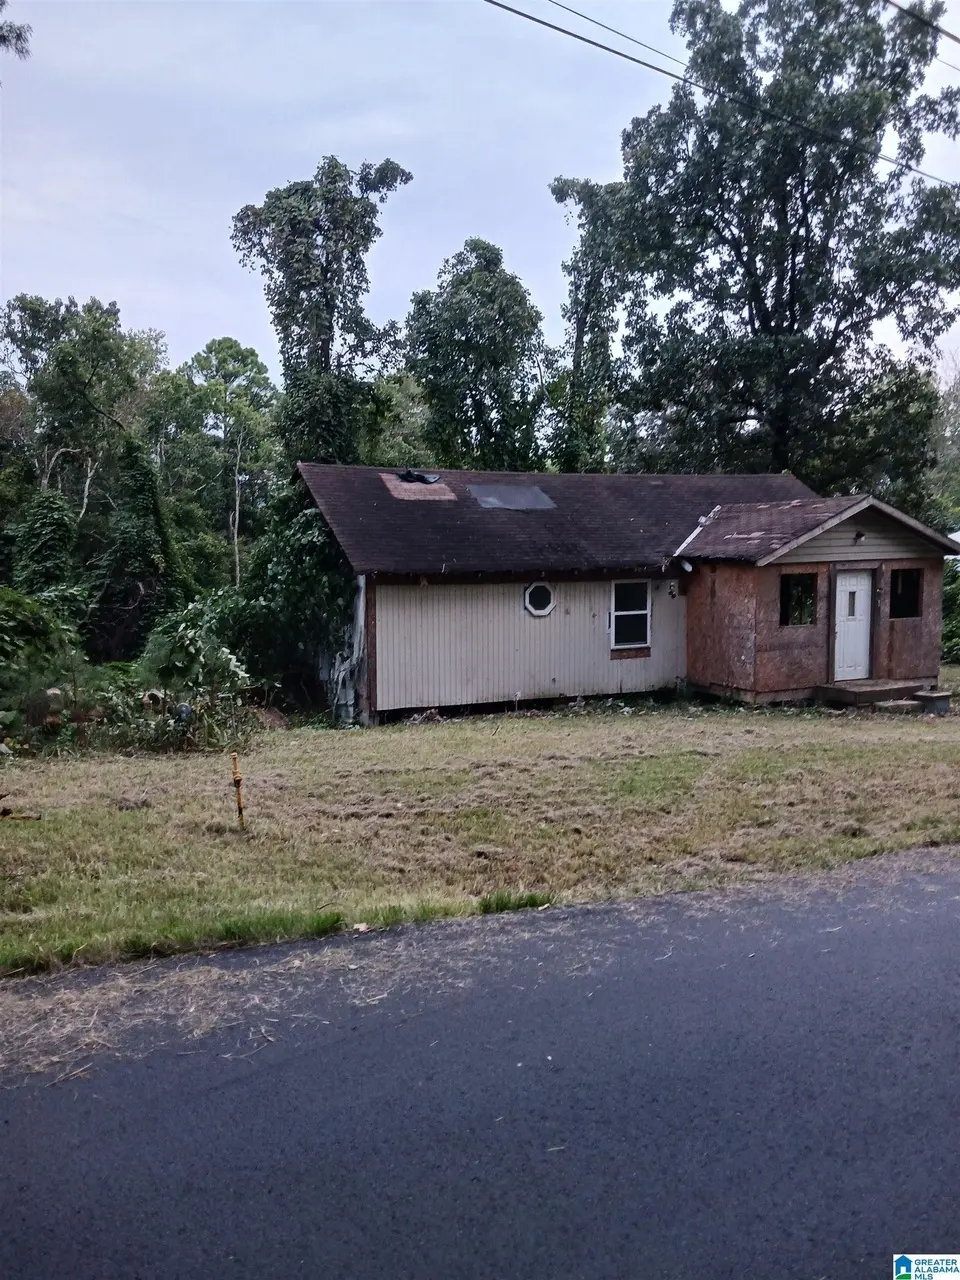
8621 Swafford Ave · Leeds, AL
Flood risk 1/10 · Minimal
- FEMA flood zone
- X (unshaded)
- Chance of flooding over 30 yrs
- 0.0%
- Est. flood insurance / yr
- $473 – $860
Fire risk 5/10 · Moderate
- Est. fire insurance / yr
- $916 – $1,700
Heat risk 5/10 · Moderate
- Hot days now (above 106°F)
- 7 days/yr
- Hot days in 30 yrs
- 18 days/yr
Wind risk 6/10 · Moderate
- Chance of severe wind over 30 yrs
- 27.0%
Air-quality risk 4/10 · Minor
- Unhealthy air days now
- 3 days/yr
- Unhealthy air days in 30 yrs
- 7 days/yr
Risk factors via First Street. Map © Google.
Why this score? — see what drove the B- grade
The composite is a weighted blend of 9 inputs, each scored 0–100. Each bar is that input's sub-score; the figure is the points it added to the 100-point composite (weight × sub-score).
- Cash flow +30.0/30.0
- 1% rule +10.0/10.0
- DSCR +10.0/10.0
- ARV discount +7.5/15.0
- Livability +3.0/5.0
- Schools +2.8/10.0
- Rent growth +2.5/5.0
- Condition / age +2.5/5.0
- Appreciation +0.0/10.0
$54,900
🖨 Deal sheet 📄 Offer letter ✓ Due diligence
Listing remarks MLS
Come and finish the way you like. Won't last long. Convenient to everything.
Key facts
- Convenient location
- 0.24 acre lot
- Built 1988
Tags
Neighborhood map
What this means for you Summary
Snapshot
- This is a 4-bed/2.0-bath single-family listed at $55k.
Deal economics
- At list price, monthly cash flow is $998 ($12k/yr) — positive.
- The deal already cash-flows at list — no discount required.
- Meets the 1% rule at list price ($2k rent vs $55k).
- Recommended offer: $48k (12.0% below list) — sets the bar for market timing.
- Cap rate 28.1% vs local median 4.2% in Leeds — top-decile yield for the area; either an underpriced asset or a hidden risk that comps aren't pricing in. Stress-test before assuming the spread holds.
Location & tenants
- Location reads 60/100 on livability (#286 in AL) — a middle-class / working-renter tenant base. Strengths: cost of living A+, housing A+, employment B+; Watch: schools C-, crime D+, amenities F.
- Leeds City (suburban): math 20% / reading 45% proficiency, ranked #51 of 129 in AL (top 40%) — families likely to look elsewhere, expect single-tenant / working-renter base with shorter leases.
- Market conditions: 158 active listings in the ZIP; 1 comparable units currently listed for rent nearby; 2,114 units permitted in Jefferson County in 2024 (556 in 5+ unit buildings).
Forward outlook
- Local home prices are declining (-3.0%/yr); year-one equity from $380 of loan paydown is wiped out by about $2k of value loss. Plan a longer hold.
- Jefferson County population projected to shrink 4% by 2050 — rents likely to lag national; underwrite the cash flow, not the appreciation.
- At projected returns (-3.0% appreciation + 3.0% rent growth), your $15k cash investment doubles in ~2 years — after that, you're playing with house money.
Negotiation context
- It's been on market 621 days — a 12% lower offer ($48k) is reasonable based on typical stale-listing flexibility.
- 2 sale attempts since 3y ago with the ask held roughly flat each time — persistent listings suggest the price (not the market) is what's stuck; bring a comps-based counter.
- Current owner paid $28k; list at $55k implies a 96% gain — meaningful room to come down on a strong offer.
Risks & watch-outs
- Climate carrying-cost: major wind risk, 27% chance of damaging wind over 30y; moderate wildfire risk; extreme-heat days projected 7→18/yr by 2055 (HVAC capex compounding) — expect insurance premiums to compound above CPI over the hold.
Questions for the listing agent
- It's been on market 621 days. Have you received any prior offers? Is the seller open to a 12% concession, seller financing, or rate buy-down credit?
- Why hasn't it sold? Are there any deal-killer items the seller is aware of (foundation, flood, title, zoning, code violations)?
- Is there a deadline driving the sale (1031 exchange, divorce, estate, relocation)? That informs how much negotiation room exists.
- Crime grade is D in this area — have there been break-ins, vandalism, or insurance claims at this property in the last 3 years? What carrier currently insures it and at what premium?
- What's the average days-on-market for RENTAL listings here right now (not sales)? A rising rental-DOM trend means longer vacancies and softer asking-rent achievability than the comps imply.
- What's the recent tenant-quality profile in this submarket — average credit score on applications, eviction rate, late-payment / NSF rate, and stable-employment percentage? A property-management company in the area should have these aggregated.
- How much new for-sale + rental construction is in the pipeline within 1–3 miles? Heavy new supply typically softens prices + rents 12–24 months out; constrained supply supports both.
Investment metrics
- 1% rule
- 3.05% ✓
- Cap rate
- 28.11%
- Cash-on-cash
- 77.90%
- DSCR
- 4.47
- GRM
- 2.7
CMA / ARV
- ARV (median comp)
- $173,790
- List price
- $54,900
- Delta
- -68.41%
- Verdict
- UNDERPRICED
- Comps
- 10 within 1.0 mi
Projected returns pro-forma
-3.0% appreciation · 3.0% rent growth · sell at horizon
- IRR
- 77.9%
- Equity multiple
- 4.56×
- Total profit
- $54,655
- Equity at exit
- $8,186
- IRR
- 81.5%
- Equity multiple
- 9.42×
- Total profit
- $129,403
- Equity at exit
- $4,747
Cash invested: $15,372 (down + closing). Projections, not guarantees.
Landlord ↔ Tenant lean methodology
- Overall (STATE)
- 90 Strongly Landlord-Friendly
- State Alabama
- 90 Strongly Landlord-Friendly · R+15
- County
- — inherits STATE
- City
- — inherits STATE
ZIP-level market 35094
- Home prices YoY
- -9.7%
- Active inventory
- 158
- Price-to-rent
- 2.7×
Monthly cashflow live
- Estimated rent
- $1,676 medium interval (Pro) →
- Mortgage (P&I)
- −$288
- Tax from tax record
- −$15 /mo · $180/yr
- Insurance
- −$23
- HOA
- −$0
- Vacancy / Maint / Mgmt
- −$352
- Net cashflow
- $998
Break-even live
UW: 25.0% down · 7.5% · 30yr · 1.5% tax · 5.0% vac · 8.0% maint · 8.0% mgmt
Financing live
Cash to close
- Down payment
- $13,725
- Closing costs
- $1,647
- Reserves months
- —
- Total cash needed
- —
Loan-product check · same deal, 3 products live
Conventional
25% down · 7.5% · 30yr
- Down + closing
- —
- Monthly P&I
- —
- Monthly cashflow
- —
- DSCR
- —
- Eligible?
- —
Personal DTI + credit; lowest rate.
DSCR
20% down · 8.5% · 30yr
- Down + closing
- —
- Monthly P&I
- —
- Monthly cashflow
- —
- DSCR
- —
- Eligible?
- —
No personal income docs; deal must DSCR.
Hard money
10% down · 12.0% · 12mo
- Down + closing
- —
- Monthly P&I
- —
- Monthly cashflow
- —
- DSCR
- —
- Eligible?
- —
Short-term bridge; refi at stabilization.
Rent comps 1 comps
| Address | Beds | Baths | Sqft | Rent | $/sqft | DOM | Units | Dist |
|---|---|---|---|---|---|---|---|---|
| 1609 Ray St Leeds, AL | 3.0 | 2.0 | 1064 | $1,200 | $1.13 | 1d | 1 | 1.47mi |
Listing history 19 events
-
2026-06-18days on market $54,900 Active 621 DOM
-
2026-06-17days on market $54,900 Active 620 DOM
-
2026-06-16days on market $54,900 Active 619 DOM
-
2026-06-15days on market $54,900 Active 618 DOM
-
2026-06-13days on market $54,900 Active 616 DOM
-
2026-06-10days on market $54,900 Active 613 DOM
-
2026-06-09days on market $54,900 Active 612 DOM
-
2026-06-08days on market $54,900 Active 611 DOM
-
2026-06-07days on market $54,900 Active 610 DOM
-
2026-06-05days on market $54,900 Active 607 DOM
-
2026-06-03days on market $54,900 Active 606 DOM
-
2026-06-02days on market $54,900 Active 605 DOM
-
2026-06-01days on market $54,900 Active 604 DOM
-
2026-05-31days on market $54,900 Active 603 DOM
-
2024-10-05$54,900 Active 76-char remark
Show marketing remark (76 chars)
Come and finish the way you like. Won't last long. Convenient to everything.
-
2023-06-30soldstatus $28,000 Sold 26-char remark
Show marketing remark (26 chars)
Property to be sold as-is.
-
2023-06-23status Pending 26-char remark
Show marketing remark (26 chars)
Property to be sold as-is.
-
2023-06-19$25,000 Active 26-char remark
Show marketing remark (26 chars)
Property to be sold as-is.
-
2011-09-09soldstatus $10,000
ⓘ Source: listings_history table (triggers on properties + properties_extension) + one-shot
backfill from property_details.listing_events for pre-trigger history.
Tax reassessment forecast AL · Resets to sale price
- Current annual tax
- $180 · $15/mo
- Projected year-2 tax
- $225 · $19/mo
- Expected delta
- +$45/yr (+$4/mo · 24.9%)
ⓘ Screening estimate from a state-policy table — verify with the county assessor before closing.
Climate risk First Street
- Flood 1/10 Low FEMA zone X (unshaded) · 0% chance over 30 yrs
- Wildfire 5/10 Major
- Heat 5/10 Major 7 d/yr ≥106°F today · 18 d/yr by 30 yrs out
- Wind 6/10 Major 27% chance of damaging wind over 30 yrs
- Air quality 4/10 Moderate 3 unhealthy d/yr today · 7 by 30 yrs out
Nearby sold comps map
Loading sold comps map…
Walkable amenities ~0.75 mi
Loading nearby amenities…
Taxation est. · year 1
- Rental income
- $20,107
- − Mortgage interest
- −$3,075
- − Property taxes
- −$180
- − Insurance
- −$274
- − Repairs & maintenance
- −$1,609
- − Management
- −$1,609
- − Depreciation
- −$1,597
- Taxable income
- $11,763
- Est. tax owed @ 24.0%
- −$2,823
- After-tax cash flow
- $9,152/yr
For passive investors: Depreciation is non-cash, so a rental often shows a tax loss while cash-flowing — sheltering income. Rental losses are passive: they offset passive income freely, and up to $25,000/yr can offset ordinary (W-2) income if you actively participate and your MAGI is under $100k (phasing out to $0 by $150k); unused losses carry forward. On sale, claimed depreciation is recaptured at up to 25%, and gains may owe capital-gains tax (a 1031 exchange can defer both). Figures are a year-1 estimate at your 24.0% rate — not tax advice; consult a CPA.
Schools (NCES district)
- District
- Leeds City
- NCES district ID
- 0100011
- Math proficiency
- 20% ▼ -25.00%
- Reading proficiency
- 45% ▲ 3.00%
- Median HH income
- $50,367
- Composite
- 28.21/100
- National rank
- #6803
- State rank
- #51 of 129 in AL
Livability — Leeds
- Score
- 60/100
- State rank
- #286
- US rank
- #18674
Category grades
Schools grade is shown separately in the Schools card above.
Census & demographics
- Census place
- Leeds, AL
- County
- Jefferson County · 527,445 people
- City population
- 14,854
- Metro
- Birmingham-Hoover, AL
- Population (ZIP)
- 14,854
- Household income
- $74,625
- Rent vs Own
- Severe rent burden
- 248.0
Population outlook (Jefferson County) Hauer SSP2
- Today (2025)
- 669,185 people
- By 2030
- 669,694 · +0.1%
- By 2040
- 661,388 · -1.2%
- By 2050
- 643,086 · -3.9%
- By 2075
- 577,267 · -13.7%
- By 2100
- 474,758 · -29.1%
Race, ethnicity, and origin ACS 2023
- Neighborhood character
- Predominantly White (77%)
- Race & ethnicity
- White 77% Black 12% Hispanic / Latino 9% Two or more races 7%
- Hispanic origin (detail)
- Mexican 5% Puerto Rican 2%
- Common ancestry
- Slovak 3% Serbian 2% Italian 1%
- Foreign-born
- 3% · Canada
- Languages at home
- 92% English-only · Spanish 8%
Political lean MEDSL · Jefferson
- 2024 margin
- D (+10.4) · D 54.6% · R 44.2% · Other 1.2%
- 2008→2024 swing
- +5.4pp toward D · 2008: 5.1pp · 2024: 10.4pp
- All cycles
- 2024: D+10.4 2020: D+13.2 2016: D+7.2 2012: D+6.0 2008: D+5.1
Not yet ingested
- Civics
- —
Market trends
- HPI YoY
- ▼ -23.99%
- Current HPI
- 223.9527
- Rent YoY
- —
- Metro
- Birmingham-Hoover, AL
- State GDP YoY
- ▲ 2.94%
- F500 in state
- 4
Industry mix (Fortune 500 HQ in AL)
| Industry | F500 HQs | Revenue |
|---|---|---|
| Financial Services | 1 | $8B |
|
||
| Healthcare | 1 | $5B |
|
||
Price history
+449.0% since first listed5 events — show timeline
- 2024-10-05 Listed $54,900 Greater Alabama MLS
- 2023-06-30 Sold (MLS) $28,000 Greater Alabama MLS
- 2023-06-23 Pending — Greater Alabama MLS
- 2023-06-19 Listed $25,000 Greater Alabama MLS
- 2011-09-09 Sold (Public Records) $10,000 Public Records
Property tax history
-5.1%/yrLatest (2025): $180 · +0.0% YoY. Source: county tax records.
Cash-flow waterfall
monthlySold comps — $/sqft
last 12 mo · ≤1 miLoading sold comps…