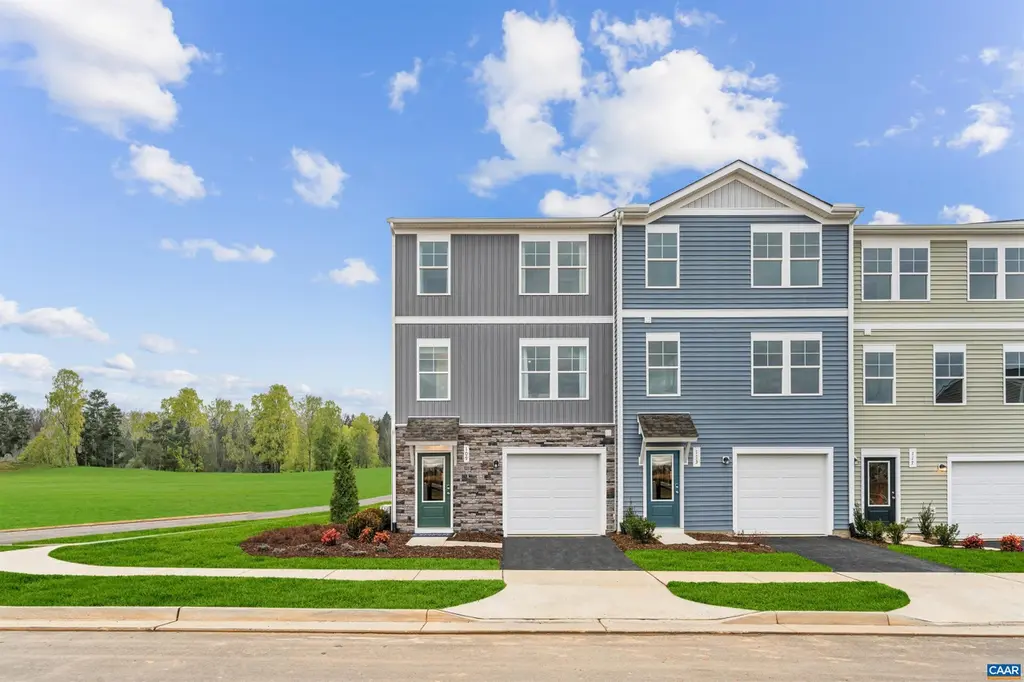
61 Laurin St #34 · Lake Monticello, VA
Flood risk 1/10 · Minimal
- FEMA flood zone
- X (unshaded)
- Chance of flooding over 30 yrs
- 0.0%
- Est. flood insurance / yr
- $507 – $1,088
Fire risk 2/10 · Minimal
- Est. fire insurance / yr
- $666 – $1,236
Heat risk 6/10 · Moderate
- Hot days now (above 104°F)
- 7 days/yr
- Hot days in 30 yrs
- 17 days/yr
Wind risk 3/10 · Minor
- Chance of severe wind over 30 yrs
- 4.0%
Air-quality risk 1/10 · Minimal
- Unhealthy air days now
- 0 days/yr
- Unhealthy air days in 30 yrs
- 0 days/yr
Risk factors via First Street. Map © Google.
Why this score? — see what drove the D- grade
The composite is a weighted blend of 9 inputs, each scored 0–100. Each bar is that input's sub-score; the figure is the points it added to the 100-point composite (weight × sub-score).
- Cash flow +9.5/30.0
- ARV discount +7.5/15.0
- Schools +5.8/10.0
- Condition / age +4.0/5.0
- Livability +3.4/5.0
- 1% rule +3.3/10.0
- Rent growth +3.1/5.0
- DSCR +2.7/10.0
- Appreciation +0.0/10.0
$299,000
🖨 Deal sheet 📄 Offer letter ✓ Due diligence
Listing remarks MLS
New construction 3-bedroom, 2 Full Bath, 2 Powder Rooms , 1-Car Garage townhome offering quartz countertops, all-new GE appliances, and stylish, modern finishes throughout. Designed for comfort and convenience with low-maintenance living in mind. Anticipated completion June — secure your new home now!
Key facts
- Quartz countertops
- Modern finishes
- Ge appliances
Tags
Neighborhood map
What this means for you Summary
Snapshot
- This is a 3-bed/3.0-bath townhouse listed at $299k. Condition is rated good.
Deal economics
- At list price, monthly cash flow is $-208 ($-2k/yr) — negative.
- To cash-flow at today's rent, offer at most $269k (10.1% below list).
- To meet the 1% rule (rent ≥ 1% of price), the offer needs to be $247k (17.3% below list).
- Recommended offer: $247k (17.3% below list) — sets the bar for 1% rule.
- Cap rate 5.5% vs local median 3.6% in Lake Monticello — top-decile yield for the area; either an underpriced asset or a hidden risk that comps aren't pricing in. Stress-test before assuming the spread holds.
Location & tenants
- Location reads 67/100 on livability (#284 in VA) — a middle-class / working-renter tenant base. Strengths: employment A+, housing A+, crime A; Watch: schools D+, amenities F, commute F.
- Fluvanna County Public School District (rural): math 61% / reading 71% proficiency, ranked #34 of 131 in VA (top 26%) — acceptable for families but not a draw, mixed tenant base, ~2y average lease.
- Market conditions: Rents rising (+2.5%/yr); 278 active listings in the ZIP; 2 comparable units currently listed for rent nearby; solid renter incomes; 138 units permitted in Fluvanna County in 2024 (6 in 5+ unit buildings).
- This rent runs 32% of the median local income ($93k/yr) — at the standard rent-burdened threshold; future hikes will face affordability resistance.
Forward outlook
- Local home prices are declining (-3.0%/yr); year-one equity from $2k of loan paydown is wiped out by about $9k of value loss. Plan a longer hold.
Negotiation context
- It's been on market 85 days — a 6% lower offer ($281k) is reasonable based on typical stale-listing flexibility.
Risks & watch-outs
- Climate carrying-cost: extreme-heat days projected 7→17/yr by 2055 (HVAC capex compounding) — expect insurance premiums to compound above CPI over the hold.
Questions for the listing agent
- What do current leases actually rent for vs. the listed asking? Can we see a recent rent roll and the last 12 months of T-12 income?
- It's been on market 85 days. Have you received any prior offers? Is the seller open to a 17% concession, seller financing, or rate buy-down credit?
- What does the HOA fee cover, when was the last increase, and are there any pending special assessments or reserve-fund shortfalls?
- Why hasn't it sold? Are there any deal-killer items the seller is aware of (foundation, flood, title, zoning, code violations)?
- Is there a deadline driving the sale (1031 exchange, divorce, estate, relocation)? That informs how much negotiation room exists.
- Schools are D-rated, which usually means shorter tenancies and higher turnover. Who's the typical renter profile here, and what's been the actual vacancy rate?
- The area grade is low — what's the realistic commute time and amenity access for the typical tenant pool here? Any planned neighborhood developments (good or bad) we should know about?
- What's the average days-on-market for RENTAL listings here right now (not sales)? A rising rental-DOM trend means longer vacancies and softer asking-rent achievability than the comps imply.
- What's the recent tenant-quality profile in this submarket — average credit score on applications, eviction rate, late-payment / NSF rate, and stable-employment percentage? A property-management company in the area should have these aggregated.
- How much new for-sale + rental construction is in the pipeline within 1–3 miles? Heavy new supply typically softens prices + rents 12–24 months out; constrained supply supports both.
Investment metrics
- 1% rule
- 0.83% ✗
- Cap rate
- 5.46%
- Cash-on-cash
- -2.98%
- DSCR
- 0.87
- GRM
- 10.1
CMA / ARV
- ARV (median comp)
- $298,740
- List price
- $299,000
- Delta
- 0.09%
- Verdict
- FAIR
- Comps
- 20 within 1.0 mi
Show comp detail 12 sales within ~0.75 mi
| Address | Dist | Beds/Ba | Sqft | Sold | Price | $/sf | Match |
|---|---|---|---|---|---|---|---|
| 41 Laurin St #29 | 0.02mi | 3/3.0 | 1,833 (0%) | 1mo | $289,990 | $158 | 98 |
| 106 Saxon St #106 | 0.16mi | 3/3.0 | 1,833 (0%) | 1mo | $299,990 | $164 | 92 |
| 110 Saxon St | 0.17mi | 3/3.0 | 1,866 (+2%) | 2mo | $299,000 | $160 | 88 |
| 103 Oldfield Dr | 0.04mi | 4/3.5 (+1) | 1,814 (-1%) | 3mo | $299,990 | $165 | 87 |
| 47 Laurin St #31 | 0.15mi | 3/2.5 | 1,800 (-2%) | 2mo | $314,990 | $175 | 86 |
| 97 Oldfield Dr | 0.04mi | 4/3.5 (+1) | 1,814 (-1%) | 3mo | $314,035 | $173 | 86 |
| 99 Oldfield Dr | 0.04mi | 4/3.5 (+1) | 1,800 (-2%) | 3mo | $297,490 | $165 | 86 |
| 114 Saxon St | 0.14mi | 3/2.5 | 1,800 (-2%) | 4mo | $312,000 | $173 | 86 |
| 130 Saxon St Lot 73 | 0.09mi | 4/3.5 (+1) | 1,866 (+2%) | 1mo | $312,590 | $168 | 85 |
| Lot 66 Saxon St | 0.15mi | 3/2.5 | 1,866 (+2%) | 4mo | $306,589 | $164 | 84 |
| 43 Laurin St Lot 30 | 0.10mi | 4/3.5 (+1) | 1,866 (+2%) | 2mo | $311,990 | $167 | 84 |
| 120 Saxon St | 0.17mi | 4/3.5 (+1) | 1,866 (+2%) | 1mo | $328,830 | $176 | 81 |
Match score weights: distance 35% · size 25% · config 20% · recency 20%. Top-matched comps best support the ARV.
Projected returns pro-forma
-3.0% appreciation · 2.47% rent growth · sell at horizon
- IRR
- -21.9%
- Equity multiple
- 0.25×
- Total profit
- $-62,906
- Equity at exit
- $44,582
- IRR
- -17.0%
- Equity multiple
- 0.08×
- Total profit
- $-76,762
- Equity at exit
- $25,852
Cash invested: $83,720 (down + closing). Projections, not guarantees.
Landlord ↔ Tenant lean methodology
- Overall (STATE)
- 55 Moderately Landlord-Leaning
- State Virginia
- 55 Moderately Landlord-Leaning · D+2
- County
- — inherits STATE
- City
- — inherits STATE
ZIP-level market 22902
- Rents YoY
- 2.5%
- Active inventory
- 278
- Price-to-rent
- 10.1×
Monthly cashflow live
- Estimated rent
- $2,473 medium interval (Pro) →
- Mortgage (P&I)
- −$1,568
- Tax est. 1.5%
- −$374 /mo · $4,485/yr
- Insurance
- −$125
- HOA
- −$95
- Vacancy / Maint / Mgmt
- −$519
- Net cashflow
- $-208
Break-even live
UW: 25.0% down · 7.5% · 30yr · 1.5% tax · 5.0% vac · 8.0% maint · 8.0% mgmt
Financing live
Cash to close
- Down payment
- $74,750
- Closing costs
- $8,970
- Reserves months
- —
- Total cash needed
- —
Loan-product check · same deal, 3 products live
Conventional
25% down · 7.5% · 30yr
- Down + closing
- —
- Monthly P&I
- —
- Monthly cashflow
- —
- DSCR
- —
- Eligible?
- —
Personal DTI + credit; lowest rate.
DSCR
20% down · 8.5% · 30yr
- Down + closing
- —
- Monthly P&I
- —
- Monthly cashflow
- —
- DSCR
- —
- Eligible?
- —
No personal income docs; deal must DSCR.
Hard money
10% down · 12.0% · 12mo
- Down + closing
- —
- Monthly P&I
- —
- Monthly cashflow
- —
- DSCR
- —
- Eligible?
- —
Short-term bridge; refi at stabilization.
Rent comps 2 comps
| Address | Beds | Baths | Sqft | Rent | $/sqft | DOM | Units | Dist |
|---|---|---|---|---|---|---|---|---|
| 37 Laurin St Cunningham, VA | 4.0 | 3.5 | 1800 | $2,350 | $1.31 | 13d | 1 | 0.02mi |
| 367 Jefferson Dr Palmyra, VA | 2.0 | 1.5 | 1434 | $1,750 | $1.22 | 43d | 1 | 1.49mi |
HOA detail
- Monthly dues
- $95 · $1,140/yr
Listing history 17 events
-
2026-06-19days on market $299,000 Active 85 DOM
-
2026-06-18days on market $299,000 Active 84 DOM
-
2026-06-17days on market $299,000 Active 83 DOM
-
2026-06-16days on market $299,000 Active 82 DOM
-
2026-06-15days on market $299,000 Active 81 DOM
-
2026-06-14days on market $299,000 Active 79 DOM
-
2026-06-13days on market $299,000 Active 78 DOM
-
2026-06-10days on market $299,000 Active 76 DOM
-
2026-06-09days on market $299,000 Active 75 DOM
-
2026-06-08days on market $299,000 Active 74 DOM
-
2026-06-07days on market $299,000 Active 73 DOM
-
2026-06-02days on market $299,000 Active 68 DOM
-
2026-06-01days on market $299,000 Active 67 DOM
-
2026-05-31days on market $299,000 Active 66 DOM
-
2026-05-30days on market $299,000 Active 65 DOM
-
2026-05-11price $299,000 308-char remark
Show marketing remark (308 chars)
New construction 3-bedroom, 2 Full Bath, 2 Powder Rooms , 1-Car Garage townhome offering quartz countertops, all-new GE appliances, and stylish, modern finishes throughout. Designed for comfort and convenience with low-maintenance living in mind. Anticipated completion June — secure your new home now!
-
2026-03-26$310,990 Active 308-char remark
Show marketing remark (308 chars)
New construction 3-bedroom, 2 Full Bath, 2 Powder Rooms , 1-Car Garage townhome offering quartz countertops, all-new GE appliances, and stylish, modern finishes throughout. Designed for comfort and convenience with low-maintenance living in mind. Anticipated completion June — secure your new home now!
ⓘ Source: listings_history table (triggers on properties + properties_extension) + one-shot
backfill from property_details.listing_events for pre-trigger history.
Climate risk First Street
- Flood 1/10 Low FEMA zone X (unshaded) · 0% chance over 30 yrs
- Wildfire 2/10 Low
- Heat 6/10 Major 7 d/yr ≥104°F today · 17 d/yr by 30 yrs out
- Wind 3/10 Moderate 4% chance of damaging wind over 30 yrs
- Air quality 1/10 Low 0 unhealthy d/yr today · 0 by 30 yrs out
Nearby sold comps map
Loading sold comps map…
Walkable amenities ~0.75 mi
Loading nearby amenities…
Taxation est. · year 1
- Rental income
- $29,673
- − Mortgage interest
- −$16,749
- − Property taxes
- −$4,485
- − Insurance
- −$1,495
- − Repairs & maintenance
- −$2,374
- − Management
- −$2,374
- − HOA
- −$1,140
- − Depreciation
- −$8,698
- Taxable loss
- −$7,642
- Est. tax savings @ 24.0%
- +$1,834
- After-tax cash flow
- $-660/yr
For passive investors: Depreciation is non-cash, so a rental often shows a tax loss while cash-flowing — sheltering income. Rental losses are passive: they offset passive income freely, and up to $25,000/yr can offset ordinary (W-2) income if you actively participate and your MAGI is under $100k (phasing out to $0 by $150k); unused losses carry forward. On sale, claimed depreciation is recaptured at up to 25%, and gains may owe capital-gains tax (a 1031 exchange can defer both). Figures are a year-1 estimate at your 24.0% rate — not tax advice; consult a CPA.
Condition & rehab AI · 12 photos
This new construction townhome is in excellent condition with modern finishes and low-maintenance living in mind. It offers a great value with potential for further improvements to enhance its curb appeal and functionality.
Value-add opportunities
- Both Painting the exterior and interior walls — Fresh paint can enhance curb appeal and interior aesthetics.
- Both Landscaping improvements — Enhanced landscaping can improve curb appeal and attract potential buyers/tenants.
- Both Adding smart home features — Smart home features can increase convenience and appeal to tech-savvy buyers/tenants.
- Both Upgrading the kitchen appliances — Modern appliances can make the kitchen more functional and appealing to potential buyers/tenants.
Renovation cost estimate screening
Value-add ROI direction
- Both Painting the exterior and interior walls — Fresh paint can enhance curb appeal and interior aesthetics. ↑
- Both Landscaping improvements — Enhanced landscaping can improve curb appeal and attract potential buyers/tenants. ↑
- Both Adding smart home features — Smart home features can increase convenience and appeal to tech-savvy buyers/tenants. ↑
- Both Upgrading the kitchen appliances — Modern appliances can make the kitchen more functional and appealing to potential buyers/tenants. ↑
ⓘ Cost ranges are severity-bucket heuristics (US national rule-of-thumb). Get contractor quotes + a written scope before underwriting a rehab budget.
Schools (NCES district)
- District
- Fluvanna County Public School District
- NCES district ID
- 5101380
- Math proficiency
- 61% ▼ -23.00%
- Reading proficiency
- 71% ▼ -4.00%
- Median HH income
- $66,601
- Composite
- 57.6/100
- National rank
- #1065
- State rank
- #34 of 131 in VA
Livability — Lake Monticello
- Score
- 67/100
- State rank
- #284
- US rank
- #10173
Category grades
Schools grade is shown separately in the Schools card above.
Census & demographics
- Census place
- Lake Monticello, VA
- County
- Albemarle County · 129,350 people
- Metro
- Charlottesville, VA
- Population (ZIP)
- 23,486
- Household income
- $93,463
- Rent vs Own
- Severe rent burden
- 894.0
Population outlook (Fluvanna County) Hauer SSP2
- Today (2025)
- 27,237 people
- By 2030
- 27,607 · +1.4%
- By 2040
- 28,075 · +3.1%
- By 2050
- 28,019 · +2.9%
- By 2075
- 28,058 · +3.0%
- By 2100
- 26,124 · -4.1%
Race, ethnicity, and origin ACS 2023
- Neighborhood character
- Predominantly White (69%)
- Race & ethnicity
- White 69% Black 11% Hispanic / Latino 11% Two or more races 6% Asian 5%
- Hispanic origin (detail)
- Mexican 7%
- Common ancestry
- Italian 5% Lithuanian 3% Slovak 2%
- Foreign-born
- 12% · Canada, China
- Languages at home
- 84% English-only · Spanish 8% Other Indo-European 3% Other Asian/Pacific 1%
Political lean MEDSL · Fluvanna
- 2024 margin
- Lean R (+6.3) · D 46.4% · R 52.6% · Other 1.0%
- 2008→2024 swing
- -4.4pp toward R · 2008: -1.8pp · 2024: -6.3pp
- All cycles
- 2024: R+6.3 2020: R+4.7 2016: R+9.4 2012: R+6.2 2008: R+1.8
Not yet ingested
- Civics
- —
Market trends
- HPI YoY
- ▼ -372.57%
- Current HPI
- 295.9918
- Rent YoY
- ▲ 2.47%
- Metro
- Charlottesville, VA
- State GDP YoY
- ▲ 2.40%
- F500 in state
- 50
Industry mix (Fortune 500 HQ in VA)
| Industry | F500 HQs | Revenue |
|---|---|---|
| Aerospace / Defense | 4 | $236B |
|
||
| Technology / Defense | 3 | $32B |
|
||
| Financial Services | 2 | $176B |
|
||
| Utilities | 2 | $27B |
|
||
| Insurance | 2 | $25B |
|
||
| Technology | 2 | $15B |
|
||
Price history
-3.9% since first listed2 events — show timeline
- 2026-05-11 Price Changed $299,000 CAAR
- 2026-03-26 Listed $310,990 CAAR
Cash-flow waterfall
monthlySold comps — $/sqft
last 12 mo · ≤1 miLoading sold comps…