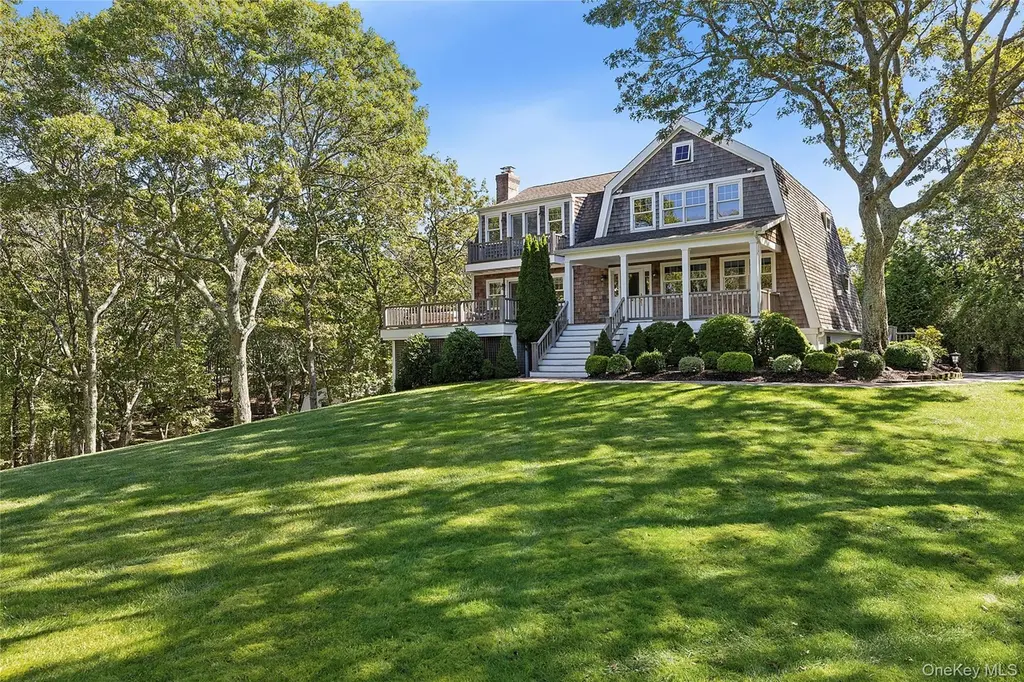
22 Old Trail Rd · Water Mill, NY
Flood risk 1/10 · Minimal
- FEMA flood zone
- X (unshaded)
- Chance of flooding over 30 yrs
- 0.0%
- Est. flood insurance / yr
- $473 – $860
Fire risk 3/10 · Minor
- Est. fire insurance / yr
- $691 – $1,283
Heat risk 4/10 · Minor
- Hot days now (above 90°F)
- 7 days/yr
- Hot days in 30 yrs
- 18 days/yr
Wind risk 8/10 · Major
- Chance of severe wind over 30 yrs
- 80.0%
Air-quality risk 3/10 · Minor
- Unhealthy air days now
- 2 days/yr
- Unhealthy air days in 30 yrs
- 3 days/yr
Risk factors via First Street. Map © Google.
Why this score? — see what drove the A- grade
The composite is a weighted blend of 9 inputs, each scored 0–100. Each bar is that input's sub-score; the figure is the points it added to the 100-point composite (weight × sub-score).
- Cash flow +30.0/30.0
- 1% rule +10.0/10.0
- DSCR +10.0/10.0
- Appreciation +9.3/10.0
- ARV discount +7.7/15.0
- Rent growth +5.0/5.0
- Schools +4.8/10.0
- Livability +3.6/5.0
- Condition / age +2.5/5.0
$2,100,000
🖨 Deal sheet 📄 Offer letter ✓ Due diligence
Listing remarks
Welcome to 22 Old Trail Road, a charming beach cottage-style residence of 4 bedrooms plus den and 3.5 baths. It is tucked away in the tranquil town of Water Mill, NY. This home is a captivating blend of comfort and elegance, nestled on a generous 2-acre private lot. As you step into the foyer, the 17-foot high ceiling immediately captures your attention, leading you into a living room adorned with wood burning fireplace and French doors and adjacent den. The open dining room or media room has authentic rustic, shiplap, a cozy fireplace and built-in media center. The wide plank hardwood floors showcase well all styles of decor. There is a guest powder room. The gourmet chef's kitchen, equipp
Key facts
- 17 foot high ceiling
- 2 acre private lot
- Rustic shiplap
Tags
Neighborhood map
What this means for you Summary
Snapshot
- This is a 5-bed/2.0-bath single-family listed at $2.10M.
Deal economics
- At list price, monthly cash flow is $33k ($398k/yr) — positive.
- The deal already cash-flows at list — no discount required.
- Meets the 1% rule at list price ($58k rent vs $2.10M).
- Recommended offer: $1.85M (12.0% below list) — sets the bar for market timing.
- Cap rate 25.3% vs local median 10.6% in Water Mill — top-decile yield for the area; either an underpriced asset or a hidden risk that comps aren't pricing in. Stress-test before assuming the spread holds.
Location & tenants
- Location reads 71/100 on livability (#410 in NY) — a middle-class / working-renter tenant base. Strengths: crime A+, employment A+, commute A-; Watch: amenities F, cost of living F, housing F.
- Southampton Union Free School District (suburban): math 53% / reading 51% proficiency, ranked #293 of 590 in NY (top 50%) — acceptable for families but not a draw, mixed tenant base, ~2y average lease.
- Zoned schools: Southampton Elementary School (math 42% / reading 57%, grade D, #1,085 of 2,108 statewide, top 56%, 376 students, 51% FRL); Southampton Intermediate School (math 30% / reading 47%, grade F, #437 of 729 statewide, top 60%, 363 students, 44% FRL); Southampton High School (math 98%, 595 students, 48% FRL) — zoned schools average 48% FRL vs 30% district-wide (17 pts higher); higher-poverty schools than district average — tighter screening recommended.
- Market conditions: Rents rising fast (+30.1%/yr); 52 active listings in the ZIP; 5 comparable units currently listed for rent nearby; rentals at typical pace (median 22d on market — plan ~3-4 weeks tenant-placement turnaround); high-income renter base; 1,366 units permitted in Suffolk County in 2024 (216 in 5+ unit buildings).
- At $57,733/mo this rent would consume 384% of the median local household income ($180k/yr) — very limited rent-growth headroom before tenants either downsize or default.
Forward outlook
- In year one you build about $196k of equity ($15k loan paydown + $181k appreciation (8.6% local appreciation)).
- Suffolk County population projected to shrink 5% by 2050 — rents likely to lag national; underwrite the cash flow, not the appreciation.
- At projected returns (8.6% appreciation + 8.0% rent growth), your $588k cash investment doubles in ~1 year — after that, you're playing with house money.
- By year 2, paydown + projected appreciation supports a ~$314k cash-out refi (75% LTV) — recoverable capital for the next deal without selling this one.
Negotiation context
- It's been on market 156 days — a 12% lower offer ($1.85M) is reasonable based on typical stale-listing flexibility.
- 2 sale attempts; this cycle's ask has dropped $695k (25%) from the opening price — seller is motivated, your offer sets the floor, not the list.
Risks & watch-outs
- Climate carrying-cost: severe wind risk, 80% chance of damaging wind over 30y — expect insurance premiums to compound above CPI over the hold.
Questions for the listing agent
- It's been on market 156 days. Have you received any prior offers? Is the seller open to a 12% concession, seller financing, or rate buy-down credit?
- Built in 1973 — when were the roof, HVAC, electrical panel, plumbing, and water heater last replaced?
- Why hasn't it sold? Are there any deal-killer items the seller is aware of (foundation, flood, title, zoning, code violations)?
- Is there a deadline driving the sale (1031 exchange, divorce, estate, relocation)? That informs how much negotiation room exists.
- What's the average days-on-market for RENTAL listings here right now (not sales)? A rising rental-DOM trend means longer vacancies and softer asking-rent achievability than the comps imply.
- What's the recent tenant-quality profile in this submarket — average credit score on applications, eviction rate, late-payment / NSF rate, and stable-employment percentage? A property-management company in the area should have these aggregated.
- How much new for-sale + rental construction is in the pipeline within 1–3 miles? Heavy new supply typically softens prices + rents 12–24 months out; constrained supply supports both.
Investment metrics
- 1% rule
- 2.75% ✓
- Cap rate
- 25.26%
- Cash-on-cash
- 67.73%
- DSCR
- 4.01
- GRM
- 3.0
CMA / ARV
- ARV (on-the-fly)
- $2,109,824
- Comps found
- 2
Show comp detail 2 sales within ~0.75 mi
| Address | Dist | Beds/Ba | Sqft | Sold | Price | $/sf | Match |
|---|---|---|---|---|---|---|---|
| 6 Trail Ct | 0.41mi | 5/3.5 | 2,563 (+3%) | 2mo | $2,000,000 | $780 | 68 |
| 124 Bridies Path | 0.47mi | 4/2.5 (-1) | 2,200 (-12%) | 16mo | $1,865,500 | $848 | 38 |
Match score weights: distance 35% · size 25% · config 20% · recency 20%. Top-matched comps best support the ARV.
Projected returns pro-forma
8.63% appreciation · 8.0% rent growth · sell at horizon
- IRR
- 81.9%
- Equity multiple
- 6.73×
- Total profit
- $3,369,019
- Equity at exit
- $1,686,417
- IRR
- 78.8%
- Equity multiple
- 16.27×
- Total profit
- $8,979,581
- Equity at exit
- $3,438,241
Cash invested: $588,000 (down + closing). Projections, not guarantees.
Landlord ↔ Tenant lean methodology
- Overall (STATE)
- 15 Strongly Tenant-Friendly
- State New York
- 15 Strongly Tenant-Friendly · D+10
- County
- — inherits STATE
- City
- — inherits STATE
ZIP-level market 11976
- Home prices YoY
- 1.6%
- Rents YoY
- 30.1%
- Active inventory
- 52
- Price-to-rent
- 3.0×
Monthly cashflow live
- Estimated rent
- $57,733 medium interval (Pro) →
- Mortgage (P&I)
- −$11,013
- Tax from tax record
- −$534 /mo · $6,408/yr
- Insurance
- −$875
- HOA
- −$0
- Vacancy / Maint / Mgmt
- −$12,124
- Net cashflow
- $33,187
Break-even live
UW: 25.0% down · 7.5% · 30yr · 1.5% tax · 5.0% vac · 8.0% maint · 8.0% mgmt
Financing live
Cash to close
- Down payment
- $525,000
- Closing costs
- $63,000
- Reserves months
- —
- Total cash needed
- —
Loan-product check · same deal, 3 products live
Conventional
25% down · 7.5% · 30yr
- Down + closing
- —
- Monthly P&I
- —
- Monthly cashflow
- —
- DSCR
- —
- Eligible?
- —
Personal DTI + credit; lowest rate.
DSCR
20% down · 8.5% · 30yr
- Down + closing
- —
- Monthly P&I
- —
- Monthly cashflow
- —
- DSCR
- —
- Eligible?
- —
No personal income docs; deal must DSCR.
Hard money
10% down · 12.0% · 12mo
- Down + closing
- —
- Monthly P&I
- —
- Monthly cashflow
- —
- DSCR
- —
- Eligible?
- —
Short-term bridge; refi at stabilization.
Rent comps 5 comps
| Address | Beds | Baths | Sqft | Rent | $/sqft | DOM | Units | Dist |
|---|---|---|---|---|---|---|---|---|
| 126 Middle Line Hwy Southampton, NY | 4.0 | 4.5 | 3000 | $80,000 | $26.67 | 22d | 1 | 0.21mi |
| 1646 Noyack Rd Southampton, NY | 4.0 | 3.0 | 2458 | $40,000 | $16.27 | 22d | 1 | 0.87mi |
| 9 Pine Tree Rd Southampton, NY | 4.0 | 3.5 | 2000 | $7,000 | $3.50 | 43d | 1 | 0.97mi |
| 112 Laurel Valley Dr Sag Harbor, NY | 4.0 | 3.0 | 2400 | $20,000 | $8.33 | 1d | 1 | 1.04mi |
| 17 Bayview Rd Southampton, NY | 4.0 | 3.5 | 3112 | $55,000 | $17.67 | 22d | 1 | 1.16mi |
Listing history 9 events
-
2025-11-19status Pending
-
2025-10-08status Active
-
2025-10-05historical
-
2025-09-22price $2,100,000
-
2025-09-10price $2,250,000
-
2025-08-28price $2,345,000
-
2025-08-08price $2,445,000
-
2025-06-25price $2,495,000
-
2025-06-12$2,795,000 Active
ⓘ Source: listings_history table (triggers on properties + properties_extension) + one-shot
backfill from property_details.listing_events for pre-trigger history.
Tax reassessment forecast NY · Partial reset (capped growth)
- Current annual tax
- $6,408 · $534/mo
- Projected year-2 tax
- $20,949 · $1,746/mo
- Expected delta
- +$14,541/yr (+$1,212/mo · 226.9%)
ⓘ Screening estimate from a state-policy table — verify with the county assessor before closing.
Climate risk First Street
- Flood 1/10 Low FEMA zone X (unshaded) · 0% chance over 30 yrs
- Wildfire 3/10 Moderate
- Heat 4/10 Moderate 7 d/yr ≥90°F today · 18 d/yr by 30 yrs out
- Wind 8/10 Severe 80% chance of damaging wind over 30 yrs
- Air quality 3/10 Moderate 2 unhealthy d/yr today · 3 by 30 yrs out
Nearby sold comps map
Loading sold comps map…
Walkable amenities ~0.75 mi
Loading nearby amenities…
Taxation est. · year 1
- Rental income
- $692,793
- − Mortgage interest
- −$117,633
- − Property taxes
- −$6,408
- − Insurance
- −$10,500
- − Repairs & maintenance
- −$55,423
- − Management
- −$55,423
- − Depreciation
- −$61,091
- Taxable income
- $386,315
- Est. tax owed @ 24.0%
- −$92,716
- After-tax cash flow
- $305,532/yr
For passive investors: Depreciation is non-cash, so a rental often shows a tax loss while cash-flowing — sheltering income. Rental losses are passive: they offset passive income freely, and up to $25,000/yr can offset ordinary (W-2) income if you actively participate and your MAGI is under $100k (phasing out to $0 by $150k); unused losses carry forward. On sale, claimed depreciation is recaptured at up to 25%, and gains may owe capital-gains tax (a 1031 exchange can defer both). Figures are a year-1 estimate at your 24.0% rate — not tax advice; consult a CPA.
Schools (NCES district)
- District
- Southampton Union Free School District
- NCES district ID
- 3627540
- Math proficiency
- 53% ▬ 0.00%
- Reading proficiency
- 51% ▲ 4.00%
- Median HH income
- $85,977
- Composite
- 47.9/100
- National rank
- #2213
- State rank
- #293 of 590 in NY
Livability — Water Mill
- Score
- 71/100
- State rank
- #410
- US rank
- #7088
Category grades
Schools grade is shown separately in the Schools card above.
Census & demographics
- Census place
- Water Mill, NY
- County
- Suffolk County · 679,920 people
- City population
- 2,952
- Metro
- New York-Newark-Jersey City, NY-NJ-PA
- Population (ZIP)
- 2,952
- Household income
- $180,250
- Rent vs Own
Population outlook (Suffolk County) Hauer SSP2
- Today (2025)
- 1,505,262 people
- By 2030
- 1,498,318 · -0.5%
- By 2040
- 1,471,101 · -2.3%
- By 2050
- 1,424,848 · -5.3%
- By 2075
- 1,337,157 · -11.2%
- By 2100
- 1,217,720 · -19.1%
Race, ethnicity, and origin ACS 2023
- Neighborhood character
- Predominantly White (87%)
- Race & ethnicity
- White 87% Hispanic / Latino 9% Two or more races 9% Asian 2%
- Hispanic origin (detail)
- Mexican 1% Salvadoran 2%
- Common ancestry
- Romanian 16% Scotch-Irish 7% Italian 3%
- Foreign-born
- 11% · Canada, China
- Languages at home
- 86% English-only · Spanish 7% Other Indo-European 4% German/W. Germanic 1%
Political lean MEDSL · Suffolk
- 2024 margin
- Lean R (+10.0) · D 45.0% · R 55.0%
- 2008→2024 swing
- -16.0pp toward R · 2008: 6.0pp · 2024: -10.0pp
- All cycles
- 2024: R+10.0 2020: R+0.0 2016: R+8.2 2012: D+2.9 2008: D+6.0
Not yet ingested
- Civics
- —
Market trends
- HPI YoY
- ▲ 8.63%
- Current HPI
- 540.0967
- Rent YoY
- ▲ 30.05%
- Metro
- New York-Newark-Jersey City, NY-NJ-PA
- State GDP YoY
- ▲ 2.60%
- F500 in state
- 92
Industry mix (Fortune 500 HQ in NY)
| Industry | F500 HQs | Revenue |
|---|---|---|
| Financial Services | 10 | $950B |
|
||
| Consumer Goods | 9 | $162B |
|
||
| Insurance | 4 | $225B |
|
||
| Telecommunications | 2 | $144B |
|
||
| Pharmaceuticals | 2 | $112B |
|
||
| Media / Entertainment | 2 | $69B |
|
||
Price history
-24.9% since first listed9 events — show timeline
- 2025-11-19 Pending — OneKey® MLS as Distributed by MLS Grid
- 2025-10-08 Relisted — OneKey® MLS as Distributed by MLS Grid
- 2025-10-05 Listing Removed — OneKey® MLS as Distributed by MLS Grid
- 2025-09-22 Price Changed $2,100,000 OneKey® MLS as Distributed by MLS Grid
- 2025-09-10 Price Changed $2,250,000 OneKey® MLS as Distributed by MLS Grid
- 2025-08-28 Price Changed $2,345,000 OneKey® MLS as Distributed by MLS Grid
- 2025-08-08 Price Changed $2,445,000 OneKey® MLS as Distributed by MLS Grid
- 2025-06-25 Price Changed $2,495,000 OneKey® MLS as Distributed by MLS Grid
- 2025-06-12 Listed $2,795,000 OneKey® MLS as Distributed by MLS Grid
Property tax history
+2.1%/yrLatest (2022): $6,408 · +0.0% YoY. Source: county tax records.
Cash-flow waterfall
monthlySold comps — $/sqft
last 12 mo · ≤1 miLoading sold comps…