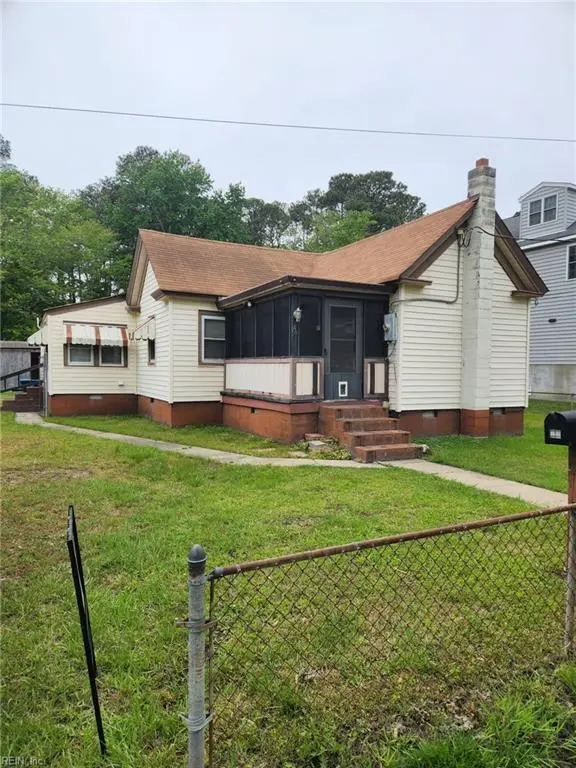
46 Langley St · Poquoson, VA
Flood risk 10/10 · Severe
- FEMA flood zone
- AE
- Chance of flooding over 30 yrs
- 0.99%
- Est. flood insurance / yr
- $1,737 – $8,500
Fire risk 2/10 · Minimal
- Est. fire insurance / yr
- $666 – $1,236
Heat risk 9/10 · Severe
- Hot days now (above 104°F)
- 7 days/yr
- Hot days in 30 yrs
- 17 days/yr
Wind risk 8/10 · Major
- Chance of severe wind over 30 yrs
- 80.0%
Air-quality risk 2/10 · Minimal
- Unhealthy air days now
- 2 days/yr
- Unhealthy air days in 30 yrs
- 2 days/yr
Risk factors via First Street. Map © Google.
Why this score? — see what drove the B+ grade
The composite is a weighted blend of 9 inputs, each scored 0–100. Each bar is that input's sub-score; the figure is the points it added to the 100-point composite (weight × sub-score).
- Cash flow +29.4/30.0
- ARV discount +15.0/15.0
- DSCR +10.0/10.0
- 1% rule +7.9/10.0
- Schools +7.5/10.0
- Livability +3.4/5.0
- Rent growth +2.5/5.0
- Condition / age +2.5/5.0
- Appreciation +0.0/10.0
$163,600
🖨 Deal sheet 📄 Offer letter ✓ Due diligence
Listing remarks MLS
SOLD STRICLY AS-IS, WHERE-IS
Key facts
- Built 1949
- Listed 5 days
Property features AI
Finance
- HOA & community: No HOA fees
Exterior
- Parking: Driveway spaces
- Utilities: City/County sewer; City/County water; Electric water heater; Natural gas heating available; Electric power
- Home design: Detached ranch; Single story; Simple ownership; Crawl foundation
- Construction: Wood siding; Asphalt shingle roof
- Exterior features: Deck; Chain link fence
Interior
- Kitchen: Electric range
- Bedrooms: Master bedroom; Additional bedroom; Bedroom and full bathroom on first floor
- Flooring: Carpet
- Bathrooms: 1 full bathroom
- Heating & cooling: Forced hot air (natural gas); Central air
- Interior features: Ceiling fan; Scuttle access
- Laundry & utility: Washer hookup; Dryer hookup; Utility room
Neighborhood map
What this means for you Summary
Snapshot
- This is a 2-bed/1.0-bath single-family listed at $164k.
Deal economics
- At list price, monthly cash flow is $153 ($2k/yr) — positive.
- The deal already cash-flows at list — no discount required.
- Meets the 1% rule at list price ($2k rent vs $164k).
- Cap rate 10.5% vs local median 2.7% in Poquoson — top-decile yield for the area; either an underpriced asset or a hidden risk that comps aren't pricing in. Stress-test before assuming the spread holds.
Location & tenants
- Location reads 68/100 on livability (#276 in VA) — a middle-class / working-renter tenant base. Strengths: employment A+, housing A+, crime B; Watch: amenities F, commute F, cost of living F.
- Poquoson City Public School District (suburban): math 78% / reading 91% proficiency, ranked #2 of 131 in VA (top 2%) — strong family-tenant draw, lease renewals of 3-5y typical; only 12% free/reduced lunch — higher-income household profile.
- Zoned schools: Poquoson Elementary (math 81% / reading 92%, grade A+, #47 of 1,108 statewide, top 5%, 444 students, 21% FRL); Poquoson High (math 67% / reading 92%, grade A-, #63 of 319 statewide, top 22%, 690 students, 19% FRL).
- Market conditions: 160 active listings in the ZIP; 1 comparable units currently listed for rent nearby; high-income renter base; 133 units permitted in Poquoson city in 2024 (36 in 5+ unit buildings).
Forward outlook
- Local home prices are declining (-3.0%/yr); year-one equity from $1k of loan paydown is wiped out by about $5k of value loss. Plan a longer hold.
- Poquoson County population projected at +4% by 2050 — modest demand growth; plan on rents tracking national, not racing it.
Negotiation context
- Only 5 days on market — expect competitive offers; lowballing is unlikely to land.
- 2 sale attempts with the ask held roughly flat each time — persistent listings suggest the price (not the market) is what's stuck; bring a comps-based counter.
Risks & watch-outs
- Watch-outs: flood insurance adds $427/mo; built in 1949 — expect roof / HVAC / electrical / plumbing capex.
- Climate carrying-cost: in FEMA flood zone AE (mandatory federal flood insurance); severe wind risk, 80% chance of damaging wind over 30y; extreme-heat days projected 7→17/yr by 2055 (HVAC capex compounding) — expect insurance premiums to compound above CPI over the hold.
Questions for the listing agent
- Built in 1949 — when were the roof, HVAC, electrical panel, plumbing, and water heater last replaced?
- What's the actual annual flood-insurance premium (NFIP or private), and is the property in a SFHA with mandatory coverage?
- Is there a deadline driving the sale (1031 exchange, divorce, estate, relocation)? That informs how much negotiation room exists.
- Schools are A-rated — typically a magnet for longer-tenancy family renters. What's the average tenant stay here, and is there a school-zone premium baked into asking?
- What's the average days-on-market for RENTAL listings here right now (not sales)? A rising rental-DOM trend means longer vacancies and softer asking-rent achievability than the comps imply.
- What's the recent tenant-quality profile in this submarket — average credit score on applications, eviction rate, late-payment / NSF rate, and stable-employment percentage? A property-management company in the area should have these aggregated.
- How much new for-sale + rental construction is in the pipeline within 1–3 miles? Heavy new supply typically softens prices + rents 12–24 months out; constrained supply supports both.
Investment metrics
- 1% rule
- 1.29% ✓
- Cap rate
- 10.54%
- Cash-on-cash
- 15.18%
- DSCR
- 1.68
- GRM
- 6.4
CMA / ARV
- ARV (median comp)
- $305,835
- List price
- $163,600
- Delta
- -46.51%
- Verdict
- UNDERPRICED
- Comps
- 4 within 1.0 mi
Show comp detail 2 sales within ~0.75 mi
| Address | Dist | Beds/Ba | Sqft | Sold | Price | $/sf | Match |
|---|---|---|---|---|---|---|---|
| 46 Langley St | 0.00mi | 2/1.0 | 920 (0%) | 1mo | $163,600 | $178 | 99 |
| 4 Freeman Dr | 0.67mi | 3/1.0 (+1) | 1,008 (+10%) | 12mo | $288,900 | $287 | 38 |
Match score weights: distance 35% · size 25% · config 20% · recency 20%. Top-matched comps best support the ARV.
Projected returns pro-forma
-3.0% appreciation · 3.0% rent growth · sell at horizon
- IRR
- -9.8%
- Equity multiple
- 0.64×
- Total profit
- $-16,488
- Equity at exit
- $24,393
- IRR
- -0.2%
- Equity multiple
- 0.98×
- Total profit
- $-705
- Equity at exit
- $14,145
Cash invested: $45,808 (down + closing). Projections, not guarantees.
Landlord ↔ Tenant lean methodology
- Overall (STATE)
- 55 Moderately Landlord-Leaning
- State Virginia
- 55 Moderately Landlord-Leaning · D+2
- County
- — inherits STATE
- City
- — inherits STATE
ZIP-level market 23662
- Active inventory
- 160
- Price-to-rent
- 6.4×
Monthly cashflow live
- Estimated rent
- $2,114 medium interval (Pro) →
- Mortgage (P&I)
- −$858
- Tax from tax record
- −$165 /mo · $1,976/yr
- Insurance
- −$68
- Flood insurance flood zone
- −$427 /mo · $5,118/yr
- HOA
- −$0
- Vacancy / Maint / Mgmt
- −$444
- Net cashflow
- $153
Break-even live
UW: 25.0% down · 7.5% · 30yr · 1.5% tax · 5.0% vac · 8.0% maint · 8.0% mgmt
Financing live
Cash to close
- Down payment
- $40,900
- Closing costs
- $4,908
- Reserves months
- —
- Total cash needed
- —
Loan-product check · same deal, 3 products live
Conventional
25% down · 7.5% · 30yr
- Down + closing
- —
- Monthly P&I
- —
- Monthly cashflow
- —
- DSCR
- —
- Eligible?
- —
Personal DTI + credit; lowest rate.
DSCR
20% down · 8.5% · 30yr
- Down + closing
- —
- Monthly P&I
- —
- Monthly cashflow
- —
- DSCR
- —
- Eligible?
- —
No personal income docs; deal must DSCR.
Hard money
10% down · 12.0% · 12mo
- Down + closing
- —
- Monthly P&I
- —
- Monthly cashflow
- —
- DSCR
- —
- Eligible?
- —
Short-term bridge; refi at stabilization.
Rent comps 1 comps
| Address | Beds | Baths | Sqft | Rent | $/sqft | DOM | Units | Dist |
|---|---|---|---|---|---|---|---|---|
| 414 Joseph Topping Dr Poquoson, VA | 1.0 | 1.0 | 1000 | $2,500 | $2.50 | 21d | 1 | 1.45mi |
Listing history 4 events
-
2026-05-05status Under Contract 28-char remark
Show marketing remark (28 chars)
SOLD STRICLY AS-IS, WHERE-IS
-
2026-05-05status Pending 28-char remark
Show marketing remark (28 chars)
SOLD STRICLY AS-IS, WHERE-IS
-
2026-04-29$163,600 Active 28-char remark
Show marketing remark (28 chars)
SOLD STRICLY AS-IS, WHERE-IS
-
2026-04-29$136,800 Active 28-char remark
Show marketing remark (28 chars)
SOLD STRICLY AS-IS, WHERE-IS
ⓘ Source: listings_history table (triggers on properties + properties_extension) + one-shot
backfill from property_details.listing_events for pre-trigger history.
Tax reassessment forecast VA · Resets to sale price
- Current annual tax
- $1,976 · $165/mo
- Projected year-2 tax
- $1,976 · $165/mo
- Expected delta
- $0/yr ($0/mo · 0.0%)
ⓘ Screening estimate from a state-policy table — verify with the county assessor before closing.
Climate risk First Street
- Flood 10/10 Extreme FEMA zone AE · 99% chance over 30 yrs
- Wildfire 2/10 Low
- Heat 9/10 Extreme 7 d/yr ≥104°F today · 17 d/yr by 30 yrs out
- Wind 8/10 Severe 80% chance of damaging wind over 30 yrs
- Air quality 2/10 Low 2 unhealthy d/yr today · 2 by 30 yrs out
Nearby sold comps map
Loading sold comps map…
Walkable amenities ~0.75 mi
Loading nearby amenities…
Taxation est. · year 1
- Rental income
- $25,373
- − Mortgage interest
- −$9,164
- − Property taxes
- −$1,976
- − Insurance
- −$5,936
- − Repairs & maintenance
- −$2,030
- − Management
- −$2,030
- − Depreciation
- −$4,759
- Taxable loss
- −$522
- Est. tax savings @ 24.0%
- +$125
- After-tax cash flow
- $1,963/yr
For passive investors: Depreciation is non-cash, so a rental often shows a tax loss while cash-flowing — sheltering income. Rental losses are passive: they offset passive income freely, and up to $25,000/yr can offset ordinary (W-2) income if you actively participate and your MAGI is under $100k (phasing out to $0 by $150k); unused losses carry forward. On sale, claimed depreciation is recaptured at up to 25%, and gains may owe capital-gains tax (a 1031 exchange can defer both). Figures are a year-1 estimate at your 24.0% rate — not tax advice; consult a CPA.
Schools (NCES district)
- District
- Poquoson City Public School District
- NCES district ID
- 5102980
- Math proficiency
- 78% ▼ -14.00%
- Reading proficiency
- 91% ▬ 0.00%
- Median HH income
- $83,895
- Composite
- 74.58/100
- National rank
- #154
- State rank
- #2 of 131 in VA
Livability — Poquoson
- Score
- 68/100
- State rank
- #276
- US rank
- #9903
Category grades
Schools grade is shown separately in the Schools card above.
Census & demographics
- Census place
- Poquoson, VA
- County
- Poquoson City · 12,639 people
- City population
- 12,639
- Metro
- Virginia Beach-Norfolk-Newport News, VA-NC
- Population (ZIP)
- 12,639
- Household income
- $120,972
- Rent vs Own
- Severe rent burden
- 89.0
Population outlook (Poquoson County) Hauer SSP2
- Today (2025)
- 12,348 people
- By 2030
- 12,611 · +2.1%
- By 2040
- 12,894 · +4.4%
- By 2050
- 12,779 · +3.5%
- By 2075
- 13,020 · +5.4%
- By 2100
- 11,925 · -3.4%
Race, ethnicity, and origin ACS 2023
- Neighborhood character
- Predominantly White (89%)
- Race & ethnicity
- White 89% Hispanic / Latino 4% Two or more races 4% Asian 2% Black 2%
- Common ancestry
- Italian 6% Romanian 3% Slovak 2%
- Foreign-born
- 4% · Canada
- Languages at home
- 96% English-only · Spanish 1% Other Indo-European 1% Other Asian/Pacific 1%
Political lean MEDSL · Poquoson
- 2024 margin
- Solid R (+45.9) · D 26.4% · R 72.3% · Other 1.3%
- 2008→2024 swing
- +3.4pp toward D · 2008: -49.3pp · 2024: -45.9pp
- All cycles
- 2024: R+45.9 2020: R+45.2 2016: R+49.1 2012: R+51.2 2008: R+49.3
Not yet ingested
- Civics
- —
Market trends
- HPI YoY
- ▼ -275.55%
- Current HPI
- 267.5479
- Rent YoY
- —
- Metro
- Virginia Beach-Norfolk-Newport News, VA-NC
- State GDP YoY
- ▲ 2.40%
- F500 in state
- 50
Industry mix (Fortune 500 HQ in VA)
| Industry | F500 HQs | Revenue |
|---|---|---|
| Aerospace / Defense | 4 | $236B |
|
||
| Technology / Defense | 3 | $32B |
|
||
| Financial Services | 2 | $176B |
|
||
| Utilities | 2 | $27B |
|
||
| Insurance | 2 | $25B |
|
||
| Technology | 2 | $15B |
|
||
Price history
+19.6% since first listed7 events — show timeline
- 2026-05-28 Sold (Public Records) $163,600 Public Records
- 2026-05-27 Sold (MLS) $163,600 REINMLS
- 2026-05-27 Sold (MLS) $163,600 WMLS
- 2026-05-05 Pending — REINMLS
- 2026-05-05 Pending — WMLS
- 2026-04-29 Listed $163,600 REINMLS
- 2026-04-29 Listed $136,800 WMLS
Property tax history
+7.3%/yrLatest (2025): $1,976 · +26.7% YoY. Source: county tax records.
Cash-flow waterfall
monthlySold comps — $/sqft
last 12 mo · ≤1 miLoading sold comps…