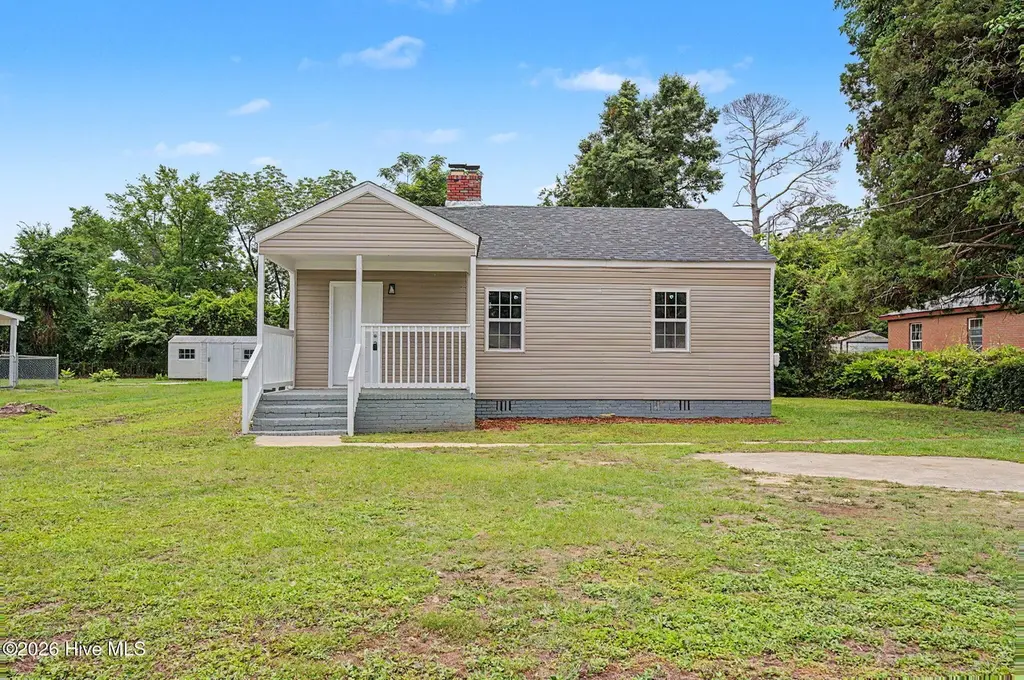
2020 Shirley Ave · Augusta-Richmond County consolidated government (balance), GA
Flood risk 1/10 · Minimal
- FEMA flood zone
- X (unshaded)
- Chance of flooding over 30 yrs
- 0.0%
- Est. flood insurance / yr
- $507 – $1,088
Fire risk 1/10 · Minimal
- Est. fire insurance / yr
- $963 – $1,789
Heat risk 8/10 · Major
- Hot days now (above 108°F)
- 7 days/yr
- Hot days in 30 yrs
- 17 days/yr
Wind risk 6/10 · Moderate
- Chance of severe wind over 30 yrs
- 66.0%
Air-quality risk 4/10 · Minor
- Unhealthy air days now
- 4 days/yr
- Unhealthy air days in 30 yrs
- 4 days/yr
Risk factors via First Street. Map © Google.
Why this score? — see what drove the D- grade
The composite is a weighted blend of 9 inputs, each scored 0–100. Each bar is that input's sub-score; the figure is the points it added to the 100-point composite (weight × sub-score).
- Cash flow +14.5/30.0
- ARV discount +7.7/15.0
- DSCR +4.4/10.0
- Rent growth +3.6/5.0
- 1% rule +3.1/10.0
- Livability +2.5/5.0
- Condition / age +2.5/5.0
- Schools +1.3/10.0
- Appreciation +0.0/10.0
$155,000
🖨 Deal sheet (PDF) 📄 Offer letter ✓ Due diligence
Listing remarks MLS
Located in the heart of Augusta, 2020 Shirley Ave offers incredible potential for those with a vision. This home needs a little TLC but provides a solid foundation to create something special. Enjoy prime proximity to Augusta's Medical District, Downtown Augusta, and local universities. This property is being sold AS IS.
Key facts
- Remodeled
- Updated finishes
- Renovated bathrooms
Tags
Property features AI
Exterior
- Parking: Unpaved parking
- Utilities: Public water; Public sewer; Sewer and water connected
- Home design: Single-family residence; One story; Entry level: 1
- Construction: Vinyl siding; Composition roof; See remarks for additional construction details
- Exterior features: Front porch; Rectangular lot; Has a view
Interior
- Kitchen: Refrigerator; Range; Dishwasher
- Bedrooms: Total of 5 rooms (includes bedrooms and living spaces)
- Bathrooms: 2 full bathrooms
- Heating & cooling: Central air; Ceiling fans; Electric forced-air heating
- Interior features: Eat-in kitchen; Crawl space basement (no finished basement)
- Laundry & utility: Washer hookup; Electric water heater
Neighborhood map
What this means for you Summary
Snapshot
- This is a 2-bed/1.0-bath single-family listed at $155k.
Deal economics
- At list price, monthly cash flow is $34 ($409/yr) — positive.
- The deal already cash-flows at list — no discount required.
- To meet the 1% rule (rent ≥ 1% of price), the offer needs to be $126k (18.5% below list).
- Recommended offer: $126k (18.5% below list) — sets the bar for 1% rule.
- Cap rate 6.6% vs local median 5.3% in Augusta-Richmond County consolidated government (balance) — meaningfully above typical; check what's discounted (condition, days-on-market, listing class) to confirm the premium yield is real.
Location & tenants
- Location reads: area grade D — affects rentability + tenant quality, not the cash-flow math above.
- Richmond County (urban): math 12% / reading 20% proficiency, ranked #154 of 174 in GA (top 88%) — low school quality limits family demand, transient renter base, plan for 1-2y turnover; 72% free/reduced lunch — lower-income household profile, screen leases tightly.
- Zoned schools: Wilkinson Gardens Elementary School (math 2% / reading 8%, grade F, #1,160 of 1,228 statewide, top 98%, 466 students, 98% FRL); Murphey Middle School (math 0% / reading 6%, grade F, #469 of 470 statewide, top 100%, 635 students, 98% FRL); Josey High School (math 2% / reading 5%, grade F, #413 of 424 statewide, top 99%, 779 students, 98% FRL) — zoned schools average 98% FRL vs 72% district-wide (26 pts higher); higher-poverty schools than district average — tighter screening recommended.
- Zoned-school proficiency averages 4% at this address vs 16% district-wide (-12 pts) — the specific schools serving this property underperform the Richmond County average; the district grade overstates school quality for this exact location.
- Market conditions: Rents rising fast (+4.3%/yr); 228 active listings in the ZIP; 40 comparable units currently listed for rent nearby; rentals lingering (median 46d on market — plan ~5-8 weeks vacancy on turnover, expect pricing pressure); 58% of comp listings sitting > 30 days — soft ceiling on asking rent; 561 units permitted in Richmond County in 2024 (0 in 5+ unit buildings).
Forward outlook
- Local home prices are declining (-3.0%/yr); year-one equity from $1k of loan paydown is wiped out by about $5k of value loss. Plan a longer hold.
- Richmond County population projected to shrink 5% by 2050 — rents likely to lag national; underwrite the cash flow, not the appreciation.
Negotiation context
- It's been on market 23 days — a 2% lower offer ($153k) is reasonable based on typical stale-listing flexibility.
- 6 sale attempts since 4y ago with the ask held roughly flat each time — persistent listings suggest the price (not the market) is what's stuck; bring a comps-based counter.
- Current owner paid $63k; list at $155k implies a 146% gain — meaningful room to come down on a strong offer.
Risks & watch-outs
- Watch-outs: built in 1941 — expect roof / HVAC / electrical / plumbing capex.
- Climate carrying-cost: major wind risk, 66% chance of damaging wind over 30y; extreme-heat days projected 7→17/yr by 2055 (HVAC capex compounding) — expect insurance premiums to compound above CPI over the hold.
Questions for the listing agent
- Built in 1941 — when were the roof, HVAC, electrical panel, plumbing, and water heater last replaced?
- Is there a deadline driving the sale (1031 exchange, divorce, estate, relocation)? That informs how much negotiation room exists.
- The area grade is low — what's the realistic commute time and amenity access for the typical tenant pool here? Any planned neighborhood developments (good or bad) we should know about?
- What's the average days-on-market for RENTAL listings here right now (not sales)? A rising rental-DOM trend means longer vacancies and softer asking-rent achievability than the comps imply.
- What's the recent tenant-quality profile in this submarket — average credit score on applications, eviction rate, late-payment / NSF rate, and stable-employment percentage? A property-management company in the area should have these aggregated.
- How much new for-sale + rental construction is in the pipeline within 1–3 miles? Heavy new supply typically softens prices + rents 12–24 months out; constrained supply supports both.
Investment metrics
- 1% rule
- 0.81% ✗
- Cap rate
- 6.56%
- Cash-on-cash
- 0.94%
- DSCR
- 1.04
- GRM
- 10.2
CMA / ARV
- ARV (on-the-fly)
- $155,584
- Comps found
- 12
Show comp detail 12 sales within ~0.75 mi
| Address | Dist | Beds/Ba | Sqft | Sold | Price | $/sf | Match |
|---|---|---|---|---|---|---|---|
| 2020 Shirley Ave | 0.00mi | 3/2.0 (+1) | 1,144 (0%) | 7mo | $63,000 | $55 | 85 |
| 1765 Kissingbower Rd | 0.64mi | 2/1.0 | 1,140 (-0%) | 4mo | $155,000 | $136 | 66 |
| 1915 Olive Rd | 0.50mi | 2/1.0 | 1,099 (-4%) | 5mo | $42,500 | $39 | 66 |
| 2048 Wharton Dr | 0.26mi | 3/1.0 (+1) | 1,050 (-8%) | 5mo | $124,500 | $119 | 65 |
| 1752 Pine Tree Rd | 0.44mi | 2/1.5 | 1,218 (+6%) | 2mo | $213,000 | $175 | 65 |
| 1738 Kissingbower Rd | 0.61mi | 2/2.0 | 1,149 (+0%) | 7mo | $205,000 | $178 | 61 |
| 2004 Roosevelt Dr | 0.15mi | 3/1.0 (+1) | 984 (-14%) | 6mo | $51,000 | $52 | 59 |
| 2031 Wharton Dr | 0.22mi | 3/2.0 (+1) | 1,313 (+15%) | 4mo | $85,000 | $65 | 53 |
| 1703 Holly Hill Rd | 0.66mi | 3/1.0 (+1) | 1,228 (+7%) | 3mo | $203,900 | $166 | 50 |
| 2608 Polo Ct | 0.70mi | 3/2.0 (+1) | 1,221 (+7%) | 8mo | $215,000 | $176 | 41 |
| 1736 Kissingbower Rd | 0.62mi | 2/2.0 | 992 (-13%) | 6mo | $212,000 | $214 | 40 |
| 1723 Douglas St | 0.71mi | 3/1.0 (+1) | 1,000 (-13%) | 4mo | $100,000 | $100 | 37 |
Match score weights: distance 35% · size 25% · config 20% · recency 20%. Top-matched comps best support the ARV.
Projected returns pro-forma
-3.0% appreciation · 4.29% rent growth · sell at horizon
- IRR
- -13.5%
- Equity multiple
- 0.51×
- Total profit
- $-21,332
- Equity at exit
- $23,111
- IRR
- -2.9%
- Equity multiple
- 0.79×
- Total profit
- $-8,978
- Equity at exit
- $13,402
Cash invested: $43,400 (down + closing). Projections, not guarantees.
Landlord ↔ Tenant lean methodology
- Overall (STATE)
- 90 Strongly Landlord-Friendly
- State Georgia
- 90 Strongly Landlord-Friendly · R+3
- County
- — inherits STATE
- City
- — inherits STATE
ZIP-level market 30904
- Rents YoY
- 4.3%
- Active inventory
- 228
- Price-to-rent
- 10.2×
Monthly cashflow live
- Estimated rent
- $1,263 high interval (Pro) →
- Mortgage (P&I)
- −$813
- Tax from tax record
- −$86 /mo · $1,033/yr
- Insurance
- −$65
- HOA
- −$0
- Vacancy / Maint / Mgmt
- −$265
- Net cashflow
- $34
Break-even live
Sensitivity live
| Price | -10% $122 | -5% $78 | +0% $34 | +5% $-10 | +10% $-54 |
|---|---|---|---|---|---|
| Rent | -10% $-66 | -5% $-16 | +0% $34 | +5% $84 | +10% $134 |
| Rate | -1.0pp $112 | -0.5pp $74 | base $34 | +0.5pp $-6 | +1.0pp $-47 |
UW: 25.0% down · 7.5% · 30yr · 1.5% tax · 5.0% vac · 8.0% maint · 8.0% mgmt
Financing live
Cash to close
- Down payment
- $38,750
- Closing costs
- $4,650
- Reserves months
- —
- Total cash needed
- —
Loan-product check · same deal, 3 products live
Conventional
25% down · 7.5% · 30yr
- Down + closing
- —
- Monthly P&I
- —
- Monthly cashflow
- —
- DSCR
- —
- Eligible?
- —
Personal DTI + credit; lowest rate.
DSCR
20% down · 8.5% · 30yr
- Down + closing
- —
- Monthly P&I
- —
- Monthly cashflow
- —
- DSCR
- —
- Eligible?
- —
No personal income docs; deal must DSCR.
Hard money
10% down · 12.0% · 12mo
- Down + closing
- —
- Monthly P&I
- —
- Monthly cashflow
- —
- DSCR
- —
- Eligible?
- —
Short-term bridge; refi at stabilization.
Rent comps 40 comps
| Address | Beds | Baths | Sqft | Rent | $/sqft | DOM | Units | Dist |
|---|---|---|---|---|---|---|---|---|
| 2125 Kennedy Dr Augusta, GA | 2.0 | 1.0 | 750 | $795 | $1.06 | 15d | 1 | 0.29mi |
| 2128 Roosevelt Dr Augusta, GA | 3.0 | 2.0 | 1050 | $1,340 | $1.28 | 25d | 1 | 0.29mi |
| 1610 Cornell Dr Augusta, GA | 3.0 | 1.0 | 1025 | $1,100 | $1.07 | 45d | 1 | 0.35mi |
| 1610 Cornell Dr Augusta, GA | 3.0 | 1.0 | 1025 | $1,100 | $1.07 | 25d | 1 | 0.35mi |
| 1914 1/2 Kratha Dr Augusta, GA | 2.0 | 1.0 | 1400 | $995 | $0.71 | 15d | 1 | 0.46mi |
| 1750 Essie McIntyre Blvd Augusta, GA | 2.0 | 1.0 | 720 | $950 | $1.32 | 45d | 1 | 0.53mi |
| 2726 Landing Loop Dr Augusta, GA | 3.0 | 2.0 | 1008 | $1,025 | $1.02 | 46d | 1 | 0.55mi |
| 2230 Hollis Rd Augusta, GA | 2.0 | 1.0 | 1000 | $975 | $0.97 | 45d | 1 | 0.60mi |
| 1712 Kissingbower Rd Augusta, GA | 2.0 | 1.0 | 1072 | $1,400 | $1.31 | 15d | 1 | 0.66mi |
| 1719 Kissingbower Rd Augusta, GA | 2.0 | 1.0 | 1185 | $1,195 | $1.01 | 23d | 1 | 0.69mi |
| 2201 Walden Dr Unit DRIVEA2 Augusta, GA | 2.0 | 1.5 | 1063 | $1,050 | $0.99 | 45d | 1 | 0.69mi |
| 2201 Walden Dr Unit DRIVEB2 Augusta, GA | 2.0 | 1.5 | 1063 | $1,100 | $1.03 | 45d | 1 | 0.69mi |
| 2201 Walden Dr Augusta, GA | 2.0 | 1.0 | 1063 | $1,100 | $1.03 | 45d | 1 | 0.69mi |
| 1712 Morgan St Augusta, GA | 3.0 | 1.0 | 1209 | $1,330 | $1.10 | 25d | 1 | 0.70mi |
| 1508 Heard Ave Augusta, GA | 3.0 | 2.0 | 1314 | $1,400 | $1.07 | 45d | 1 | 0.77mi |
| 1509 Troupe St Augusta, GA | 3.0 | 2.0 | 1200 | $1,695 | $1.41 | 15d | 1 | 0.77mi |
| 1613 Pendleton Rd Augusta, GA | 3.0 | 2.0 | 1418 | $1,695 | $1.20 | 15d | 1 | 0.81mi |
| 2219 Walden Dr Unit A6 Augusta, GA | 2.0 | 1.0 | 800 | $850 | $1.06 | 25d | 1 | 0.83mi |
| 1506 Pendleton Rd Augusta, GA | 2.0 | 1.0 | 1026 | $1,300 | $1.27 | 45d | 1 | 0.86mi |
| 1506 Pendleton Rd Augusta, GA | 2.0 | 1.0 | 1026 | $1,300 | $1.27 | 25d | 1 | 0.86mi |
| 1432 Heard Ave Augusta, GA | 3.0 | 2.0 | 1278 | $1,500 | $1.17 | 45d | 1 | 0.91mi |
| 2219 Archer Augusta, GA | 2.0 | 2.0 | 1103 | $1,495 | $1.36 | 45d | 1 | 0.93mi |
| 2221 Archer LN Augusta, GA | 2.0 | 2.0 | 1103 | $1,495 | $1.36 | 45d | 1 | 0.94mi |
| 2128 Grand Blvd Augusta, GA | 3.0 | 1.0 | 1150 | $1,150 | $1.00 | 45d | 1 | 0.95mi |
| 2240 Walden Dr Augusta, GA | 3.0 | 2.0 | 1107 | $1,495 | $1.35 | 25d | 1 | 0.98mi |
| 2730 Lakewood Dr Augusta, GA | 3.0 | 1.5 | 1460 | $1,550 | $1.06 | 25d | 1 | 0.99mi |
| 2730 Lakewood Dr Augusta, GA | 3.0 | 1.5 | 1460 | $1,550 | $1.06 | 45d | 1 | 0.99mi |
| 1940 Haynie Dr Unit 2 Augusta, GA | 1.0 | 1.0 | 840 | $850 | $1.01 | 25d | 1 | 0.99mi |
| 1940 Haynie Dr Unit Main Augusta, GA | 3.0 | 1.5 | 840 | $1,500 | $1.79 | 25d | 1 | 0.99mi |
| 1940 Haynie Dr Unit Main Augusta, GA | 3.0 | 1.5 | 840 | $1,500 | $1.79 | 45d | 1 | 0.99mi |
| 2120 Whitney South Dr Augusta, GA | 2.0 | 2.0 | 1118 | $1,500 | $1.34 | 46d | 1 | 1.01mi |
| 2120 Whitney South Dr Augusta, GA | 2.0 | 2.0 | 1118 | $1,500 | $1.34 | 45d | 1 | 1.01mi |
| 19 Trapp Ct Unit 19 Augusta, GA | 2.0 | 1.5 | 1050 | $995 | $0.95 | 45d | 1 | 1.02mi |
| 2031 Wrightsboro Rd Augusta, GA | 2.0 | 2.0 | 1240 | $1,750 | $1.41 | 45d | 1 | 1.04mi |
| 2020 Garr Dr Augusta, GA | 3.0 | 1.0 | 1100 | $1,200 | $1.09 | 15d | 1 | 1.06mi |
| 1328 Baker Ave Augusta, GA | 2.0 | 1.0 | 761 | $975 | $1.28 | 45d | 1 | 1.09mi |
| 1912 Richmond Ave Unit 1912 Augusta, GA | 2.0 | 1.0 | 812 | $1,195 | $1.47 | 15d | 1 | 1.09mi |
| 1545 Heath St Unit B Augusta, GA | 2.0 | 1.0 | 832 | $650 | $0.78 | 45d | 1 | 1.13mi |
| 1545 Heath St Augusta, GA | 2.0 | 1.0 | 832 | $650 | $0.78 | 46d | 1 | 1.13mi |
| 1313 Wilson St Apt C Augusta, GA | 2.0 | 2.0 | 900 | $1,350 | $1.50 | 45d | 1 | 1.14mi |
Listing history 16 events
-
2026-06-21days on market $155,000 Active 23 DOM
-
2026-06-18days on market $155,000 Active 20 DOM
-
2026-06-17days on market $155,000 Active 19 DOM
-
2026-06-16days on market $155,000 Active 18 DOM
-
2026-06-15days on market $155,000 Active 17 DOM
-
2026-06-14days on market $155,000 Active 15 DOM
-
2026-06-10days on market $155,000 Active 12 DOM
-
2026-06-09days on market $155,000 Active 11 DOM
-
2026-06-08days on market $155,000 Active 10 DOM
-
2026-06-07days on market $155,000 Active 9 DOM
-
2026-06-03days on market $155,000 Active 5 DOM
-
2026-06-02days on market $155,000 Active 4 DOM
-
2026-06-01days on market $155,000 Active 3 DOM
-
2026-05-31days on market $155,000 Active 2 DOM
-
2026-05-30remarks 699-char remark
-
2026-05-30$155,000 Active 1 DOM
ⓘ Source: listings_history table (triggers on properties + properties_extension) + one-shot
backfill from property_details.listing_events for pre-trigger history.
Tax reassessment forecast GA · Resets to sale price
- Current annual tax
- $1,033 · $86/mo
- Projected year-2 tax
- $1,426 · $119/mo
- Expected delta
- +$393/yr (+$33/mo · 38.1%)
ⓘ Screening estimate from a state-policy table — verify with the county assessor before closing.
Climate risk First Street
- Flood 1/10 Low FEMA zone X (unshaded) · 0% chance over 30 yrs
- Wildfire 1/10 Low
- Heat 8/10 Severe 7 d/yr ≥108°F today · 17 d/yr by 30 yrs out
- Wind 6/10 Major 66% chance of damaging wind over 30 yrs
- Air quality 4/10 Moderate 4 unhealthy d/yr today · 4 by 30 yrs out
Nearby sold comps map
Loading sold comps map…
Walkable amenities ~0.75 mi
Loading nearby amenities…
Taxation est. · year 1
- Rental income
- $15,153
- − Mortgage interest
- −$8,682
- − Property taxes
- −$1,033
- − Insurance
- −$775
- − Repairs & maintenance
- −$1,212
- − Management
- −$1,212
- − Depreciation
- −$4,509
- Taxable loss
- −$2,271
- Est. tax savings @ 24.0%
- +$545
- After-tax cash flow
- $954/yr
For passive investors: Depreciation is non-cash, so a rental often shows a tax loss while cash-flowing — sheltering income. Rental losses are passive: they offset passive income freely, and up to $25,000/yr can offset ordinary (W-2) income if you actively participate and your MAGI is under $100k (phasing out to $0 by $150k); unused losses carry forward. On sale, claimed depreciation is recaptured at up to 25%, and gains may owe capital-gains tax (a 1031 exchange can defer both). Figures are a year-1 estimate at your 24.0% rate — not tax advice; consult a CPA.
Schools (NCES district)
- District
- Richmond County
- NCES district ID
- 1304380
- Math proficiency
- 12% ▼ -9.00%
- Reading proficiency
- 20% ▼ -6.00%
- Median HH income
- $38,069
- Composite
- 13.43/100
- National rank
- #9524
- State rank
- #154 of 174 in GA
Livability — Augusta-Richmond County consolidated government (balance)
No livability data for this city. (Only ~50 U.S. cities are tracked.)
Census & demographics
- Census place
- Augusta-Richmond County consolidated government (balance), GA
- County
- Richmond County · 190,917 people
- City population
- 154,035
- Metro
- Augusta-Richmond County, GA-SC
- Population (ZIP)
- 23,400
- Household income
- $46,696
- Rent vs Own
- Severe rent burden
- 1594.0
Population outlook (Richmond County) Hauer SSP2
- Today (2025)
- 200,753 people
- By 2030
- 200,232 · -0.3%
- By 2040
- 196,813 · -2.0%
- By 2050
- 190,347 · -5.2%
- By 2075
- 172,496 · -14.1%
- By 2100
- 146,284 · -27.1%
Race, ethnicity, and origin ACS 2023
- Neighborhood character
- Diverse neighborhood (Simpson 0.61)
- Race & ethnicity
- Black 47% White 41% Hispanic / Latino 6% Two or more races 6% Asian 2%
- Hispanic origin (detail)
- Mexican 1%
- Common ancestry
- Italian 1% Slovak 1% Romanian 1%
- Foreign-born
- 3% · Canada, South Korea, Jamaica
- Languages at home
- 93% English-only · Spanish 4% Korean 1%
Political lean MEDSL · Richmond
- 2024 margin
- Solid D (+36.1) · D 67.8% · R 31.7%
- 2008→2024 swing
- +4.3pp toward D · 2008: 31.8pp · 2024: 36.1pp
- All cycles
- 2024: D+36.1 2020: D+37.2 2016: D+32.4 2012: D+33.8 2008: D+31.8
Not yet ingested
- Civics
- —
Market trends
- HPI YoY
- ▼ -211.97%
- Current HPI
- 199.0807
- Rent YoY
- ▲ 4.29%
- Metro
- Augusta-Richmond County, GA-SC
- State GDP YoY
- ▲ 2.66%
- F500 in state
- 28
Industry mix (Fortune 500 HQ in GA)
| Industry | F500 HQs | Revenue |
|---|---|---|
| Paper / Packaging | 2 | $29B |
|
||
| Retail | 1 | $160B |
|
||
| Transportation / Logistics | 1 | $91B |
|
||
| Airlines | 1 | $62B |
|
||
| Consumer Goods | 1 | $47B |
|
||
| Utilities | 1 | $25B |
|
||
Price history
+1376.2% since first listed15 events — show timeline
- 2026-05-29 Listed $155,000 Hive MLS
- 2026-01-29 Sold (Public Records) $63,000 Public Records
- 2025-11-18 Sold (MLS) $63,000 Hive MLS
- 2025-11-18 Sold (MLS) $63,000 Hive MLS
- 2025-08-11 Listed $69,500 Hive MLS
- 2025-08-11 Listed $69,500 Hive MLS
- 2023-05-03 Sold (Public Records) $55,000 Public Records
- 2023-05-03 Sold (MLS) $55,000 Hive MLS
- 2023-05-03 Sold (MLS) $55,000 Hive MLS
- 2023-05-03 Sold (MLS) $55,000 AMLS
- 2023-01-05 Delisted — AMLS
- 2022-10-26 Listed $65,000 Hive MLS
- 2022-10-26 Listed $65,000 Hive MLS
- 2022-10-26 Listed $65,000 AMLS
- 1975-08-01 Sold (Public Records) $10,500 Public Records
Property tax history
+2.1%/yrLatest (2025): $1,033 · +8.1% YoY. Source: county tax records.
Cash-flow waterfall
monthlySold comps — $/sqft
last 12 mo · ≤1 miLoading sold comps…