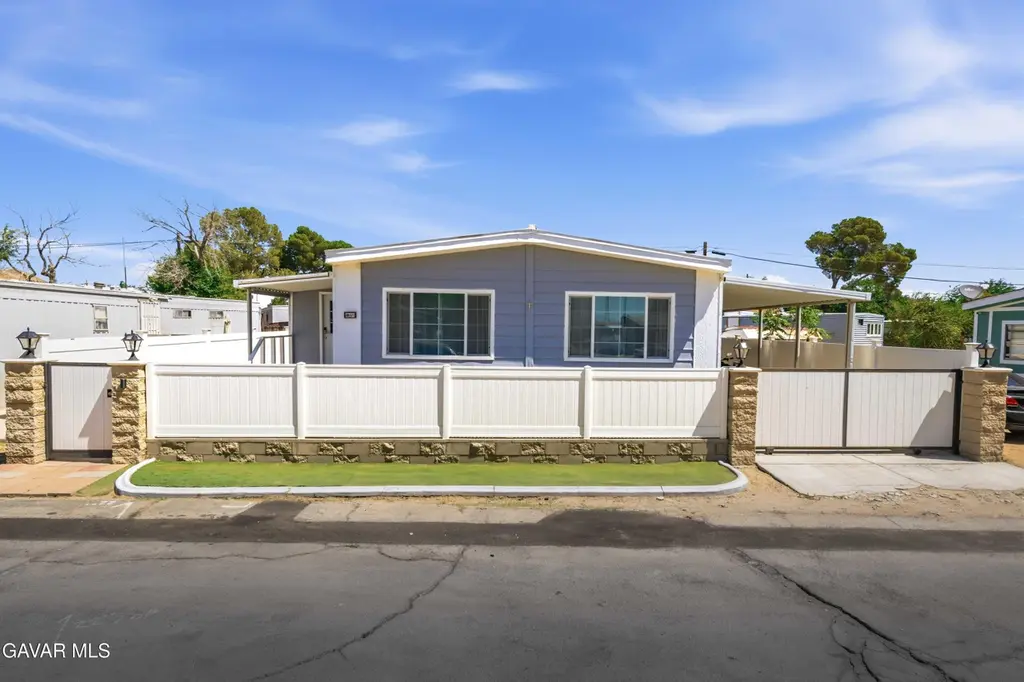
1258 W Rosamond Blvd Spc 68 · Rosamond, CA
Flood risk 1/10 · Minimal
- FEMA flood zone
- X (shaded)
- Chance of flooding over 30 yrs
- 0.0%
- Est. flood insurance / yr
- $507 – $1,088
Fire risk 4/10 · Minor
- Est. fire insurance / yr
- $659 – $1,223
Heat risk 7/10 · Major
- Hot days now (above 101°F)
- 6 days/yr
- Hot days in 30 yrs
- 16 days/yr
Wind risk 1/10 · Minimal
- Chance of severe wind over 30 yrs
- —
Air-quality risk 7/10 · Major
- Unhealthy air days now
- 14 days/yr
- Unhealthy air days in 30 yrs
- 18 days/yr
Risk factors via First Street. Map © Google.
Why this score? — see what drove the B grade
The composite is a weighted blend of 9 inputs, each scored 0–100. Each bar is that input's sub-score; the figure is the points it added to the 100-point composite (weight × sub-score).
- Cash flow +30.0/30.0
- 1% rule +10.0/10.0
- DSCR +10.0/10.0
- Appreciation +6.2/10.0
- ARV discount +6.0/15.0
- Rent growth +2.5/5.0
- Livability +2.5/5.0
- Condition / age +2.5/5.0
- Schools +2.2/10.0
$125,000
🖨 Deal sheet 📄 Offer letter ✓ Due diligence
Listing remarks MLS
Very spacious and beautiful 3 bed/2 bath home recently REMODELATED inside and outside, new cabinets in the kitchen, new floors, freshly painted. Master bedroom has a new vanity and faucets. Electric lock in two principal doors. New MILGARD windows. New central swamp cooler and new window coolers. New central heating system. This property is amazing is fully fenced, very private and secure. System Alexa connected. Electric gate that works with solar panel(12'long+2 Remote controls. . You do not want to miss out very close to the freeway.
Key facts
- Bonus room
- Updated kitchen
- Granite countertops
Tags
Property features AI
Finance
- Other: Space number Spc 68; APN 258-200-68; Sign present at property
- Financial info: Deposit listed as $3,000 (buyer to verify); Park deposit: buyer to verify; New space rent $750
- HOA & community: Rosamond Mobile Home Park (space rent listed at $750); All ages allowed; Park manager phone available
Exterior
- Utilities: Natural gas
- Home design: Mobile home (manufactured 1979); Skirted; 60 ft long by 12 ft wide
- Construction: Metal roof (buyer to verify); Manufactured by Skyline, model Skylne; Serial numbers: 03720803MA and 03720803MB; Trade name Homette
- Exterior features: Fully fenced; Community pool (mobile home park)
Interior
- Kitchen: Gas range; Microwave
- Bathrooms: 2 full bathrooms
- Heating & cooling: Central heat (gas); Central air / evaporative cooling; Wall or window evaporative unit
- Interior features: Gas range; Microwave; Shed
Neighborhood map
What this means for you Summary
Snapshot
- This is a 3-bed/2.0-bath manufactured listed at $125k.
Deal economics
- At list price, monthly cash flow is $1k ($13k/yr) — positive.
- The deal already cash-flows at list — no discount required.
- Meets the 1% rule at list price ($2k rent vs $125k).
- Cap rate 16.5% vs local median 4.3% in Rosamond — top-decile yield for the area; either an underpriced asset or a hidden risk that comps aren't pricing in. Stress-test before assuming the spread holds.
Location & tenants
- Location reads 49/100 on livability (#1,178 in CA) — a working-class tenant base; expect higher turnover. Strengths: housing A+; Watch: schools F, crime F, amenities F.
- Southern Kern Unified (town): math 25% / reading 25% proficiency, ranked #387 of 517 in CA (top 75%) — low school quality limits family demand, transient renter base, plan for 1-2y turnover; 67% free/reduced lunch — lower-income household profile, screen leases tightly.
- Market conditions: 458 active listings in the ZIP; 19 comparable units currently listed for rent nearby; rentals leasing fast (median 10d on market — plan ~1-2 weeks tenant-placement turnaround); solid renter incomes; 3,244 units permitted in Kern County in 2024 (73 in 5+ unit buildings).
- This rent runs 37% of the median local income ($77k/yr) — at the standard rent-burdened threshold; future hikes will face affordability resistance.
Forward outlook
- In year one you build about $4k of equity ($864 loan paydown + $3k appreciation (2.4% local appreciation)).
- Kern County population projected at +17% by 2050 — long-run rental-demand tailwind backs the buy-and-hold thesis.
- At projected returns (2.4% appreciation + 3.0% rent growth), your $35k cash investment doubles in ~3 years — after that, you're playing with house money.
- By year 9, paydown + projected appreciation supports a ~$33k cash-out refi (75% LTV) — recoverable capital for the next deal without selling this one.
Negotiation context
- Only 9 days on market — expect competitive offers; lowballing is unlikely to land.
- 5 sale attempts since 6y ago with the ask held roughly flat each time — persistent listings suggest the price (not the market) is what's stuck; bring a comps-based counter.
- Current owner paid $97k; 29% above their basis — modest negotiation headroom, anchor on the comps not their cost.
Risks & watch-outs
- Climate carrying-cost: extreme-heat days projected 6→16/yr by 2055 (HVAC capex compounding) — expect insurance premiums to compound above CPI over the hold.
Questions for the listing agent
- Built in 1979 — when were the roof, HVAC, electrical panel, plumbing, and water heater last replaced?
- Is there a deadline driving the sale (1031 exchange, divorce, estate, relocation)? That informs how much negotiation room exists.
- Schools are F-rated, which usually means shorter tenancies and higher turnover. Who's the typical renter profile here, and what's been the actual vacancy rate?
- Crime grade is F in this area — have there been break-ins, vandalism, or insurance claims at this property in the last 3 years? What carrier currently insures it and at what premium?
- What's the average days-on-market for RENTAL listings here right now (not sales)? A rising rental-DOM trend means longer vacancies and softer asking-rent achievability than the comps imply.
- What's the recent tenant-quality profile in this submarket — average credit score on applications, eviction rate, late-payment / NSF rate, and stable-employment percentage? A property-management company in the area should have these aggregated.
- How much new for-sale + rental construction is in the pipeline within 1–3 miles? Heavy new supply typically softens prices + rents 12–24 months out; constrained supply supports both.
Investment metrics
- 1% rule
- 1.89% ✓
- Cap rate
- 16.47%
- Cash-on-cash
- 36.33%
- DSCR
- 2.62
- GRM
- 4.4
CMA / ARV
- ARV (on-the-fly)
- $120,960
- Comps found
- 12
Show comp detail 12 sales within ~0.75 mi
| Address | Dist | Beds/Ba | Sqft | Sold | Price | $/sf | Match |
|---|---|---|---|---|---|---|---|
| 1335 Richfield Ave | 0.37mi | 3/2.0 | 1,296 (-4%) | 3mo | $320,000 | $247 | 74 |
| 3300 W 15th St Spc 340 | 0.57mi | 3/2.0 | 1,344 (0%) | 6mo | $120,000 | $89 | 68 |
| 3300 15th W #389 | 0.57mi | 3/2.0 | 1,440 (+7%) | 1mo | $102,000 | $71 | 61 |
| — | 0.51mi | 4/2.0 (+1) | 1,325 (-1%) | 13mo | $125,000 | $94 | 58 |
| 3300 W 15th St W #360 | 0.57mi | 3/2.0 | 1,440 (+7%) | 5mo | $130,000 | $90 | 57 |
| 3300 W 15th St Spc 151 | 0.57mi | 3/2.0 | 1,440 (+7%) | 9mo | $131,000 | $91 | 54 |
| 3300 15th St W #367 | 0.57mi | 4/2.0 (+1) | 1,392 (+4%) | 13mo | $129,900 | $93 | 52 |
| 3300 15th St W #59 | 0.57mi | 3/3.0 | 1,420 (+6%) | 15mo | $120,000 | $85 | 47 |
| 3300 15th St W #39 | 0.57mi | 3/2.0 | 1,536 (+14%) | 6mo | $65,000 | $42 | 44 |
| 3300 W 15th St #194 | 0.57mi | 3/2.0 | 1,152 (-14%) | 7mo | $117,000 | $102 | 44 |
| 3300 15th St W #102 | 0.57mi | 3/2.0 | 1,488 (+11%) | 15mo | $122,100 | $82 | 43 |
| 3300 15th St W #263 | 0.57mi | 3/2.0 | 1,152 (-14%) | 8mo | $53,650 | $47 | 43 |
Match score weights: distance 35% · size 25% · config 20% · recency 20%. Top-matched comps best support the ARV.
Projected returns pro-forma
2.4% appreciation · 3.0% rent growth · sell at horizon
- IRR
- 41.0%
- Equity multiple
- 3.25×
- Total profit
- $78,659
- Equity at exit
- $52,066
- IRR
- 41.5%
- Equity multiple
- 6.44×
- Total profit
- $190,418
- Equity at exit
- $77,159
Cash invested: $35,000 (down + closing). Projections, not guarantees.
Landlord ↔ Tenant lean methodology
- Overall (STATE)
- 18 Strongly Tenant-Friendly
- State California
- 18 Strongly Tenant-Friendly · D+13
- County
- — inherits STATE
- City
- — inherits STATE
ZIP-level market 93560
- Home prices YoY
- 0.6%
- Active inventory
- 458
- Price-to-rent
- 4.4×
Monthly cashflow live
- Estimated rent
- $2,367 high interval (Pro) →
- Mortgage (P&I)
- −$656
- Tax from tax record
- −$103 /mo · $1,237/yr
- Insurance
- −$52
- HOA
- −$0
- Vacancy / Maint / Mgmt
- −$497
- Net cashflow
- $1,060
Break-even live
UW: 25.0% down · 7.5% · 30yr · 1.5% tax · 5.0% vac · 8.0% maint · 8.0% mgmt
Financing live
Cash to close
- Down payment
- $31,250
- Closing costs
- $3,750
- Reserves months
- —
- Total cash needed
- —
Loan-product check · same deal, 3 products live
Conventional
25% down · 7.5% · 30yr
- Down + closing
- —
- Monthly P&I
- —
- Monthly cashflow
- —
- DSCR
- —
- Eligible?
- —
Personal DTI + credit; lowest rate.
DSCR
20% down · 8.5% · 30yr
- Down + closing
- —
- Monthly P&I
- —
- Monthly cashflow
- —
- DSCR
- —
- Eligible?
- —
No personal income docs; deal must DSCR.
Hard money
10% down · 12.0% · 12mo
- Down + closing
- —
- Monthly P&I
- —
- Monthly cashflow
- —
- DSCR
- —
- Eligible?
- —
Short-term bridge; refi at stabilization.
Rent comps 19 comps
| Address | Beds | Baths | Sqft | Rent | $/sqft | DOM | Units | Dist |
|---|---|---|---|---|---|---|---|---|
| 3400 15th St W Unit 21 Rosamond, CA | 2.0 | 1.0 | 950 | $1,495 | $1.57 | 10d | 1 | 0.54mi |
| 1838 Center St Unit A Rosamond, CA | 3.0 | 2.5 | 1495 | $2,000 | $1.34 | 1d | 1 | 0.57mi |
| 1838 Center St Unit A Rosamond, CA | 3.0 | 2.5 | 1475 | $2,000 | $1.36 | 10d | 1 | 0.57mi |
| 2821 Desert St Unit C Rosamond, CA | 2.0 | 1.0 | 975 | $1,795 | $1.84 | 1d | 1 | 0.61mi |
| 3400 15th St W Unit 118 Rosamond, CA | 2.0 | 1.5 | 1050 | $1,600 | $1.52 | 10d | 1 | 0.61mi |
| 3400 15th St W Rosamond, CA | 2.0 | 1.0 | 1000 | $1,498 | $1.50 | 1d | 4 | 0.71mi |
| 2910 B St Rosamond, CA | 2.0 | 1.5 | 1775 | $1,542 | $0.87 | 19d | 1 | 0.77mi |
| 2051 Candice Ave Rosamond, CA | 3.0 | 2.0 | 1345 | $2,395 | $1.78 | 15d | 1 | 0.88mi |
| 3172 Shelley St Rosamond, CA | 4.0 | 2.0 | 1192 | $2,300 | $1.93 | 22d | 1 | 0.91mi |
| 1953 Marie Ave Apt A Rosamond, CA | 4.0 | 3.0 | 1753 | $2,550 | $1.45 | 43d | 1 | 1.04mi |
| 1953 Marie Ave Apt A Rosamond, CA | 4.0 | 3.0 | 1753 | $2,550 | $1.45 | 3d | 1 | 1.04mi |
| 1943 Pengilley Ave Rosamond, CA | 3.0 | 2.0 | 1379 | $2,600 | $1.89 | 1d | 1 | 1.10mi |
| 1225 Barrington Ave Rosamond, CA | 3.0 | 2.0 | 1072 | $2,200 | $2.05 | 1d | 1 | 1.10mi |
| 2300 Panorama Ln Rosamond, CA | 2.0 | 2.0 | 1121 | $2,300 | $2.05 | 43d | 1 | 1.22mi |
| 2516 Starbrite Ave Rosamond, CA | 3.0 | 2.0 | 1542 | $2,900 | $1.88 | 1d | 1 | 1.26mi |
| 2416 W Valley Vis Rosamond, CA | 3.0 | 2.0 | 1343 | $2,250 | $1.68 | 15d | 1 | 1.31mi |
| 2608 Starbrite Ave Rosamond, CA | 4.0 | 2.0 | 1542 | $2,795 | $1.81 | 1d | 1 | 1.34mi |
| 2436 Horizon Dr Rosamond, CA | 3.0 | 2.0 | 1416 | $4,500 | $3.18 | 43d | 1 | 1.35mi |
| 3317 Dale Ct Rosamond, CA | 3.0 | 2.0 | 1330 | $800 | $0.60 | 1d | 1 | 1.47mi |
Listing history 8 events
-
2026-06-18days on market $125,000 Active 9 DOM
-
2026-06-17days on market $125,000 Active 8 DOM
-
2026-06-16days on market $125,000 Active 7 DOM
-
2026-06-15days on market $125,000 Active 6 DOM
-
2026-06-13days on market $125,000 Active 4 DOM
-
2026-06-13days on market $125,000 Active 3 DOM
-
2026-06-10remarks 506-char remark
-
2026-06-10$125,000 Active 1 DOM
ⓘ Source: listings_history table (triggers on properties + properties_extension) + one-shot
backfill from property_details.listing_events for pre-trigger history.
Tax reassessment forecast CA · Resets to sale price
- Current annual tax
- $1,237 · $103/mo
- Projected year-2 tax
- $1,237 · $103/mo
- Expected delta
- $0/yr ($0/mo · 0.0%)
ⓘ Screening estimate from a state-policy table — verify with the county assessor before closing.
Climate risk First Street
- Flood 1/10 Low FEMA zone X (shaded) · 0% chance over 30 yrs
- Wildfire 4/10 Moderate
- Heat 7/10 Severe 6 d/yr ≥101°F today · 16 d/yr by 30 yrs out
- Wind 1/10 Low
- Air quality 7/10 Severe 14 unhealthy d/yr today · 18 by 30 yrs out
Nearby sold comps map
Loading sold comps map…
Walkable amenities ~0.75 mi
Loading nearby amenities…
Taxation est. · year 1
- Rental income
- $28,410
- − Mortgage interest
- −$7,002
- − Property taxes
- −$1,237
- − Insurance
- −$625
- − Repairs & maintenance
- −$2,273
- − Management
- −$2,273
- − Depreciation
- −$3,636
- Taxable income
- $11,364
- Est. tax owed @ 24.0%
- −$2,727
- After-tax cash flow
- $9,988/yr
For passive investors: Depreciation is non-cash, so a rental often shows a tax loss while cash-flowing — sheltering income. Rental losses are passive: they offset passive income freely, and up to $25,000/yr can offset ordinary (W-2) income if you actively participate and your MAGI is under $100k (phasing out to $0 by $150k); unused losses carry forward. On sale, claimed depreciation is recaptured at up to 25%, and gains may owe capital-gains tax (a 1031 exchange can defer both). Figures are a year-1 estimate at your 24.0% rate — not tax advice; consult a CPA.
Schools (NCES district)
- District
- Southern Kern Unified
- NCES district ID
- 0637620
- Math proficiency
- 25% ▲ 7.00%
- Reading proficiency
- 25% ▼ -8.00%
- Median HH income
- $54,523
- Composite
- 22.5/100
- National rank
- #8093
- State rank
- #387 of 517 in CA
Livability — Rosamond
- Score
- 49/100
- State rank
- #1178
- US rank
- #25952
Category grades
Schools grade is shown separately in the Schools card above.
Census & demographics
- Census place
- Rosamond, CA
- County
- Kern County · 710,371 people
- City population
- 22,119
- Metro
- Bakersfield, CA
- Population (ZIP)
- 22,119
- Household income
- $77,431
- Rent vs Own
- Severe rent burden
- 425.0
Population outlook (Kern County) Hauer SSP2
- Today (2025)
- 947,286 people
- By 2030
- 978,984 · +3.3%
- By 2040
- 1,045,018 · +10.3%
- By 2050
- 1,105,232 · +16.7%
- By 2075
- 1,229,538 · +29.8%
- By 2100
- 1,238,059 · +30.7%
Race, ethnicity, and origin ACS 2023
- Neighborhood character
- Diverse neighborhood (Simpson 0.68)
- Race & ethnicity
- Hispanic / Latino 45% White 32% Two or more races 17% Black 13% Asian 3% Native American 1%
- Hispanic origin (detail)
- Mexican 35%
- Common ancestry
- Portuguese 2% Italian 2% Lithuanian 1%
- Foreign-born
- 13% · Canada
- Languages at home
- 68% English-only · Spanish 28% Other Indo-European 2% Other Asian/Pacific 1%
Political lean MEDSL · Kern
- 2024 margin
- Strong R (+21.1) · D 38.2% · R 59.3% · Other 2.5%
- 2008→2024 swing
- -3.3pp toward R · 2008: -17.8pp · 2024: -21.1pp
- All cycles
- 2024: R+21.1 2020: R+10.2 2016: R+15.0 2012: R+20.9 2008: R+17.8
Not yet ingested
- Civics
- —
Market trends
- HPI YoY
- ▲ 2.40%
- Current HPI
- 403.7206
- Rent YoY
- —
- Metro
- Bakersfield, CA
- State GDP YoY
- ▲ 3.21%
- F500 in state
- 116
Industry mix (Fortune 500 HQ in CA)
| Industry | F500 HQs | Revenue |
|---|---|---|
| Technology | 27 | $1,492B |
|
||
| Financial Services | 3 | $174B |
|
||
| Retail | 3 | $44B |
|
||
| Insurance | 3 | $26B |
|
||
| Media / Entertainment | 2 | $115B |
|
||
| Pharmaceuticals / Biotech | 2 | $62B |
|
||
Price history
+150.0% since first listed11 events — show timeline
- 2026-06-09 Listed $125,000 AVMLS
- 2022-03-29 Listing Removed — AVMLS
- 2022-03-25 Sold (MLS) $97,000 AVMLS
- 2022-02-03 Relisted — AVMLS
- 2021-12-21 Price Changed $119,900 AVMLS
- 2021-12-20 Relisted — AVMLS
- 2021-10-13 Listed $129,900 AVMLS
- 2020-10-17 Listing Removed — AVMLS
- 2020-10-08 Sold (MLS) $40,000 AVMLS
- 2020-08-25 Price Changed $47,000 AVMLS
- 2020-07-20 Listed $50,000 AVMLS
Property tax history
+26.2%/yrLatest (2025): $1,237 · +7.2% YoY. Source: county tax records.
Cash-flow waterfall
monthlySold comps — $/sqft
last 12 mo · ≤1 miLoading sold comps…