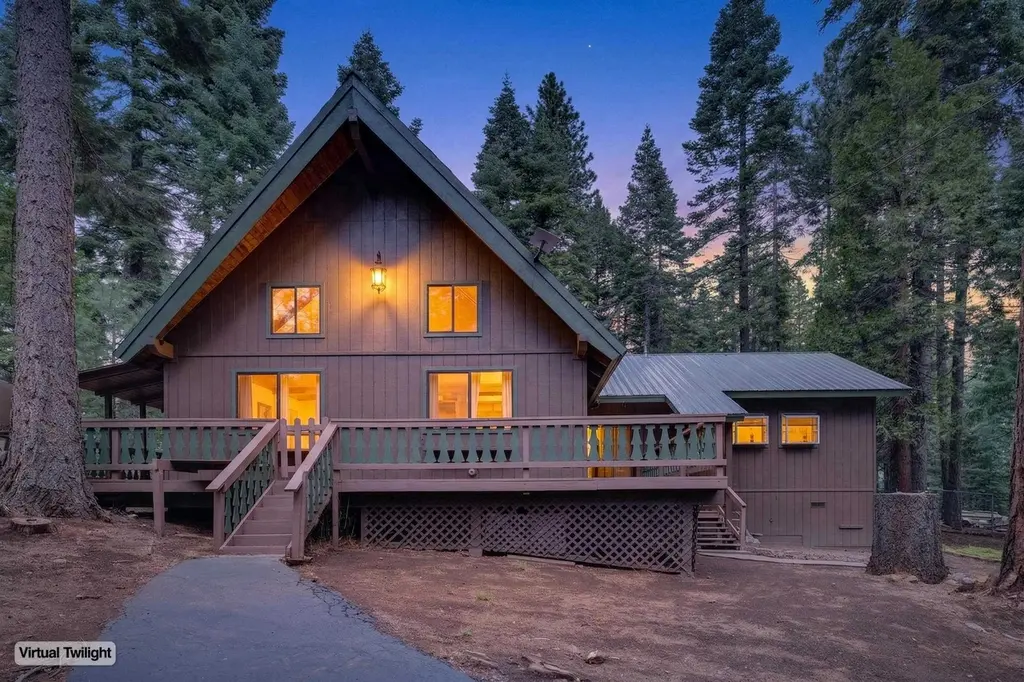
431 Ponderosa Circle Cir · Lake Almanor Peninsula, CA
Flood risk 1/10 · Minimal
- FEMA flood zone
- X (unshaded)
- Chance of flooding over 30 yrs
- 0.0%
- Est. flood insurance / yr
- $507 – $1,088
Fire risk 5/10 · Moderate
- Est. fire insurance / yr
- $659 – $1,223
Heat risk 3/10 · Minor
- Hot days now (above 89°F)
- 7 days/yr
- Hot days in 30 yrs
- 18 days/yr
Wind risk 1/10 · Minimal
- Chance of severe wind over 30 yrs
- —
Air-quality risk 10/10 · Severe
- Unhealthy air days now
- 21 days/yr
- Unhealthy air days in 30 yrs
- 25 days/yr
Risk factors via First Street. Map © Google.
Why this score? — see what drove the C+ grade
The composite is a weighted blend of 9 inputs, each scored 0–100. Each bar is that input's sub-score; the figure is the points it added to the 100-point composite (weight × sub-score).
- Cash flow +20.4/30.0
- ARV discount +15.0/15.0
- DSCR +6.5/10.0
- Appreciation +5.7/10.0
- 1% rule +4.5/10.0
- Schools +2.8/10.0
- Livability +2.8/5.0
- Rent growth +2.5/5.0
- Condition / age +2.5/5.0
$449,000
🖨 Deal sheet (PDF) 📄 Offer letter ✓ Due diligence
Listing remarks MLS
Nestled in the Pines neighborhood of Lake Almanor, this 3-bedroom, 2-bath home offers 1,932 sq ft of inviting living space. Freshened up and ready for new ownership, the home highlights its authentic cabin charm and warmth. A great opportunity to enjoy the mountain lifestyle today or bring your vision to update and personalize. Fully Fenced back yard and out door sun room ready for a spa with 220 wiring. Full of cozy character and classic mountain charm, it’s ideal as a full-time residence or a relaxing getaway.
Key facts
- 0.57 acre lot
- 2 garage spots
- Built 1989
Neighborhood map
What this means for you Summary
Snapshot
- This is a 3-bed/2.0-bath single-family listed at $449k.
Deal economics
- At list price, monthly cash flow is $580 ($7k/yr) — positive.
- The deal already cash-flows at list — no discount required.
- To meet the 1% rule (rent ≥ 1% of price), the offer needs to be $425k (5.3% below list).
- Recommended offer: $422k (6.0% below list) — sets the bar for market timing.
- Cap rate 7.8% vs local median 1.2% in Lake Almanor Peninsula — top-decile yield for the area; either an underpriced asset or a hidden risk that comps aren't pricing in. Stress-test before assuming the spread holds.
Location & tenants
- Location reads 56/100 on livability (#781 in CA) — a working-class tenant base; expect higher turnover. Strengths: employment A+, housing A+; Watch: crime C-, amenities F, commute F.
- Plumas Unified (rural): math 21% / reading 44% proficiency, ranked #306 of 517 in CA (top 59%) — families likely to look elsewhere, expect single-tenant / working-renter base with shorter leases.
- Zoned schools: C. Roy Carmichael Elementary (346 students, 72% FRL); Quincy Junior/Senior High (math 22% / reading 47%, grade F, #618 of 1,170 statewide, top 56%, 340 students, 48% FRL) — zoned schools average 60% FRL vs 41% district-wide (20 pts higher); higher-poverty schools than district average — tighter screening recommended.
- Market conditions: 240 active listings in the ZIP; 1 comparable units currently listed for rent nearby; 39 units permitted in Plumas County in 2024 (0 in 5+ unit buildings).
Forward outlook
- In year one you build about $9k of equity ($3k loan paydown + $6k appreciation (1.4% local appreciation)).
- Plumas County population projected at -42% by 2050 — secular population decline; favor cash flow + early exit over multi-decade hold.
- At projected returns (1.4% appreciation + 3.0% rent growth), your $126k cash investment doubles in ~7 years — after that, you're playing with house money.
- By year 4, paydown + projected appreciation supports a ~$33k cash-out refi (75% LTV) — recoverable capital for the next deal without selling this one.
Negotiation context
- It's been on market 66 days — a 6% lower offer ($422k) is reasonable based on typical stale-listing flexibility.
- 5 sale attempts since 7y ago with the ask held roughly flat each time — persistent listings suggest the price (not the market) is what's stuck; bring a comps-based counter.
- Current owner paid $170k; list at $449k implies a 165% gain — meaningful room to come down on a strong offer.
Risks & watch-outs
- Climate carrying-cost: moderate wildfire risk — expect insurance premiums to compound above CPI over the hold.
Questions for the listing agent
- It's been on market 66 days. Have you received any prior offers? Is the seller open to a 6% concession, seller financing, or rate buy-down credit?
- Why hasn't it sold? Are there any deal-killer items the seller is aware of (foundation, flood, title, zoning, code violations)?
- Is there a deadline driving the sale (1031 exchange, divorce, estate, relocation)? That informs how much negotiation room exists.
- Schools are F-rated, which usually means shorter tenancies and higher turnover. Who's the typical renter profile here, and what's been the actual vacancy rate?
- What's the average days-on-market for RENTAL listings here right now (not sales)? A rising rental-DOM trend means longer vacancies and softer asking-rent achievability than the comps imply.
- What's the recent tenant-quality profile in this submarket — average credit score on applications, eviction rate, late-payment / NSF rate, and stable-employment percentage? A property-management company in the area should have these aggregated.
- How much new for-sale + rental construction is in the pipeline within 1–3 miles? Heavy new supply typically softens prices + rents 12–24 months out; constrained supply supports both.
Investment metrics
- 1% rule
- 0.95% ✗
- Cap rate
- 7.84%
- Cash-on-cash
- 5.53%
- DSCR
- 1.25
- GRM
- 8.8
CMA / ARV
- ARV (median comp)
- $604,129
- List price
- $449,000
- Delta
- -25.68%
- Verdict
- UNDERPRICED
- Comps
- 20 within 1.0 mi
Show comp detail 8 sales within ~0.75 mi
| Address | Dist | Beds/Ba | Sqft | Sold | Price | $/sf | Match |
|---|---|---|---|---|---|---|---|
| 467 Ponderosa Dr | 0.27mi | 3/2.0 | 1,680 (-13%) | 6mo | $535,000 | $318 | 61 |
| 425 Ponderosa Drive Dr | 0.05mi | 4/3.0 (+1) | 2,048 (+6%) | 21mo | $388,000 | $189 | 61 |
| 419 Peninsula Drive Dr | 0.21mi | 4/3.0 (+1) | 1,981 (+2%) | 21mo | $400,000 | $202 | 59 |
| 625 Deep Forest Rd | 0.72mi | 3/2.0 | 1,944 (+1%) | 7mo | $540,000 | $278 | 59 |
| 293 Terranova Drive Dr | 0.53mi | 3/2.5 | 2,200 (+14%) | 4mo | $910,000 | $414 | 47 |
| 78 Lakeside Drive Dr | 0.54mi | 4/3.0 (+1) | 2,177 (+13%) | 2mo | $810,000 | $372 | 43 |
| 540 Peninsula Drive Dr | 0.64mi | 3/2.0 | 1,668 (-14%) | 8mo | $685,000 | $411 | 41 |
| 215 Peninsula Drive Dr | 0.66mi | 3/3.0 | 2,117 (+10%) | 14mo | $570,000 | $269 | 38 |
Match score weights: distance 35% · size 25% · config 20% · recency 20%. Top-matched comps best support the ARV.
Projected returns pro-forma
1.38% appreciation · 3.0% rent growth · sell at horizon
- IRR
- 8.2%
- Equity multiple
- 1.43×
- Total profit
- $53,535
- Equity at exit
- $162,157
- IRR
- 11.9%
- Equity multiple
- 2.50×
- Total profit
- $188,373
- Equity at exit
- $222,531
Cash invested: $125,720 (down + closing). Projections, not guarantees.
Landlord ↔ Tenant lean methodology
- Overall (STATE)
- 18 Strongly Tenant-Friendly
- State California
- 18 Strongly Tenant-Friendly · D+13
- County
- — inherits STATE
- City
- — inherits STATE
ZIP-level market 96137
- Home prices YoY
- 0.9%
- Active inventory
- 240
- Price-to-rent
- 8.8×
Monthly cashflow live
- Estimated rent
- $4,250 medium interval (Pro) →
- Mortgage (P&I)
- −$2,355
- Tax from tax record
- −$236 /mo · $2,832/yr
- Insurance
- −$187
- HOA
- −$0
- Vacancy / Maint / Mgmt
- −$892
- Net cashflow
- $580
Break-even live
Sensitivity live
| Price | -10% $834 | -5% $707 | +0% $580 | +5% $453 | +10% $326 |
|---|---|---|---|---|---|
| Rent | -10% $244 | -5% $412 | +0% $580 | +5% $748 | +10% $916 |
| Rate | -1.0pp $806 | -0.5pp $694 | base $580 | +0.5pp $463 | +1.0pp $345 |
UW: 25.0% down · 7.5% · 30yr · 1.5% tax · 5.0% vac · 8.0% maint · 8.0% mgmt
Financing live
Cash to close
- Down payment
- $112,250
- Closing costs
- $13,470
- Reserves months
- —
- Total cash needed
- —
Loan-product check · same deal, 3 products live
Conventional
25% down · 7.5% · 30yr
- Down + closing
- —
- Monthly P&I
- —
- Monthly cashflow
- —
- DSCR
- —
- Eligible?
- —
Personal DTI + credit; lowest rate.
DSCR
20% down · 8.5% · 30yr
- Down + closing
- —
- Monthly P&I
- —
- Monthly cashflow
- —
- DSCR
- —
- Eligible?
- —
No personal income docs; deal must DSCR.
Hard money
10% down · 12.0% · 12mo
- Down + closing
- —
- Monthly P&I
- —
- Monthly cashflow
- —
- DSCR
- —
- Eligible?
- —
Short-term bridge; refi at stabilization.
Rent comps 1 comps
| Address | Beds | Baths | Sqft | Rent | $/sqft | DOM | Units | Dist |
|---|---|---|---|---|---|---|---|---|
| 601 W Burnt Cedar Rd Westwood, CA | 3.0 | 3.0 | 2100 | $4,250 | $2.02 | 46d | 1 | 1.25mi |
Listing history 28 events
-
2026-06-22days on market $449,000 Active 66 DOM
-
2026-06-19days on market $449,000 Active 64 DOM
-
2026-06-18days on market $449,000 Active 63 DOM
-
2026-06-17days on market $449,000 Active 62 DOM
-
2026-06-16days on market $449,000 Active 61 DOM
-
2026-06-15days on market $449,000 Active 60 DOM
-
2026-06-14days on market $449,000 Active 58 DOM
-
2026-06-13days on market $449,000 Active 57 DOM
-
2026-06-10days on market $449,000 Active 55 DOM
-
2026-06-09days on market $449,000 Active 54 DOM
-
2026-06-08days on market $449,000 Active 53 DOM
-
2026-06-07days on market $449,000 Active 52 DOM
-
2026-06-05days on market $449,000 Active 49 DOM
-
2026-06-03days on market $449,000 Active 48 DOM
-
2026-06-02days on market $449,000 Active 47 DOM
-
2026-06-01days on market $449,000 Active 46 DOM
-
2026-05-31days on market $449,000 Active 45 DOM
-
2026-05-30days on market $449,000 Active 44 DOM
-
2026-04-17$449,000 Active 523-char remark
Show marketing remark (523 chars)
Nestled in the Pines neighborhood of Lake Almanor, this 3-bedroom, 2-bath home offers 1,932 sq ft of inviting living space. Freshened up and ready for new ownership, the home highlights its authentic cabin charm and warmth. A great opportunity to enjoy the mountain lifestyle today or bring your vision to update and personalize. Fully Fenced back yard and out door sun room ready for a spa with 220 wiring. Full of cozy character and classic mountain charm, it’s ideal as a full-time residence or a relaxing getaway.
-
2025-07-18price $465,500
-
2025-06-22price $479,000
-
2025-06-06$485,000 Active
-
2024-07-04$475,000 Active
-
2023-07-13price $474,000
-
2023-05-11$479,000 Active
-
2019-06-05$439,000
-
2011-07-22soldstatus $169,500
-
2005-09-12soldstatus $365,000
ⓘ Source: listings_history table (triggers on properties + properties_extension) + one-shot
backfill from property_details.listing_events for pre-trigger history.
Tax reassessment forecast CA · Resets to sale price
- Current annual tax
- $2,832 · $236/mo
- Projected year-2 tax
- $3,412 · $284/mo
- Expected delta
- +$581/yr (+$48/mo · 20.5%)
ⓘ Screening estimate from a state-policy table — verify with the county assessor before closing.
Climate risk First Street
- Flood 1/10 Low FEMA zone X (unshaded) · 0% chance over 30 yrs
- Wildfire 5/10 Major
- Heat 3/10 Moderate 7 d/yr ≥89°F today · 18 d/yr by 30 yrs out
- Wind 1/10 Low
- Air quality 10/10 Extreme 21 unhealthy d/yr today · 25 by 30 yrs out
Nearby sold comps map
Loading sold comps map…
Walkable amenities ~0.75 mi
Loading nearby amenities…
Taxation est. · year 1
- Rental income
- $51,000
- − Mortgage interest
- −$25,151
- − Property taxes
- −$2,832
- − Insurance
- −$2,245
- − Repairs & maintenance
- −$4,080
- − Management
- −$4,080
- − Depreciation
- −$13,062
- Taxable loss
- −$449
- Est. tax savings @ 24.0%
- +$108
- After-tax cash flow
- $7,066/yr
For passive investors: Depreciation is non-cash, so a rental often shows a tax loss while cash-flowing — sheltering income. Rental losses are passive: they offset passive income freely, and up to $25,000/yr can offset ordinary (W-2) income if you actively participate and your MAGI is under $100k (phasing out to $0 by $150k); unused losses carry forward. On sale, claimed depreciation is recaptured at up to 25%, and gains may owe capital-gains tax (a 1031 exchange can defer both). Figures are a year-1 estimate at your 24.0% rate — not tax advice; consult a CPA.
Schools (NCES district)
- District
- Plumas Unified
- NCES district ID
- 0631170
- Math proficiency
- 21% ▼ -11.00%
- Reading proficiency
- 44% ▬ 0.00%
- Median HH income
- $46,935
- Composite
- 27.89/100
- National rank
- #6870
- State rank
- #306 of 517 in CA
Livability — Lake Almanor Peninsula
- Score
- 56/100
- State rank
- #781
- US rank
- #22469
Category grades
Schools grade is shown separately in the Schools card above.
Census & demographics
- Census place
- Lake Almanor Peninsula, CA
- Population (ZIP)
- 2,717
Population outlook (Plumas County) Hauer SSP2
- Today (2025)
- 15,564 people
- By 2030
- 14,014 · -10.0%
- By 2040
- 11,197 · -28.1%
- By 2050
- 9,069 · -41.7%
- By 2075
- 5,573 · -64.2%
- By 2100
- 3,392 · -78.2%
Race, ethnicity, and origin ACS 2023
- Neighborhood character
- Predominantly White (81%)
- Race & ethnicity
- White 81% Hispanic / Latino 10% Two or more races 8% Native American 4%
- Hispanic origin (detail)
- Mexican 5%
- Common ancestry
- Slovak 4% Lithuanian 3% Italian 2%
- Foreign-born
- 4% · Canada
- Languages at home
- 93% English-only · Spanish 5% Other Indo-European 1%
Political lean MEDSL · Plumas
- 2024 margin
- R (+16.9) · D 39.9% · R 56.9% · Other 3.2%
- 2008→2024 swing
- -5.0pp toward R · 2008: -12.0pp · 2024: -16.9pp
- All cycles
- 2024: R+16.9 2020: R+16.7 2016: R+21.0 2012: R+17.2 2008: R+12.0
Not yet ingested
- Civics
- —
Market trends
- HPI YoY
- ▲ 1.38%
- Current HPI
- 153.1005
- Rent YoY
- —
- Metro
- —
- State GDP YoY
- ▲ 3.21%
- F500 in state
- 116
Industry mix (Fortune 500 HQ in CA)
| Industry | F500 HQs | Revenue |
|---|---|---|
| Technology | 27 | $1,492B |
|
||
| Financial Services | 3 | $174B |
|
||
| Retail | 3 | $44B |
|
||
| Insurance | 3 | $26B |
|
||
| Media / Entertainment | 2 | $115B |
|
||
| Pharmaceuticals / Biotech | 2 | $62B |
|
||
Price history
+23.0% since first listed10 events — show timeline
- 2026-04-17 Listed $449,000 PAR
- 2025-07-18 Price Changed $465,500 PAR
- 2025-06-22 Price Changed $479,000 PAR
- 2025-06-06 Listed $485,000 PAR
- 2024-07-04 Listed $475,000 PAR
- 2023-07-13 Price Changed $474,000 PAR
- 2023-05-11 Listed $479,000 PAR
- 2019-06-05 Listed $439,000 PAR
- 2011-07-22 Sold (Public Records) $169,500 Public Records
- 2005-09-12 Sold (Public Records) $365,000 Public Records
Property tax history
+2.8%/yrLatest (2025): $2,832 · -0.5% YoY. Source: county tax records.
Cash-flow waterfall
monthlySold comps — $/sqft
last 12 mo · ≤1 miLoading sold comps…