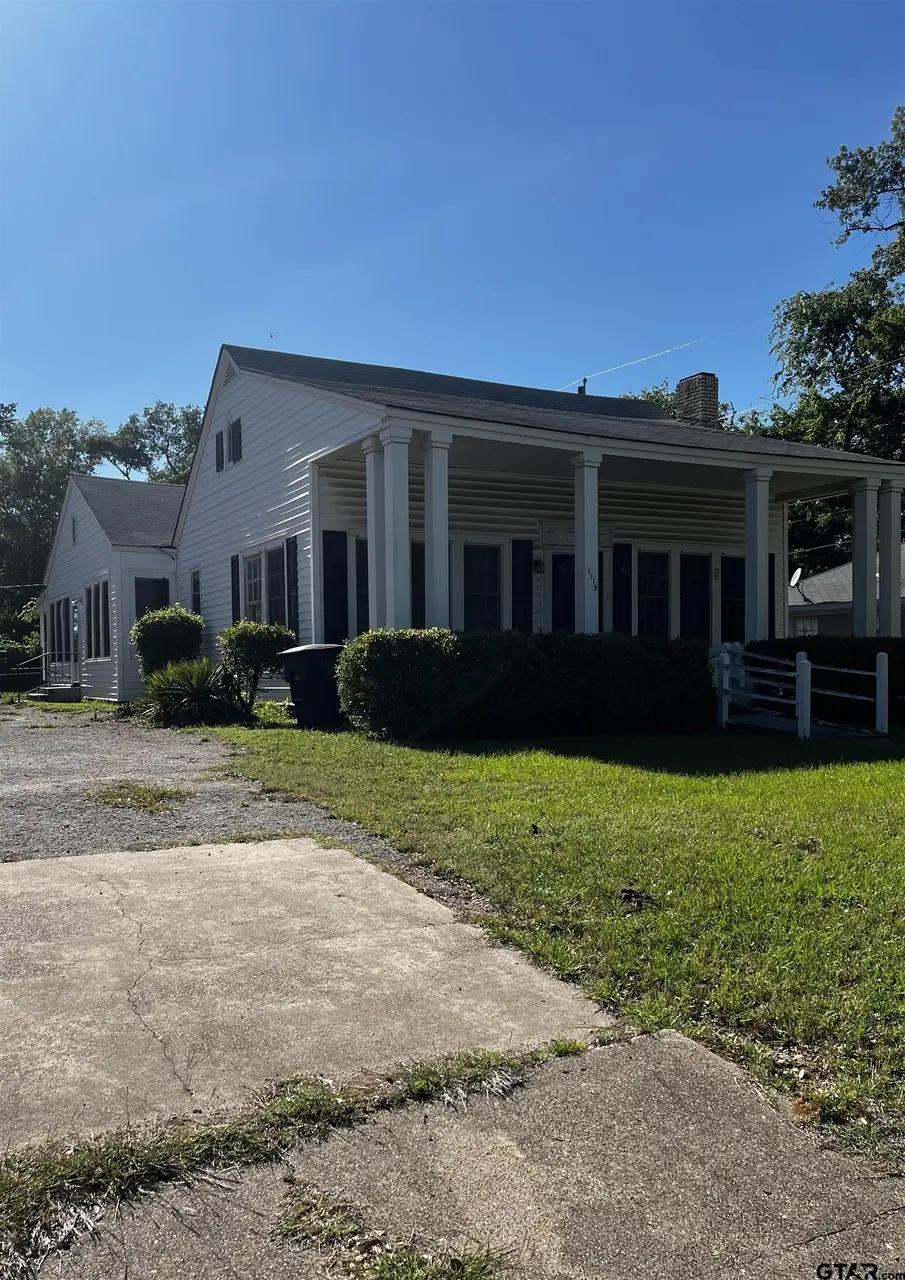
1115 S Glenwood Blvd · Tyler, TX
Flood risk 1/10 · Minimal
- FEMA flood zone
- X (unshaded)
- Chance of flooding over 30 yrs
- 0.0%
- Est. flood insurance / yr
- $507 – $1,088
Fire risk 1/10 · Minimal
- Est. fire insurance / yr
- $1,222 – $2,270
Heat risk 6/10 · Moderate
- Hot days now (above 109°F)
- 7 days/yr
- Hot days in 30 yrs
- 25 days/yr
Wind risk 6/10 · Moderate
- Chance of severe wind over 30 yrs
- 60.0%
Air-quality risk 2/10 · Minimal
- Unhealthy air days now
- 0 days/yr
- Unhealthy air days in 30 yrs
- 1 days/yr
Risk factors via First Street. Map © Google.
Why this score? — see what drove the C- grade
The composite is a weighted blend of 9 inputs, each scored 0–100. Each bar is that input's sub-score; the figure is the points it added to the 100-point composite (weight × sub-score).
- Cash flow +15.4/30.0
- ARV discount +15.0/15.0
- DSCR +4.7/10.0
- Livability +3.8/5.0
- 1% rule +3.7/10.0
- Rent growth +3.4/5.0
- Schools +3.3/10.0
- Condition / age +2.5/5.0
- Appreciation +0.0/10.0
$193,660
🖨 Deal sheet 📄 Offer letter ✓ Due diligence
Listing remarks
3 bedroom, 2 bath home, 1684 sqft. Located in an established neighborhood in Tyler, close proximity to shopping and restaurants. This property is ready for someone with a vision to make it their own. It does need some work but it offers charm, a nice floor plan, and a spacious lot. The property is being Sold AS-IS.
Key facts
- Spacious lot
- Built 1946
- Listed 37 days
Tags
Property features AI
Exterior
- Parking: Concrete and gravel parking
- Home design: Single-family detached residence; Single story
- Construction: Composition roof
- Exterior features: Covered patio and porch; Patio; Porch; Chain link and wood fencing; Composition roof
Interior
- Kitchen: Range
- Flooring: Carpet; Tile
- Bathrooms: 2 full bathrooms
- Heating & cooling: Central heating (electric); Central air; Ceiling fan(s)
- Interior features: Range; Wood-burning fireplace
Neighborhood map
What this means for you Summary
Snapshot
- This is a 3-bed/2.0-bath single-family listed at $194k.
Deal economics
- At list price, monthly cash flow is $73 ($875/yr) — positive.
- The deal already cash-flows at list — no discount required.
- To meet the 1% rule (rent ≥ 1% of price), the offer needs to be $168k (13.4% below list).
- Recommended offer: $168k (13.4% below list) — sets the bar for 1% rule.
- Cap rate 6.7% vs local median 3.6% in Tyler — top-decile yield for the area; either an underpriced asset or a hidden risk that comps aren't pricing in. Stress-test before assuming the spread holds.
Location & tenants
- Location reads 75/100 on livability (#147 in TX, #4,181 nationally) — a middle-class / working-renter tenant base. Strengths: cost of living A+, housing A+, health & safety A+; Watch: employment C-, crime D+, commute F.
- Tyler ISD (urban): math 39% / reading 38% proficiency, ranked #449 of 826 in TX (top 54%) — families likely to look elsewhere, expect single-tenant / working-renter base with shorter leases; 66% free/reduced lunch — lower-income household profile, screen leases tightly.
- Zoned schools: Peete El (math 22% / reading 17%, grade F, #3,583 of 4,322 statewide, top 86%, 414 students, 98% FRL); Hubbard Middle (math 47% / reading 45%, grade D+, #462 of 1,662 statewide, top 28%, 869 students, 62% FRL); Tyler Legacy H S (math 34% / reading 49%, grade F, #767 of 1,632 statewide, top 47%, 2,594 students, 58% FRL).
- Market conditions: Rents rising (+3.7%/yr); 327 active listings in the ZIP; 30 comparable units currently listed for rent nearby; rentals at typical pace (median 21d on market — plan ~3-4 weeks tenant-placement turnaround); 595 units permitted in Smith County in 2024 (45 in 5+ unit buildings).
- This rent runs 30% of the median local income ($66k/yr) — at the standard rent-burdened threshold; future hikes will face affordability resistance.
Forward outlook
- Local home prices are declining (-3.0%/yr); year-one equity from $1k of loan paydown is wiped out by about $6k of value loss. Plan a longer hold.
- Smith County population projected at +24% by 2050 — long-run rental-demand tailwind backs the buy-and-hold thesis.
Negotiation context
- It's been on market 38 days — a 3% lower offer ($188k) is reasonable based on typical stale-listing flexibility.
Risks & watch-outs
- Watch-outs: built in 1946 — expect roof / HVAC / electrical / plumbing capex.
- Climate carrying-cost: major wind risk, 60% chance of damaging wind over 30y; extreme-heat days projected 7→25/yr by 2055 (HVAC capex compounding) — expect insurance premiums to compound above CPI over the hold.
Questions for the listing agent
- It's been on market 38 days. Have you received any prior offers? Is the seller open to a 13% concession, seller financing, or rate buy-down credit?
- Built in 1946 — when were the roof, HVAC, electrical panel, plumbing, and water heater last replaced?
- Is there a deadline driving the sale (1031 exchange, divorce, estate, relocation)? That informs how much negotiation room exists.
- Schools are D-rated, which usually means shorter tenancies and higher turnover. Who's the typical renter profile here, and what's been the actual vacancy rate?
- Crime grade is D in this area — have there been break-ins, vandalism, or insurance claims at this property in the last 3 years? What carrier currently insures it and at what premium?
- What's the average days-on-market for RENTAL listings here right now (not sales)? A rising rental-DOM trend means longer vacancies and softer asking-rent achievability than the comps imply.
- What's the recent tenant-quality profile in this submarket — average credit score on applications, eviction rate, late-payment / NSF rate, and stable-employment percentage? A property-management company in the area should have these aggregated.
- How much new for-sale + rental construction is in the pipeline within 1–3 miles? Heavy new supply typically softens prices + rents 12–24 months out; constrained supply supports both.
Investment metrics
- 1% rule
- 0.87% ✗
- Cap rate
- 6.74%
- Cash-on-cash
- 1.61%
- DSCR
- 1.07
- GRM
- 9.6
CMA / ARV
- ARV (median comp)
- $251,611
- List price
- $193,660
- Delta
- -23.03%
- Verdict
- UNDERPRICED
- Comps
- 15 within 1.0 mi
Show comp detail 2 sales within ~0.75 mi
| Address | Dist | Beds/Ba | Sqft | Sold | Price | $/sf | Match |
|---|---|---|---|---|---|---|---|
| 917 W Shaw St | 0.15mi | 3/2.0 | 1,644 (-2%) | 0mo | $149,900 | $91 | 89 |
| 1011 S Chilton Ave | 0.49mi | 2/1.0 (-1) | 1,467 (-13%) | 2mo | $324,900 | $221 | 45 |
Match score weights: distance 35% · size 25% · config 20% · recency 20%. Top-matched comps best support the ARV.
Projected returns pro-forma
-3.0% appreciation · 3.66% rent growth · sell at horizon
- IRR
- -13.1%
- Equity multiple
- 0.53×
- Total profit
- $-25,641
- Equity at exit
- $28,875
- IRR
- -3.2%
- Equity multiple
- 0.78×
- Total profit
- $-11,792
- Equity at exit
- $16,744
Cash invested: $54,225 (down + closing). Projections, not guarantees.
Landlord ↔ Tenant lean methodology
- Overall (STATE)
- 87 Strongly Landlord-Friendly
- State Texas
- 87 Strongly Landlord-Friendly · R+5
- County
- — inherits STATE
- City
- — inherits STATE
ZIP-level market 75701
- Rents YoY
- 3.7%
- Active inventory
- 327
- Price-to-rent
- 9.6×
Monthly cashflow live
- Estimated rent
- $1,678 high interval (Pro) →
- Mortgage (P&I)
- −$1,016
- Tax from tax record
- −$156 /mo · $1,876/yr
- Insurance
- −$81
- HOA
- −$0
- Vacancy / Maint / Mgmt
- −$352
- Net cashflow
- $73
Break-even live
UW: 25.0% down · 7.5% · 30yr · 1.5% tax · 5.0% vac · 8.0% maint · 8.0% mgmt
Financing live
Cash to close
- Down payment
- $48,415
- Closing costs
- $5,810
- Reserves months
- —
- Total cash needed
- —
Loan-product check · same deal, 3 products live
Conventional
25% down · 7.5% · 30yr
- Down + closing
- —
- Monthly P&I
- —
- Monthly cashflow
- —
- DSCR
- —
- Eligible?
- —
Personal DTI + credit; lowest rate.
DSCR
20% down · 8.5% · 30yr
- Down + closing
- —
- Monthly P&I
- —
- Monthly cashflow
- —
- DSCR
- —
- Eligible?
- —
No personal income docs; deal must DSCR.
Hard money
10% down · 12.0% · 12mo
- Down + closing
- —
- Monthly P&I
- —
- Monthly cashflow
- —
- DSCR
- —
- Eligible?
- —
Short-term bridge; refi at stabilization.
Rent comps 30 comps
| Address | Beds | Baths | Sqft | Rent | $/sqft | DOM | Units | Dist |
|---|---|---|---|---|---|---|---|---|
| 1500 Mockingbird Ln Tyler, TX | 3.0 | 2.0 | 1090 | $1,230 | $1.13 | 43d | 1 | 0.25mi |
| 1655 S Kennedy Ave Tyler, TX | 2.0 | 2.5 | 1174 | $1,595 | $1.36 | 43d | 1 | 0.39mi |
| 1655 S Kennedy Ave Unit 203 Tyler, TX | 2.0 | 2.5 | 1174 | $1,650 | $1.41 | 43d | 1 | 0.39mi |
| 1115 S Robertson Ave Tyler, TX | 2.0 | 1.0 | 1366 | $1,550 | $1.13 | 13d | 1 | 0.40mi |
| 902 W 5th St Tyler, TX | 2.0 | 1.0 | 1369 | $1,200 | $0.88 | 13d | 1 | 0.42mi |
| 522 W Dobbs St Tyler, TX | 3.0 | 1.0 | 1127 | $1,395 | $1.24 | 13d | 1 | 0.45mi |
| 908 W 6th St Tyler, TX | 2.0 | 1.0 | 1112 | $1,300 | $1.17 | 13d | 1 | 0.46mi |
| 711 W 6th St Tyler, TX | 3.0 | 2.0 | 1854 | $1,850 | $1.00 | 13d | 1 | 0.49mi |
| 328 Mockingbird Ln Tyler, TX | 2.0 | 1.0 | 1200 | $950 | $0.79 | 13d | 1 | 0.52mi |
| 1215 S Lenox St Tyler, TX | 3.0 | 2.0 | 1090 | $1,264 | $1.16 | 43d | 1 | 0.60mi |
| 539 Williams Ct Tyler, TX | 2.0 | 1.0 | 1352 | $1,415 | $1.05 | 21d | 1 | 0.64mi |
| 2002 S Robertson Ave Tyler, TX | 3.0 | 2.5 | 1992 | $1,800 | $0.90 | 43d | 1 | 0.65mi |
| 526 S Bonner Ave Apt 4 Tyler, TX | 2.0 | 1.0 | 1120 | $1,175 | $1.05 | 21d | 1 | 0.71mi |
| 1104 W Park St Tyler, TX | 3.0 | 2.0 | 1440 | $1,650 | $1.15 | 21d | 1 | 0.78mi |
| 132 Rowland Pl Unit b Tyler, TX | 2.0 | 1.0 | 1170 | $1,295 | $1.11 | 21d | 1 | 0.84mi |
| 1107 Dogwood St Tyler, TX | 3.0 | 1.5 | 1620 | $1,475 | $0.91 | 21d | 1 | 0.85mi |
| 305 E Lake St Tyler, TX | 2.0 | 1.5 | 1287 | $1,695 | $1.32 | 13d | 1 | 0.86mi |
| 1403 S Donnybrook Ave Tyler, TX | 3.0 | 3.0 | 1834 | $2,150 | $1.17 | 43d | 1 | 0.90mi |
| 431 S College Ave Tyler, TX | 2.0 | 1.0 | 1380 | $1,750 | $1.27 | 43d | 1 | 0.90mi |
| 431 S College Ave Tyler, TX | 2.0 | 1.0 | 1380 | $1,650 | $1.20 | 21d | 1 | 0.90mi |
| 1224 S Azalea Dr Tyler, TX | 3.0 | 1.0 | 1276 | $1,300 | $1.02 | 13d | 1 | 0.94mi |
| 556 W Erwin St Tyler, TX | 3.0 | 3.5 | 1956 | $2,550 | $1.30 | 21d | 1 | 1.05mi |
| 548 W Erwin St Tyler, TX | 3.0 | 3.5 | 1956 | $2,495 | $1.28 | 43d | 1 | 1.06mi |
| 548 W Erwin St Tyler, TX | 3.0 | 3.5 | 1956 | $2,295 | $1.17 | 21d | 1 | 1.06mi |
| 540 W Erwin St Tyler, TX | 3.0 | 3.5 | 1956 | $4,000 | $2.04 | 43d | 1 | 1.06mi |
| 2720 S Broadway Ave Tyler, TX | 1.0–3.0 | 1.0–2.0 | 1064 | $1,330 | $1.25 | 13d | 14 | 1.35mi |
| 2302 Walton Rd Tyler, TX | 3.0 | 2.0 | 1248 | $1,600 | $1.28 | 21d | 1 | 1.42mi |
| 2006 W Oakwood St Tyler, TX | 3.0 | 2.0 | 1344 | $1,895 | $1.41 | 13d | 1 | 1.43mi |
| 1118 S Fleishel Ave Tyler, TX | 3.0 | 2.0 | 1425 | $1,495 | $1.05 | 13d | 1 | 1.43mi |
| 1692 Alamo Xing Tyler, TX | 4.0 | 2.0 | 1610 | $2,300 | $1.43 | 13d | 1 | 1.47mi |
Listing history 17 events
-
2026-06-19days on market $193,660 Active 38 DOM
-
2026-06-18days on market $193,660 Active 37 DOM
-
2026-06-17days on market $193,660 Active 36 DOM
-
2026-06-16days on market $193,660 Active 35 DOM
-
2026-06-15days on market $193,660 Active 34 DOM
-
2026-06-14days on market $193,660 Active 32 DOM
-
2026-06-13days on market $193,660 Active 31 DOM
-
2026-06-10days on market $193,660 Active 29 DOM
-
2026-06-09days on market $193,660 Active 28 DOM
-
2026-06-08days on market $193,660 Active 27 DOM
-
2026-06-07days on market $193,660 Active 26 DOM
-
2026-06-05days on market $193,660 Active 23 DOM
-
2026-06-02days on market $193,660 Active 21 DOM
-
2026-06-01days on market $193,660 Active 20 DOM
-
2026-05-31days on market $193,660 Active 19 DOM
-
2026-05-30days on market $193,660 Active 18 DOM
-
2026-05-12$193,660 Active 316-char remark
ⓘ Source: listings_history table (triggers on properties + properties_extension) + one-shot
backfill from property_details.listing_events for pre-trigger history.
Tax reassessment forecast TX · Resets to sale price
- Current annual tax
- $1,876 · $156/mo
- Projected year-2 tax
- $3,544 · $295/mo
- Expected delta
- +$1,668/yr (+$139/mo · 88.9%)
ⓘ Screening estimate from a state-policy table — verify with the county assessor before closing.
Climate risk First Street
- Flood 1/10 Low FEMA zone X (unshaded) · 0% chance over 30 yrs
- Wildfire 1/10 Low
- Heat 6/10 Major 7 d/yr ≥109°F today · 25 d/yr by 30 yrs out
- Wind 6/10 Major 60% chance of damaging wind over 30 yrs
- Air quality 2/10 Low 0 unhealthy d/yr today · 1 by 30 yrs out
Nearby sold comps map
Loading sold comps map…
Walkable amenities ~0.75 mi
Loading nearby amenities…
Taxation est. · year 1
- Rental income
- $20,135
- − Mortgage interest
- −$10,848
- − Property taxes
- −$1,876
- − Insurance
- −$968
- − Repairs & maintenance
- −$1,611
- − Management
- −$1,611
- − Depreciation
- −$5,634
- Taxable loss
- −$2,413
- Est. tax savings @ 24.0%
- +$579
- After-tax cash flow
- $1,454/yr
For passive investors: Depreciation is non-cash, so a rental often shows a tax loss while cash-flowing — sheltering income. Rental losses are passive: they offset passive income freely, and up to $25,000/yr can offset ordinary (W-2) income if you actively participate and your MAGI is under $100k (phasing out to $0 by $150k); unused losses carry forward. On sale, claimed depreciation is recaptured at up to 25%, and gains may owe capital-gains tax (a 1031 exchange can defer both). Figures are a year-1 estimate at your 24.0% rate — not tax advice; consult a CPA.
Schools (NCES district)
- District
- Tyler ISD
- NCES district ID
- 4843470
- Math proficiency
- 39% ▼ -4.00%
- Reading proficiency
- 38% ▼ -1.00%
- Median HH income
- $44,090
- Composite
- 32.69/100
- National rank
- #5650
- State rank
- #449 of 826 in TX
Livability — Tyler
- Score
- 75/100
- State rank
- #147
- US rank
- #4181
Category grades
Schools grade is shown separately in the Schools card above.
Census & demographics
- Census place
- Tyler, TX
- County
- Smith County · 180,570 people
- City population
- 127,842
- Metro
- Tyler, TX
- Population (ZIP)
- 36,344
- Household income
- $66,401
- Rent vs Own
- Severe rent burden
- 1116.0
Population outlook (Smith County) Hauer SSP2
- Today (2025)
- 248,890 people
- By 2030
- 261,665 · +5.1%
- By 2040
- 286,114 · +15.0%
- By 2050
- 308,006 · +23.8%
- By 2075
- 354,171 · +42.3%
- By 2100
- 372,828 · +49.8%
Race, ethnicity, and origin ACS 2023
- Neighborhood character
- Diverse neighborhood (Simpson 0.64)
- Race & ethnicity
- White 53% Black 21% Hispanic / Latino 19% Two or more races 8% Asian 2%
- Hispanic origin (detail)
- Mexican 17%
- Common ancestry
- Slovak 2% Italian 1% Lithuanian 1%
- Foreign-born
- 8% · Canada
- Languages at home
- 84% English-only · Spanish 14% Other Indo-European 1%
Political lean MEDSL · Smith
- 2024 margin
- Solid R (+45.1) · D 27.0% · R 72.1%
- 2008→2024 swing
- -5.6pp toward R · 2008: -39.5pp · 2024: -45.1pp
- All cycles
- 2024: R+45.1 2020: R+39.4 2016: R+43.9 2012: R+46.9 2008: R+39.5
Not yet ingested
- Civics
- —
Market trends
- HPI YoY
- ▼ -299.78%
- Current HPI
- 207.238
- Rent YoY
- ▲ 3.66%
- Metro
- Tyler, TX
- State GDP YoY
- ▲ 3.95%
- F500 in state
- 110
Industry mix (Fortune 500 HQ in TX)
| Industry | F500 HQs | Revenue |
|---|---|---|
| Energy | 16 | $1,198B |
|
||
| Technology | 5 | $198B |
|
||
| Engineering / Construction | 4 | $72B |
|
||
| Energy Services | 3 | $60B |
|
||
| Utilities | 3 | $41B |
|
||
| Healthcare | 2 | $330B |
|
||
Price history
1 event — show timeline
- 2026-05-12 Listed $193,660 GTAR
Property tax history
+3.8%/yrLatest (2024): $1,876 · +7.4% YoY. Source: county tax records.
Cash-flow waterfall
monthlySold comps — $/sqft
last 12 mo · ≤1 miLoading sold comps…