 🏷️ Likely Rental
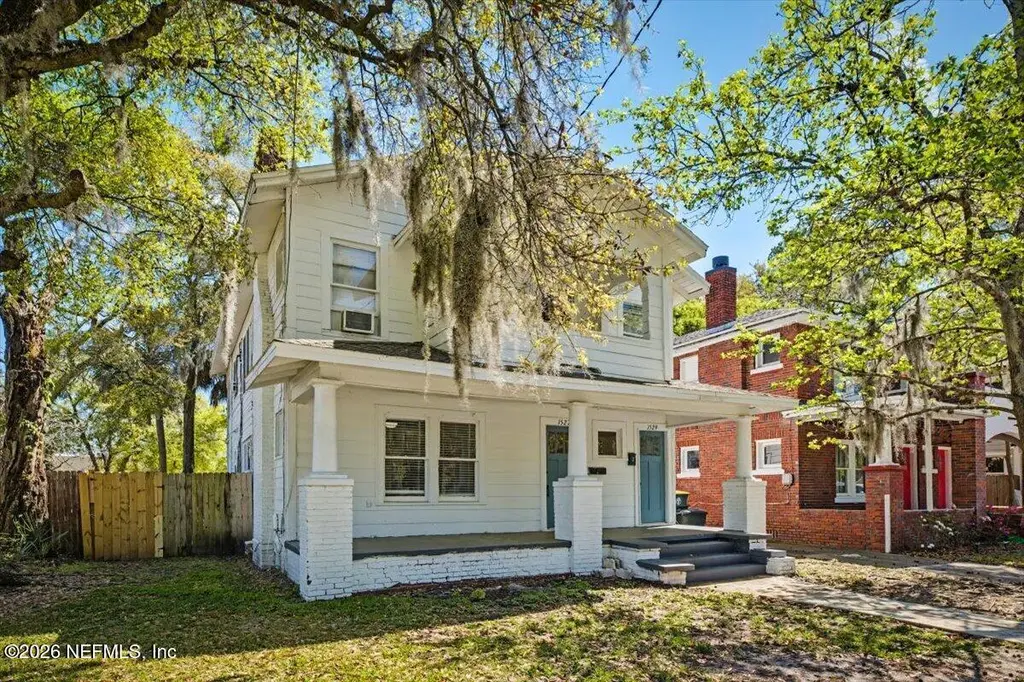
1527 Naldo Ave · Jacksonville, FL
Flood risk 9/10 · Severe
- FEMA flood zone
- X (shaded)
- Chance of flooding over 30 yrs
- 0.99%
- Est. flood insurance / yr
- $507 – $1,088
Fire risk 1/10 · Minimal
- Est. fire insurance / yr
- $947 – $1,759
Heat risk 9/10 · Severe
- Hot days now (above 107°F)
- 7 days/yr
- Hot days in 30 yrs
- 21 days/yr
Wind risk 9/10 · Severe
- Chance of severe wind over 30 yrs
- 99.0%
Air-quality risk 5/10 · Moderate
- Unhealthy air days now
- 7 days/yr
- Unhealthy air days in 30 yrs
- 7 days/yr
Risk factors via First Street. Map © Google.
Why this score? — see what drove the C- grade
The composite is a weighted blend of 9 inputs, each scored 0–100. Each bar is that input's sub-score; the figure is the points it added to the 100-point composite (weight × sub-score).
- ARV discount +15.0/15.0
- Cash flow +14.1/30.0
- DSCR +4.3/10.0
- Livability +4.2/5.0
- 1% rule +3.9/10.0
- Schools +3.9/10.0
- Rent growth +2.5/5.0
- Condition / age +2.5/5.0
- Appreciation +0.0/10.0
$399,900
🖨 Deal sheet (PDF) 📄 Offer letter ✓ Due diligence
Multi-family units
County records classify this as Multi-Family (5+ Unit). Listing-text estimate: 2 units. estimate disagrees with records
5+ unit building — per-unit beds/baths from public records are typically unavailable; the breakdown below (if shown) is an estimate from the listing text.
Listing remarks MLS
Step into the past while investing in your future with this unique duplex, perfectly situated in the heart of the historic San Marco. This property offers a rare opportunity to own a classic residence that has two distinct living units, each with its own entrance. Both are two bedroom one bath units, approximately 1040 square feet. Both units are occupied on month to month leases. Showings available during inspection periods only.
Key facts
- Storage potential
- Historic san marco
- Nice sized back yard
Tags
Property features AI
Finance
- Financial info: Currently used as investment and residential; Two total units; Unfurnished
- HOA & community: Not a senior community
Exterior
- Parking: Off-street parking; On-street parking
- Utilities: Public sewer; Electricity connected; Sewer connected
- Home design: Duplex (investment / residential); 1 to 2 levels; Entry level: 1; Faces northwest; 1 building; 2 stories total
- Construction: Shingle roof
- Exterior features: Fenced backyard; Many trees; Alley and city street access; Asphalt road frontage
Interior
- Kitchen: Electric oven; Electric range; Electric water heater
- Bedrooms: 4 bedrooms
- Flooring: Tile; Wood
- Bathrooms: 1 full bathroom
- Heating & cooling: Electric heating (varies by unit); Cooling: electric, split system, wall/window units (varies by unit)
- Interior features: Wood-burning fireplaces (2 total); Balcony
- Laundry & utility: In-unit laundry; Washer hookup; Electric dryer hookup
Neighborhood map
What this means for you Summary
Snapshot
- This is a 2 × 2-bed/0.5-bath units multifamily listed at $400k.
Deal economics
- At list price, monthly cash flow is $-9 ($-108/yr) — negative. Per door: $-5/mo.
- To cash-flow at today's rent, offer at most $398k (0.4% below list).
- To meet the 1% rule (rent ≥ 1% of price), the offer needs to be $356k (11.0% below list).
- Recommended offer: $356k (11.0% below list) — sets the bar for 1% rule.
- Cap rate 6.5% vs local median 3.9% in Jacksonville — top-decile yield for the area; either an underpriced asset or a hidden risk that comps aren't pricing in. Stress-test before assuming the spread holds.
Location & tenants
- Location reads 83/100 on livability (#50 in FL, #911 nationally) — a professional / high-income tenant draw. Strengths: amenities A+, commute A+, housing A+.
- Duval (urban): math 46% / reading 45% proficiency, ranked #48 of 73 in FL (top 66%) — families likely to look elsewhere, expect single-tenant / working-renter base with shorter leases.
- Zoned schools: Hendricks Avenue Elementary School (math 72% / reading 74%, grade A, #271 of 2,144 statewide, top 13%, 614 students, 24% FRL); Alfred I. Dupont Middle School (math 23% / reading 24%, grade F, #536 of 571 statewide, top 95%, 641 students, 59% FRL); Samuel W. Wolfson High School (math 48% / reading 70%, grade C+, #113 of 667 statewide, top 17%, 922 students, 20% FRL) — zoned schools average 34% FRL vs 49% district-wide (15 pts lower); this property's tenant base skews higher-income than the district average.
- Market conditions: Rents soft (-0.2%/yr); 226 active listings in the ZIP; 10 comparable units currently listed for rent nearby; rentals at typical pace (median 16d on market — plan ~3-4 weeks tenant-placement turnaround); 6,503 units permitted in Duval County in 2024 (1,131 in 5+ unit buildings).
- At $3,561/mo this rent would consume 66% of the median local household income ($65k/yr) (locally 1730% of renters already pay >50% of income on rent) — very limited rent-growth headroom before tenants either downsize or default.
Forward outlook
- Local home prices are declining (-3.0%/yr); year-one equity from $3k of loan paydown is wiped out by about $12k of value loss. Plan a longer hold.
- Duval County population projected at +19% by 2050 — long-run rental-demand tailwind backs the buy-and-hold thesis.
Negotiation context
- It's been on market 90 days — a 6% lower offer ($376k) is reasonable based on typical stale-listing flexibility.
- 3 sale attempts; this cycle's ask has dropped $75k (16%) from the opening price — seller is motivated, your offer sets the floor, not the list.
- Current owner paid $17k; list at $400k implies a 2252% gain — meaningful room to come down on a strong offer.
Risks & watch-outs
- Watch-outs: flood insurance adds $66/mo; built in 1926 — expect roof / HVAC / electrical / plumbing capex.
- Climate carrying-cost: severe flood risk; severe wind risk, 99% chance of damaging wind over 30y; extreme-heat days projected 7→21/yr by 2055 (HVAC capex compounding) — expect insurance premiums to compound above CPI over the hold.
Questions for the listing agent
- What do current leases actually rent for vs. the listed asking? Can we see a recent rent roll and the last 12 months of T-12 income?
- It's been on market 90 days. Have you received any prior offers? Is the seller open to a 11% concession, seller financing, or rate buy-down credit?
- Can we see the unit-by-unit rent roll, current vacancy, and any below-market leases? What's the average tenancy length?
- What capital expenditures (roof, boiler, parking lot, exteriors) have been made in the last 5 years, and what's planned in the next 2?
- Built in 1926 — when were the roof, HVAC, electrical panel, plumbing, and water heater last replaced?
- What's the actual annual flood-insurance premium (NFIP or private), and is the property in a SFHA with mandatory coverage?
- Why hasn't it sold? Are there any deal-killer items the seller is aware of (foundation, flood, title, zoning, code violations)?
- Is there a deadline driving the sale (1031 exchange, divorce, estate, relocation)? That informs how much negotiation room exists.
- Schools are B-rated — typically a magnet for longer-tenancy family renters. What's the average tenant stay here, and is there a school-zone premium baked into asking?
- What's the average days-on-market for RENTAL listings here right now (not sales)? A rising rental-DOM trend means longer vacancies and softer asking-rent achievability than the comps imply.
- What's the recent tenant-quality profile in this submarket — average credit score on applications, eviction rate, late-payment / NSF rate, and stable-employment percentage? A property-management company in the area should have these aggregated.
- How much new apartment / multifamily construction is in the pipeline within 1–3 miles? Heavy new supply (>2% of stock underway) typically softens rents 12–24 months out; light construction supports rent growth.
Investment metrics
- 1% rule
- 0.89% ✗
- Cap rate
- 6.47%
- Cash-on-cash
- 0.62%
- DSCR
- 1.03
- GRM
- 9.4
CMA / ARV
- ARV (on-the-fly)
- $557,440
- Comps found
- 3
Show comp detail 3 sales within ~0.75 mi
| Address | Dist | Beds/Ba | Sqft | Sold | Price | $/sf | Match |
|---|---|---|---|---|---|---|---|
| 1535 Belmonte Ave | 0.14mi | 5/4.0 (+1) | 2,231 (+7%) | 6mo | $715,000 | $320 | 63 |
| 1331 Lasalle St | 0.07mi | 4/4.0 | 2,198 (+6%) | 22mo | $590,000 | $268 | 61 |
| 1321 Landon Ave #A-D | 0.22mi | 4/4.0 | 2,376 (+14%) | 7mo | $500,000 | $210 | 52 |
Match score weights: distance 35% · size 25% · config 20% · recency 20%. Top-matched comps best support the ARV.
Projected returns pro-forma
-3.0% appreciation · 0.0% rent growth · sell at horizon
- IRR
- -19.9%
- Equity multiple
- 0.32×
- Total profit
- $-75,722
- Equity at exit
- $59,626
- IRR
- -21.4%
- Equity multiple
- 0.05×
- Total profit
- $-106,644
- Equity at exit
- $34,576
Cash invested: $111,972 (down + closing). Projections, not guarantees.
Landlord ↔ Tenant lean methodology
- Overall (STATE)
- 87 Strongly Landlord-Friendly
- State Florida
- 87 Strongly Landlord-Friendly · R+3
- County
- — inherits STATE
- City
- — inherits STATE
ZIP-level market 32207
- Rents YoY
- -0.2%
- Active inventory
- 226
- Price-to-rent
- 18.7×
Monthly cashflow live
- Estimated rent
- $3,561 high interval (Pro) →
- Mortgage (P&I)
- −$2,097
- Tax from tax record
- −$492 /mo · $5,904/yr
- Insurance
- −$167
- Flood insurance flood zone
- −$66 /mo · $798/yr
- HOA
- −$0
- Vacancy / Maint / Mgmt
- −$748
- Net cashflow
- $-9
Break-even live
Sensitivity live
| Price | -10% $217 | -5% $104 | +0% $-9 | +5% $-122 | +10% $-235 |
|---|---|---|---|---|---|
| Rent | -10% $-290 | -5% $-150 | +0% $-9 | +5% $132 | +10% $272 |
| Rate | -1.0pp $192 | -0.5pp $93 | base $-9 | +0.5pp $-113 | +1.0pp $-218 |
2-unit breakdown (identical units grouped — click to expand)
| Units | Beds | Baths | Est. rent |
|---|---|---|---|
| 2× units | 2 | 0.5 | $3,562 |
| #1 | 2 | 0.5 | $1,781 |
| #2 | 2 | 0.5 | $1,781 |
| Total (2 units) | $3,561 | ||
UW: 25.0% down · 7.5% · 30yr · 1.5% tax · 5.0% vac · 8.0% maint · 8.0% mgmt
Financing live
Cash to close
- Down payment
- $99,975
- Closing costs
- $11,997
- Reserves months
- —
- Total cash needed
- —
Loan-product check · same deal, 3 products live
Conventional
25% down · 7.5% · 30yr
- Down + closing
- —
- Monthly P&I
- —
- Monthly cashflow
- —
- DSCR
- —
- Eligible?
- —
Personal DTI + credit; lowest rate.
DSCR
20% down · 8.5% · 30yr
- Down + closing
- —
- Monthly P&I
- —
- Monthly cashflow
- —
- DSCR
- —
- Eligible?
- —
No personal income docs; deal must DSCR.
Hard money
10% down · 12.0% · 12mo
- Down + closing
- —
- Monthly P&I
- —
- Monthly cashflow
- —
- DSCR
- —
- Eligible?
- —
Short-term bridge; refi at stabilization.
Rent comps 10 comps
| Address | Beds | Baths | Sqft | Rent | $/sqft | DOM | Units | Dist |
|---|---|---|---|---|---|---|---|---|
| 1651 Flagler Ave Jacksonville, FL | 3.0 | 2.5 | 1701 | $2,100 | $1.23 | 18d | 1 | 0.17mi |
| 1900 Olevia St Jacksonville, FL | 1.0–3.0 | 1.0–3.0 | 1127 | $2,693 | $2.39 | 4d | 6 | 0.55mi |
| 1655 Prudential Dr Jacksonville, FL | 3.0 | 1.0–3.0 | 1113 | $3,314 | $2.98 | 4d | 13 | 0.55mi |
| 1928 Prudential Dr Jacksonville, FL | 3.0 | 3.5 | 1745 | $3,350 | $1.92 | 25d | 1 | 0.62mi |
| 1401 Riverplace Blvd Jacksonville, FL | 1.0–3.0 | 1.0–2.0 | 1401 | $4,424 | $3.16 | 6d | 9 | 0.64mi |
| 2054 Prudential Dr Jacksonville, FL | 3.0 | 3.5 | 1990 | $6,000 | $3.02 | 15d | 1 | 0.73mi |
| 2056 Prudential Dr Jacksonville, FL | 3.0 | 3.5 | 2144 | $6,495 | $3.03 | 16d | 1 | 0.73mi |
| 1905 Promenade Way Jacksonville, FL | 1.0–3.0 | 1.0–3.0 | 1045 | $2,549 | $2.44 | 3d | 35 | 0.81mi |
| 138 E Duval St Jacksonville, FL | 3.0 | 1.5 | 1450 | $3,200 | $2.21 | 25d | 1 | 1.28mi |
| 343 E Church St Jacksonville, FL | 3.0 | 3.5 | 1530 | $2,195 | $1.43 | 5d | 1 | 1.34mi |
Listing history 23 events
-
2026-06-17days on market $399,900 Active 90 DOM
-
2026-06-16days on market $399,900 Active 89 DOM
-
2026-06-15days on market $399,900 Active 88 DOM
-
2026-06-13days on market $399,900 Active 85 DOM
-
2026-06-10days on market $399,900 Active 82 DOM
-
2026-06-08days on market $399,900 Active 81 DOM
-
2026-06-07pricedays on market $399,900 Active 80 DOM
-
2026-06-03days on market $409,900 Active 76 DOM
-
2026-06-02days on market $409,900 Active 75 DOM
-
2026-06-01days on market $409,900 Active 74 DOM
-
2026-05-31days on market $409,900 Active 73 DOM
-
2026-05-08price $409,900
-
2026-04-23price $439,995
-
2026-03-12$474,900 Active
-
2026-02-24historical 436-char remark
Show marketing remark (436 chars)
Step into the past while investing in your future with this unique duplex, perfectly situated in the heart of the historic San Marco. This property offers a rare opportunity to own a classic residence that has two distinct living units, each with its own entrance. Both are two bedroom one bath units, approximately 1040 square feet. Both units are occupied on month to month leases. Showings available during inspection periods only.
-
2026-02-11price $475,000 436-char remark
Show marketing remark (436 chars)
Step into the past while investing in your future with this unique duplex, perfectly situated in the heart of the historic San Marco. This property offers a rare opportunity to own a classic residence that has two distinct living units, each with its own entrance. Both are two bedroom one bath units, approximately 1040 square feet. Both units are occupied on month to month leases. Showings available during inspection periods only.
-
2026-01-02price $499,000 436-char remark
Show marketing remark (436 chars)
Step into the past while investing in your future with this unique duplex, perfectly situated in the heart of the historic San Marco. This property offers a rare opportunity to own a classic residence that has two distinct living units, each with its own entrance. Both are two bedroom one bath units, approximately 1040 square feet. Both units are occupied on month to month leases. Showings available during inspection periods only.
-
2025-12-10price $509,000 436-char remark
Show marketing remark (436 chars)
Step into the past while investing in your future with this unique duplex, perfectly situated in the heart of the historic San Marco. This property offers a rare opportunity to own a classic residence that has two distinct living units, each with its own entrance. Both are two bedroom one bath units, approximately 1040 square feet. Both units are occupied on month to month leases. Showings available during inspection periods only.
-
2025-11-25historical 436-char remark
Show marketing remark (436 chars)
Step into the past while investing in your future with this unique duplex, perfectly situated in the heart of the historic San Marco. This property offers a rare opportunity to own a classic residence that has two distinct living units, each with its own entrance. Both are two bedroom one bath units, approximately 1040 square feet. Both units are occupied on month to month leases. Showings available during inspection periods only.
-
2025-11-24$549,000 Active 436-char remark
Show marketing remark (436 chars)
Step into the past while investing in your future with this unique duplex, perfectly situated in the heart of the historic San Marco. This property offers a rare opportunity to own a classic residence that has two distinct living units, each with its own entrance. Both are two bedroom one bath units, approximately 1040 square feet. Both units are occupied on month to month leases. Showings available during inspection periods only.
-
1976-08-25soldstatus $17,000
-
1973-04-06soldstatus $16,500
ⓘ Source: listings_history table (triggers on properties + properties_extension) + one-shot
backfill from property_details.listing_events for pre-trigger history.
Tax reassessment forecast FL · Resets to sale price
- Current annual tax
- $5,904 · $492/mo
- Projected year-2 tax
- $5,904 · $492/mo
- Expected delta
- $0/yr ($0/mo · 0.0%)
ⓘ Screening estimate from a state-policy table — verify with the county assessor before closing.
Climate risk First Street
- Flood 9/10 Extreme FEMA zone X (shaded) · 99% chance over 30 yrs
- Wildfire 1/10 Low
- Heat 9/10 Extreme 7 d/yr ≥107°F today · 21 d/yr by 30 yrs out
- Wind 9/10 Extreme 99% chance of damaging wind over 30 yrs
- Air quality 5/10 Major 7 unhealthy d/yr today · 7 by 30 yrs out
Nearby sold comps map
Loading sold comps map…
Walkable amenities ~0.75 mi
Loading nearby amenities…
Taxation est. · year 1
- Rental income
- $42,732
- − Mortgage interest
- −$22,401
- − Property taxes
- −$5,904
- − Insurance
- −$2,797
- − Repairs & maintenance
- −$3,419
- − Management
- −$3,419
- − Depreciation
- −$11,633
- Taxable loss
- −$6,840
- Est. tax savings @ 24.0%
- +$1,642
- After-tax cash flow
- $1,533/yr
For passive investors: Depreciation is non-cash, so a rental often shows a tax loss while cash-flowing — sheltering income. Rental losses are passive: they offset passive income freely, and up to $25,000/yr can offset ordinary (W-2) income if you actively participate and your MAGI is under $100k (phasing out to $0 by $150k); unused losses carry forward. On sale, claimed depreciation is recaptured at up to 25%, and gains may owe capital-gains tax (a 1031 exchange can defer both). Figures are a year-1 estimate at your 24.0% rate — not tax advice; consult a CPA.
Schools (NCES district)
- District
- Duval
- NCES district ID
- 1200480
- Math proficiency
- 46% ▼ -11.00%
- Reading proficiency
- 45% ▼ -4.00%
- Median HH income
- $48,987
- Composite
- 38.97/100
- National rank
- #4076
- State rank
- #48 of 73 in FL
Livability — Jacksonville
- Score
- 83/100
- State rank
- #50
- US rank
- #911
Category grades
Schools grade is shown separately in the Schools card above.
Census & demographics
- Census place
- Jacksonville, FL
- County
- Duval County · 1,015,274 people
- City population
- 979,034
- Metro
- Jacksonville, FL
- Population (ZIP)
- 36,998
- Household income
- $65,234
- Rent vs Own
- Severe rent burden
- 1730.0
Population outlook (Duval County) Hauer SSP2
- Today (2025)
- 1,013,010 people
- By 2030
- 1,059,228 · +4.6%
- By 2040
- 1,141,439 · +12.7%
- By 2050
- 1,205,258 · +19.0%
- By 2075
- 1,324,282 · +30.7%
- By 2100
- 1,319,620 · +30.3%
Race, ethnicity, and origin ACS 2023
- Neighborhood character
- Diverse neighborhood (Simpson 0.63)
- Race & ethnicity
- White 56% Black 16% Hispanic / Latino 15% Asian 9% Two or more races 9%
- Hispanic origin (detail)
- Mexican 2% Puerto Rican 3% Cuban 4%
- Common ancestry
- Slovak 2% Italian 2% Serbian 1%
- Foreign-born
- 17% · Canada, Philippines, China
- Languages at home
- 76% English-only · Spanish 12% Other Asian/Pacific 5% Arabic 1%
Political lean MEDSL · Duval
- 2024 margin
- Toss-up / Even · D 48.7% · R 50.1% · Other 1.2%
- 2008→2024 swing
- +0.4pp no change · 2008: -1.9pp · 2024: -1.5pp
- All cycles
- 2024: R+1.5 2020: D+3.8 2016: R+1.5 2012: R+3.6 2008: R+1.9
Not yet ingested
- Civics
- —
Market trends
- HPI YoY
- ▼ -299.33%
- Current HPI
- 310.9037
- Rent YoY
- ▼ -0.20%
- Metro
- Jacksonville, FL
- State GDP YoY
- ▲ 3.28%
- F500 in state
- 36
Industry mix (Fortune 500 HQ in FL)
| Industry | F500 HQs | Revenue |
|---|---|---|
| Industrial Technology | 2 | $29B |
|
||
| Insurance | 2 | $17B |
|
||
| Retail | 1 | $60B |
|
||
| Technology Distribution | 1 | $58B |
|
||
| Homebuilding | 1 | $35B |
|
||
| Technology Manufacturing | 1 | $35B |
|
||
Price history
+2384.2% since first listed12 events — show timeline
- 2026-05-08 Price Changed $409,900 realMLS
- 2026-04-23 Price Changed $439,995 realMLS
- 2026-03-12 Listed $474,900 realMLS
- 2026-02-24 Listing Removed — realMLS
- 2026-02-11 Price Changed $475,000 realMLS
- 2026-01-02 Price Changed $499,000 realMLS
- 2025-12-10 Price Changed $509,000 realMLS
- 2025-11-25 Listing Removed — realMLS
- 2025-11-24 Listed $549,000 realMLS
- 2025-11-24 Listed $549,000 realMLS
- 1976-08-25 Sold (Public Records) $17,000 Public Records
- 1973-04-06 Sold (Public Records) $16,500 Public Records
Property tax history
+8.6%/yrLatest (2025): $5,904 · +8.3% YoY. Source: county tax records.
Cash-flow waterfall
monthlySold comps — $/sqft
last 12 mo · ≤1 miLoading sold comps…