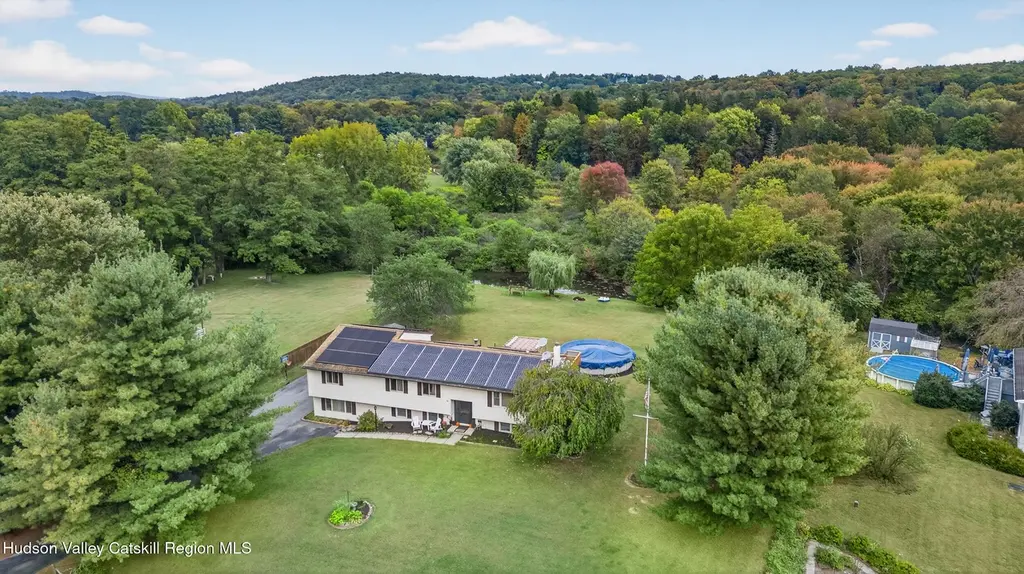
43 Heritage Rd · Salt Point, NY
Flood risk 1/10 · Minimal
- FEMA flood zone
- X (unshaded)
- Chance of flooding over 30 yrs
- 0.0%
- Est. flood insurance / yr
- $473 – $860
Fire risk 3/10 · Minor
- Est. fire insurance / yr
- $691 – $1,283
Heat risk 4/10 · Minor
- Hot days now (above 97°F)
- 7 days/yr
- Hot days in 30 yrs
- 15 days/yr
Wind risk 4/10 · Minor
- Chance of severe wind over 30 yrs
- 13.0%
Air-quality risk 2/10 · Minimal
- Unhealthy air days now
- 1 days/yr
- Unhealthy air days in 30 yrs
- 3 days/yr
Risk factors via First Street. Map © Google.
Why this score? — see what drove the A- grade
The composite is a weighted blend of 9 inputs, each scored 0–100. Each bar is that input's sub-score; the figure is the points it added to the 100-point composite (weight × sub-score).
- Cash flow +30.0/30.0
- 1% rule +10.0/10.0
- DSCR +10.0/10.0
- Appreciation +10.0/10.0
- ARV discount +9.0/15.0
- Schools +5.8/10.0
- Rent growth +2.5/5.0
- Condition / age +2.5/5.0
- Livability +1.7/5.0
$599,000
🖨 Deal sheet (PDF) 📄 Offer letter ✓ Due diligence
Listing remarks MLS
Tucked away in the scenic beauty of Clinton Corners, this home offers privacy, versatility, and Hudson Valley charm. Set on over an acre of picturesque land, this spacious home offers 3 bedrooms and 4 full bathrooms, thoughtfully designed to accommodate a variety of lifestyles. From the moment you arrive, you'll appreciate the peaceful setting and the rare opportunity to enjoy nature right in your own backyard, including direct access to a serene waterway perfect for swimming, fishing, or paddle boarding--creating a true lifestyle experience. Inside, the home provides exceptional flexibility, featuring a additional living space ideal for extended living arrangements, guests, or potential income opportunities, along with two additional rooms on the lower level that can be customized as a home office, fitness area, media room, or whatever best suits the next owner's needs. Step outside and enjoy summer days in the above-ground pool, all while benefiting from energy-efficient solar panels, with approximately three-quarters already paid off, offering long-term savings and sustainability. Ideally located in the heart of the Hudson Valley, this property is near the charming villages of Rhinebeck and Millbrook, known for their dining, shopping, and boutique experiences, as well as convenient access to the Taconic State Parkway for commuting. The area is rich with local wineries, farms, farm-to-table restaurants, scenic hiking trails, and year-round attractions including farmers markets, festivals, and equestrian events. Whether you are searching for a full-time residence, weekend retreat, or multi-generational living opportunity, this home offers a unique combination of comfort, flexibility, and lifestyle in one of the Hudson Valley's most desirable settings.
Key facts
- Scenic hiking trails
- Above-ground pool
- 1.03 acre lot
Tags
Neighborhood map
What this means for you Summary
Snapshot
- This is a 4-bed/3.0-bath single-family listed at $599k.
Deal economics
- At list price, monthly cash flow is $13k ($160k/yr) — positive.
- The deal already cash-flows at list — no discount required.
- Meets the 1% rule at list price ($22k rent vs $599k).
- Recommended offer: $581k (3.0% below list) — sets the bar for market timing.
- Cap rate 33.0% vs local median 2.3% in Salt Point — top-decile yield for the area; either an underpriced asset or a hidden risk that comps aren't pricing in. Stress-test before assuming the spread holds.
Location & tenants
- Location reads 34/100 on livability (#1,193 in NY) — a limited-amenity area; tenant pool skews transient or value-seeking. Strengths: crime A; Watch: amenities F, commute F, employment F.
- Millbrook Central School District (rural): math 65% / reading 63% proficiency, ranked #198 of 755 in NY (top 26%) — acceptable for families but not a draw, mixed tenant base, ~2y average lease; only 17% free/reduced lunch — higher-income household profile.
- Zoned schools: Elm Drive Elementary School (192 students, 22% FRL); Millbrook Middle School (math 42% / reading 67%, grade B-, #214 of 729 statewide, top 31%, 202 students, 37% FRL); Millbrook High School (math 87%, 271 students, 34% FRL).
- Market conditions: 38 active listings in the ZIP; 1 comparable units currently listed for rent nearby; 620 units permitted in Dutchess County in 2024 (242 in 5+ unit buildings).
Forward outlook
- In year one you build about $64k of equity ($4k loan paydown + $60k appreciation (10.0% local appreciation)).
- Dutchess County population projected at -11% by 2050 — secular population decline; favor cash flow + early exit over multi-decade hold.
- At projected returns (10.0% appreciation + 3.0% rent growth), your $168k cash investment doubles in ~1 year — after that, you're playing with house money.
- By year 2, paydown + projected appreciation supports a ~$103k cash-out refi (75% LTV) — recoverable capital for the next deal without selling this one.
Negotiation context
- It's been on market 49 days — a 3% lower offer ($581k) is reasonable based on typical stale-listing flexibility.
- Current owner paid $52k; list at $599k implies a 1041% gain — meaningful room to come down on a strong offer.
Questions for the listing agent
- It's been on market 49 days. Have you received any prior offers? Is the seller open to a 3% concession, seller financing, or rate buy-down credit?
- Built in 1979 — when were the roof, HVAC, electrical panel, plumbing, and water heater last replaced?
- Is there a deadline driving the sale (1031 exchange, divorce, estate, relocation)? That informs how much negotiation room exists.
- Schools are F-rated, which usually means shorter tenancies and higher turnover. Who's the typical renter profile here, and what's been the actual vacancy rate?
- What's the average days-on-market for RENTAL listings here right now (not sales)? A rising rental-DOM trend means longer vacancies and softer asking-rent achievability than the comps imply.
- What's the recent tenant-quality profile in this submarket — average credit score on applications, eviction rate, late-payment / NSF rate, and stable-employment percentage? A property-management company in the area should have these aggregated.
- How much new for-sale + rental construction is in the pipeline within 1–3 miles? Heavy new supply typically softens prices + rents 12–24 months out; constrained supply supports both.
Investment metrics
- 1% rule
- 3.67% ✓
- Cap rate
- 33.04%
- Cash-on-cash
- 95.51%
- DSCR
- 5.25
- GRM
- 2.3
CMA / ARV
- ARV (median comp)
- $620,255
- List price
- $599,000
- Delta
- -3.43%
- Verdict
- FAIR
- Comps
- 10 within 1.0 mi
Show comp detail 1 sale within ~0.75 mi
| Address | Dist | Beds/Ba | Sqft | Sold | Price | $/sf | Match |
|---|---|---|---|---|---|---|---|
| 2415 Salt Point Tpke | 0.54mi | 5/3.0 (+1) | 2,784 (-8%) | 17mo | $550,000 | $198 | 42 |
Match score weights: distance 35% · size 25% · config 20% · recency 20%. Top-matched comps best support the ARV.
Projected returns pro-forma
10.0% appreciation · 3.0% rent growth · sell at horizon
- IRR
- —
- Equity multiple
- 8.02×
- Total profit
- $1,176,752
- Equity at exit
- $539,627
- IRR
- 99.7%
- Equity multiple
- 17.68×
- Total profit
- $2,797,232
- Equity at exit
- $1,163,725
Cash invested: $167,720 (down + closing). Projections, not guarantees.
Landlord ↔ Tenant lean methodology
- Overall (STATE)
- 15 Strongly Tenant-Friendly
- State New York
- 15 Strongly Tenant-Friendly · D+10
- County
- — inherits STATE
- City
- — inherits STATE
ZIP-level market 12514
- Home prices YoY
- 11.6%
- Active inventory
- 38
- Price-to-rent
- 2.3×
Monthly cashflow live
- Estimated rent
- $22,000 medium interval (Pro) →
- Mortgage (P&I)
- −$3,141
- Tax from tax record
- −$639 /mo · $7,673/yr
- Insurance
- −$250
- HOA
- −$0
- Vacancy / Maint / Mgmt
- −$4,620
- Net cashflow
- $13,350
Break-even live
Sensitivity live
| Price | -10% $13,689 | -5% $13,519 | +0% $13,350 | +5% $13,180 | +10% $13,011 |
|---|---|---|---|---|---|
| Rent | -10% $11,612 | -5% $12,481 | +0% $13,350 | +5% $14,219 | +10% $15,088 |
| Rate | -1.0pp $13,651 | -0.5pp $13,502 | base $13,350 | +0.5pp $13,195 | +1.0pp $13,037 |
UW: 25.0% down · 7.5% · 30yr · 1.5% tax · 5.0% vac · 8.0% maint · 8.0% mgmt
Financing live
Cash to close
- Down payment
- $149,750
- Closing costs
- $17,970
- Reserves months
- —
- Total cash needed
- —
Loan-product check · same deal, 3 products live
Conventional
25% down · 7.5% · 30yr
- Down + closing
- —
- Monthly P&I
- —
- Monthly cashflow
- —
- DSCR
- —
- Eligible?
- —
Personal DTI + credit; lowest rate.
DSCR
20% down · 8.5% · 30yr
- Down + closing
- —
- Monthly P&I
- —
- Monthly cashflow
- —
- DSCR
- —
- Eligible?
- —
No personal income docs; deal must DSCR.
Hard money
10% down · 12.0% · 12mo
- Down + closing
- —
- Monthly P&I
- —
- Monthly cashflow
- —
- DSCR
- —
- Eligible?
- —
Short-term bridge; refi at stabilization.
Rent comps 1 comps
| Address | Beds | Baths | Sqft | Rent | $/sqft | DOM | Units | Dist |
|---|---|---|---|---|---|---|---|---|
| 1282 Hollow Rd Clinton Corners, NY | 4.0 | 3.5 | 2650 | $22,000 | $8.30 | 15d | 1 | 1.18mi |
Listing history 5 events
-
2026-06-01status $599,000 Pending 49 DOM
-
2026-06-01days on market $599,000 Active Under Contract 49 DOM
-
2026-05-31days on market $599,000 Active Under Contract 48 DOM
-
2026-04-14$599,000 Active 1782-char remark
Show marketing remark (1782 chars)
Tucked away in the scenic beauty of Clinton Corners, this home offers privacy, versatility, and Hudson Valley charm. Set on over an acre of picturesque land, this spacious home offers 3 bedrooms and 4 full bathrooms, thoughtfully designed to accommodate a variety of lifestyles. From the moment you arrive, you'll appreciate the peaceful setting and the rare opportunity to enjoy nature right in your own backyard, including direct access to a serene waterway perfect for swimming, fishing, or paddle boarding--creating a true lifestyle experience. Inside, the home provides exceptional flexibility, featuring a additional living space ideal for extended living arrangements, guests, or potential income opportunities, along with two additional rooms on the lower level that can be customized as a home office, fitness area, media room, or whatever best suits the next owner's needs. Step outside and enjoy summer days in the above-ground pool, all while benefiting from energy-efficient solar panels, with approximately three-quarters already paid off, offering long-term savings and sustainability. Ideally located in the heart of the Hudson Valley, this property is near the charming villages of Rhinebeck and Millbrook, known for their dining, shopping, and boutique experiences, as well as convenient access to the Taconic State Parkway for commuting. The area is rich with local wineries, farms, farm-to-table restaurants, scenic hiking trails, and year-round attractions including farmers markets, festivals, and equestrian events. Whether you are searching for a full-time residence, weekend retreat, or multi-generational living opportunity, this home offers a unique combination of comfort, flexibility, and lifestyle in one of the Hudson Valley's most desirable settings.
-
1979-07-16soldstatus $52,500
ⓘ Source: listings_history table (triggers on properties + properties_extension) + one-shot
backfill from property_details.listing_events for pre-trigger history.
Tax reassessment forecast NY · Partial reset (capped growth)
- Current annual tax
- $7,673 · $639/mo
- Projected year-2 tax
- $8,898 · $741/mo
- Expected delta
- +$1,225/yr (+$102/mo · 16.0%)
ⓘ Screening estimate from a state-policy table — verify with the county assessor before closing.
Climate risk First Street
- Flood 1/10 Low FEMA zone X (unshaded) · 0% chance over 30 yrs
- Wildfire 3/10 Moderate
- Heat 4/10 Moderate 7 d/yr ≥97°F today · 15 d/yr by 30 yrs out
- Wind 4/10 Moderate 13% chance of damaging wind over 30 yrs
- Air quality 2/10 Low 1 unhealthy d/yr today · 3 by 30 yrs out
Nearby sold comps map
Loading sold comps map…
Walkable amenities ~0.75 mi
Loading nearby amenities…
Taxation est. · year 1
- Rental income
- $264,000
- − Mortgage interest
- −$33,553
- − Property taxes
- −$7,673
- − Insurance
- −$2,995
- − Repairs & maintenance
- −$21,120
- − Management
- −$21,120
- − Depreciation
- −$17,425
- Taxable income
- $160,114
- Est. tax owed @ 24.0%
- −$38,427
- After-tax cash flow
- $121,770/yr
For passive investors: Depreciation is non-cash, so a rental often shows a tax loss while cash-flowing — sheltering income. Rental losses are passive: they offset passive income freely, and up to $25,000/yr can offset ordinary (W-2) income if you actively participate and your MAGI is under $100k (phasing out to $0 by $150k); unused losses carry forward. On sale, claimed depreciation is recaptured at up to 25%, and gains may owe capital-gains tax (a 1031 exchange can defer both). Figures are a year-1 estimate at your 24.0% rate — not tax advice; consult a CPA.
Schools (NCES district)
- District
- Millbrook Central School District
- NCES district ID
- 3619380
- Math proficiency
- 65% ▲ 1.00%
- Reading proficiency
- 63% ▲ 5.00%
- Median HH income
- $77,504
- Composite
- 58.47/100
- National rank
- #2061
- State rank
- #198 of 755 in NY
Livability — Salt Point
- Score
- 34/100
- State rank
- #1193
- US rank
- #27748
Category grades
Schools grade is shown separately in the Schools card above.
Census & demographics
- City population
- 2,306
- Population (ZIP)
- 3,120
Population outlook (Dutchess County) Hauer SSP2
- Today (2025)
- 291,768 people
- By 2030
- 287,131 · -1.6%
- By 2040
- 274,881 · -5.8%
- By 2050
- 259,971 · -10.9%
- By 2075
- 235,366 · -19.3%
- By 2100
- 208,786 · -28.4%
Race, ethnicity, and origin ACS 2023
- Neighborhood character
- Predominantly White (94%)
- Race & ethnicity
- White 94% Hispanic / Latino 3% Two or more races 2% Asian 1%
- Common ancestry
- Romanian 5% Portuguese 4% Scotch-Irish 3%
- Foreign-born
- 3% · Canada
- Languages at home
- 97% English-only · Other Asian/Pacific 1% French/Haitian/Cajun 1% Other Indo-European 0%
Political lean MEDSL · Dutchess
- 2024 margin
- Lean D (+5.4) · D 52.7% · R 47.3%
- 2008→2024 swing
- -3.2pp toward R · 2008: 8.6pp · 2024: 5.4pp
- All cycles
- 2024: D+5.4 2020: D+9.6 2016: R+1.1 2012: D+6.6 2008: D+8.6
Not yet ingested
- Civics
- —
Market trends
- HPI YoY
- ▲ 31.24%
- Current HPI
- 300.533
- Rent YoY
- —
- Metro
- —
- State GDP YoY
- ▲ 2.60%
- F500 in state
- 92
Industry mix (Fortune 500 HQ in NY)
| Industry | F500 HQs | Revenue |
|---|---|---|
| Financial Services | 10 | $950B |
|
||
| Consumer Goods | 9 | $162B |
|
||
| Insurance | 4 | $225B |
|
||
| Telecommunications | 2 | $144B |
|
||
| Pharmaceuticals | 2 | $112B |
|
||
| Media / Entertainment | 2 | $69B |
|
||
Price history
+1041.0% since first listed2 events — show timeline
- 2026-04-14 Listed $599,000 HVCRMLS
- 1979-07-16 Sold (Public Records) $52,500 Public Records
Property tax history
+5.9%/yrLatest (2025): $7,673 · -0.3% YoY. Source: county tax records.
Cash-flow waterfall
monthlySold comps — $/sqft
last 12 mo · ≤1 miLoading sold comps…