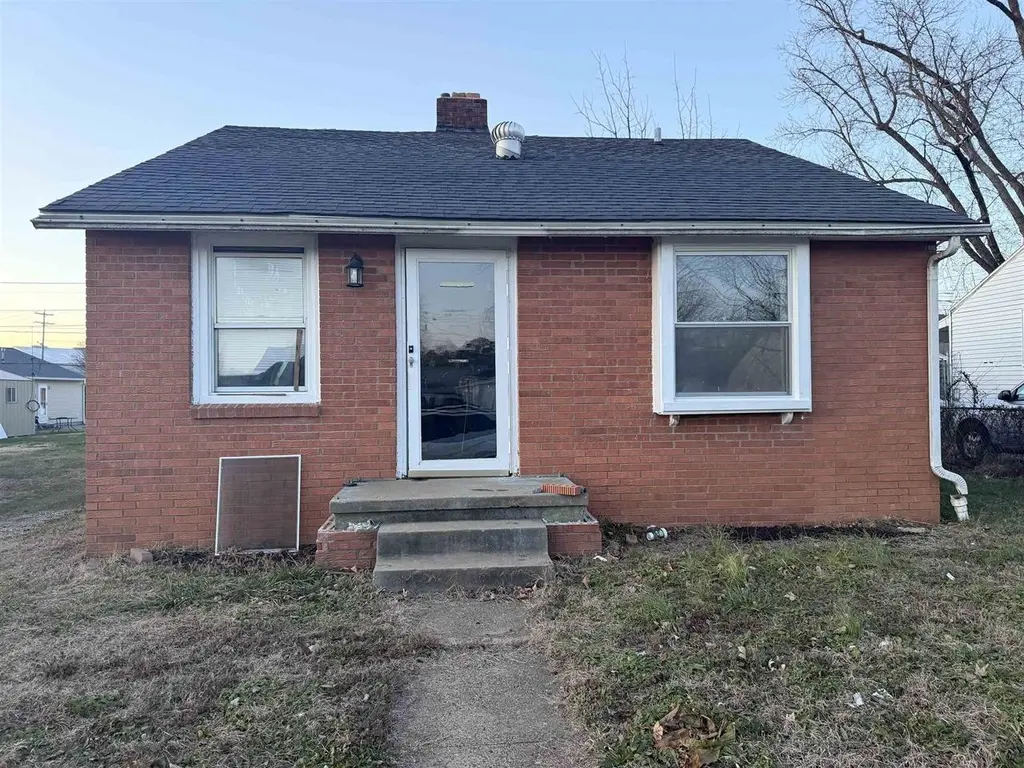
1681 Glendale Ave · Owensboro, KY
Flood risk 1/10 · Minimal
- FEMA flood zone
- X (unshaded)
- Chance of flooding over 30 yrs
- 0.0%
- Est. flood insurance / yr
- $507 – $1,088
Fire risk 1/10 · Minimal
- Est. fire insurance / yr
- $839 – $1,559
Heat risk 5/10 · Moderate
- Hot days now (above 108°F)
- 7 days/yr
- Hot days in 30 yrs
- 19 days/yr
Wind risk 2/10 · Minimal
- Chance of severe wind over 30 yrs
- 3.0%
Air-quality risk 3/10 · Minor
- Unhealthy air days now
- 2 days/yr
- Unhealthy air days in 30 yrs
- 3 days/yr
Risk factors via First Street. Map © Google.
Why this score? — see what drove the B+ grade
The composite is a weighted blend of 9 inputs, each scored 0–100. Each bar is that input's sub-score; the figure is the points it added to the 100-point composite (weight × sub-score).
- Cash flow +30.0/30.0
- ARV discount +15.0/15.0
- 1% rule +10.0/10.0
- DSCR +10.0/10.0
- Livability +3.6/5.0
- Schools +2.6/10.0
- Rent growth +2.5/5.0
- Condition / age +2.5/5.0
- Appreciation +0.0/10.0
$45,000
🖨 Deal sheet 📄 Offer letter ✓ Due diligence
Key facts
- 4,032 sq ft lot
- Built 1938
Neighborhood map
What this means for you Summary
Snapshot
- This is a 2-bed/1.0-bath single-family listed at $45k.
Deal economics
- At list price, monthly cash flow is $550 ($7k/yr) — positive.
- The deal already cash-flows at list — no discount required.
- Meets the 1% rule at list price ($1k rent vs $45k).
- Cap rate 21.0% vs local median 3.1% in Owensboro — top-decile yield for the area; either an underpriced asset or a hidden risk that comps aren't pricing in. Stress-test before assuming the spread holds.
Location & tenants
- Location reads 71/100 on livability (#148 in KY) — a middle-class / working-renter tenant base. Strengths: cost of living A+, housing A+, health & safety B; Watch: employment D+, crime D-, amenities F.
- Owensboro Independent (urban): math 27% / reading 36% proficiency, ranked #100 of 165 in KY (top 61%) — families likely to look elsewhere, expect single-tenant / working-renter base with shorter leases; 63% free/reduced lunch — lower-income household profile, screen leases tightly.
- Zoned schools: Owensboro Middle School (math 25% / reading 34%, grade F, #151 of 217 statewide, top 71%, 807 students, 74% FRL); Owensboro High School (math 30% / reading 40%, grade F, #74 of 254 statewide, top 29%, 1,334 students, 58% FRL) — zoned schools at 66% FRL track the district average.
- Market conditions: 360 active listings in the ZIP; 226 units permitted in Daviess County in 2024 (6 in 5+ unit buildings).
Forward outlook
- Local home prices are declining (-3.0%/yr); year-one equity from $311 of loan paydown is wiped out by about $1k of value loss. Plan a longer hold.
- Daviess County population projected at +6% by 2050 — modest demand growth; plan on rents tracking national, not racing it.
- At projected returns (-3.0% appreciation + 3.0% rent growth), your $13k cash investment doubles in ~3 years — after that, you're playing with house money.
Negotiation context
- Only 0 days on market — expect competitive offers; lowballing is unlikely to land.
- Current owner paid $30k; list at $45k implies a 50% gain — meaningful room to come down on a strong offer.
Risks & watch-outs
- Watch-outs: built in 1938 — expect roof / HVAC / electrical / plumbing capex.
- Climate carrying-cost: extreme-heat days projected 7→19/yr by 2055 (HVAC capex compounding) — expect insurance premiums to compound above CPI over the hold.
Questions for the listing agent
- Built in 1938 — when were the roof, HVAC, electrical panel, plumbing, and water heater last replaced?
- Is there a deadline driving the sale (1031 exchange, divorce, estate, relocation)? That informs how much negotiation room exists.
- Crime grade is D in this area — have there been break-ins, vandalism, or insurance claims at this property in the last 3 years? What carrier currently insures it and at what premium?
- What's the average days-on-market for RENTAL listings here right now (not sales)? A rising rental-DOM trend means longer vacancies and softer asking-rent achievability than the comps imply.
- What's the recent tenant-quality profile in this submarket — average credit score on applications, eviction rate, late-payment / NSF rate, and stable-employment percentage? A property-management company in the area should have these aggregated.
- How much new for-sale + rental construction is in the pipeline within 1–3 miles? Heavy new supply typically softens prices + rents 12–24 months out; constrained supply supports both.
Investment metrics
- 1% rule
- 2.30% ✓
- Cap rate
- 20.95%
- Cash-on-cash
- 52.36%
- DSCR
- 3.33
- GRM
- 3.6
CMA / ARV
- ARV (on-the-fly)
- $69,840
- Comps found
- 12
Show comp detail 12 sales within ~0.75 mi
| Address | Dist | Beds/Ba | Sqft | Sold | Price | $/sf | Match |
|---|---|---|---|---|---|---|---|
| 1681 Glendale Ave | 0.00mi | 2/1.0 | 720 (0%) | 0mo | $40,000 | $56 | 100 |
| 1681 Glendale Ave | 0.00mi | 2/1.0 | 720 (0%) | 6mo | $30,000 | $42 | 95 |
| 717 Gunther Ave | 0.27mi | 2/1.0 | 728 (+1%) | 11mo | $80,000 | $110 | 76 |
| 1639 Monarch Ave | 0.30mi | 2/1.0 | 780 (+8%) | 3mo | $24,001 | $31 | 70 |
| 1808 E 15th St | 0.31mi | 2/1.0 | 672 (-7%) | 7mo | $101,000 | $150 | 69 |
| 1703 Mcculloch Ave | 0.22mi | 2/1.0 | 796 (+11%) | 4mo | $32,000 | $40 | 69 |
| 1027 Jackson St | 0.36mi | 2/1.0 | 672 (-7%) | 4mo | $65,000 | $97 | 68 |
| 1005 Jackson St | 0.36mi | 2/1.0 | 812 (+13%) | 0mo | $125,000 | $154 | 62 |
| 1112 E 5th St | 0.56mi | 2/1.0 | 768 (+7%) | 5mo | $29,900 | $39 | 59 |
| 1110 East 5th St | 0.56mi | 2/1.0 | 768 (+7%) | 5mo | $64,000 | $83 | 59 |
| 518 Birkhead Ave | 0.46mi | 2/1.0 | 784 (+9%) | 9mo | $88,000 | $112 | 56 |
| 1816 Churchill Dr | 0.57mi | 2/1.0 | 808 (+12%) | 11mo | $135,000 | $167 | 44 |
Match score weights: distance 35% · size 25% · config 20% · recency 20%. Top-matched comps best support the ARV.
Projected returns pro-forma
-3.0% appreciation · 3.0% rent growth · sell at horizon
- IRR
- 50.3%
- Equity multiple
- 3.20×
- Total profit
- $27,715
- Equity at exit
- $6,710
- IRR
- 55.7%
- Equity multiple
- 6.49×
- Total profit
- $69,180
- Equity at exit
- $3,891
Cash invested: $12,600 (down + closing). Projections, not guarantees.
Landlord ↔ Tenant lean methodology
- Overall (STATE)
- 83 Strongly Landlord-Friendly
- State Kentucky
- 83 Strongly Landlord-Friendly · R+16
- County
- — inherits STATE
- City
- — inherits STATE
ZIP-level market 42303
- Home prices YoY
- -29.1%
- Active inventory
- 360
- Price-to-rent
- 3.6×
Monthly cashflow live
- Estimated rent
- $1,034 medium interval (Pro) →
- Mortgage (P&I)
- −$236
- Tax from tax record
- −$12 /mo · $147/yr
- Insurance
- −$19
- HOA
- −$0
- Vacancy / Maint / Mgmt
- −$217
- Net cashflow
- $550
Break-even live
UW: 25.0% down · 7.5% · 30yr · 1.5% tax · 5.0% vac · 8.0% maint · 8.0% mgmt
Financing live
Cash to close
- Down payment
- $11,250
- Closing costs
- $1,350
- Reserves months
- —
- Total cash needed
- —
Loan-product check · same deal, 3 products live
Conventional
25% down · 7.5% · 30yr
- Down + closing
- —
- Monthly P&I
- —
- Monthly cashflow
- —
- DSCR
- —
- Eligible?
- —
Personal DTI + credit; lowest rate.
DSCR
20% down · 8.5% · 30yr
- Down + closing
- —
- Monthly P&I
- —
- Monthly cashflow
- —
- DSCR
- —
- Eligible?
- —
No personal income docs; deal must DSCR.
Hard money
10% down · 12.0% · 12mo
- Down + closing
- —
- Monthly P&I
- —
- Monthly cashflow
- —
- DSCR
- —
- Eligible?
- —
Short-term bridge; refi at stabilization.
Listing history 1 events
-
2026-06-05$45,000 Pending
ⓘ Source: listings_history table (triggers on properties + properties_extension) + one-shot
backfill from property_details.listing_events for pre-trigger history.
Tax reassessment forecast KY · Resets to sale price
- Current annual tax
- $147 · $12/mo
- Projected year-2 tax
- $387 · $32/mo
- Expected delta
- +$240/yr (+$20/mo · 163.7%)
ⓘ Screening estimate from a state-policy table — verify with the county assessor before closing.
Climate risk First Street
- Flood 1/10 Low FEMA zone X (unshaded) · 0% chance over 30 yrs
- Wildfire 1/10 Low
- Heat 5/10 Major 7 d/yr ≥108°F today · 19 d/yr by 30 yrs out
- Wind 2/10 Low 3% chance of damaging wind over 30 yrs
- Air quality 3/10 Moderate 2 unhealthy d/yr today · 3 by 30 yrs out
Nearby sold comps map
Loading sold comps map…
Walkable amenities ~0.75 mi
Loading nearby amenities…
Taxation est. · year 1
- Rental income
- $12,407
- − Mortgage interest
- −$2,521
- − Property taxes
- −$147
- − Insurance
- −$225
- − Repairs & maintenance
- −$993
- − Management
- −$993
- − Depreciation
- −$1,309
- Taxable income
- $6,220
- Est. tax owed @ 24.0%
- −$1,493
- After-tax cash flow
- $5,105/yr
For passive investors: Depreciation is non-cash, so a rental often shows a tax loss while cash-flowing — sheltering income. Rental losses are passive: they offset passive income freely, and up to $25,000/yr can offset ordinary (W-2) income if you actively participate and your MAGI is under $100k (phasing out to $0 by $150k); unused losses carry forward. On sale, claimed depreciation is recaptured at up to 25%, and gains may owe capital-gains tax (a 1031 exchange can defer both). Figures are a year-1 estimate at your 24.0% rate — not tax advice; consult a CPA.
Schools (NCES district)
- District
- Owensboro Independent
- NCES district ID
- 2104590
- Math proficiency
- 27% ▼ -16.00%
- Reading proficiency
- 36% ▼ -14.00%
- Median HH income
- $33,020
- Composite
- 25.79/100
- National rank
- #7364
- State rank
- #100 of 165 in KY
Livability — Owensboro
- Score
- 71/100
- State rank
- #148
- US rank
- #7153
Category grades
Schools grade is shown separately in the Schools card above.
Census & demographics
- Census place
- Owensboro, KY
- County
- Daviess County · 87,564 people
- City population
- 87,564
- Metro
- Owensboro, KY
- Population (ZIP)
- 42,119
- Household income
- $64,773
- Rent vs Own
- Severe rent burden
- 983.0
Population outlook (Daviess County) Hauer SSP2
- Today (2025)
- 103,810 people
- By 2030
- 105,722 · +1.8%
- By 2040
- 108,731 · +4.7%
- By 2050
- 110,295 · +6.2%
- By 2075
- 113,056 · +8.9%
- By 2100
- 106,257 · +2.4%
Race, ethnicity, and origin ACS 2023
- Neighborhood character
- Predominantly White (85%)
- Race & ethnicity
- White 85% Hispanic / Latino 5% Two or more races 5% Black 3% Asian 2%
- Common ancestry
- Italian 2% Slovak 1% Lithuanian 1%
- Foreign-born
- 4% · Canada, Philippines
- Languages at home
- 94% English-only · Spanish 3% Other Indo-European 1% Other Asian/Pacific 1%
Political lean MEDSL · Daviess
- 2024 margin
- Solid R (+31.9) · D 33.3% · R 65.2% · Other 1.5%
- 2008→2024 swing
- -21.8pp toward R · 2008: -10.1pp · 2024: -31.9pp
- All cycles
- 2024: R+31.9 2020: R+27.9 2016: R+32.2 2012: R+21.1 2008: R+10.1
Not yet ingested
- Civics
- —
Market trends
- HPI YoY
- ▼ -89.55%
- Current HPI
- 217.7128
- Rent YoY
- —
- Metro
- Owensboro, KY
- State GDP YoY
- ▲ 1.81%
- F500 in state
- 4
Industry mix (Fortune 500 HQ in KY)
| Industry | F500 HQs | Revenue |
|---|---|---|
| Healthcare | 1 | $118B |
|
||
| Food / Beverage | 1 | $7B |
|
||
Price history
+0.0% since first listed2 events — show timeline
- 2025-12-19 Listed $30,000 GORAMLS
- 2025-12-19 Sold (MLS) $30,000 GORAMLS
Property tax history
+1.0%/yrLatest (2025): $147 · -3.3% YoY. Source: county tax records.
Cash-flow waterfall
monthlySold comps — $/sqft
last 12 mo · ≤1 miLoading sold comps…