205 N Macon St · Meadville, MO
Flood risk 1/10 · Minimal
- FEMA flood zone
- X (unshaded)
- Chance of flooding over 30 yrs
- 0.0%
- Est. flood insurance / yr
- $507 – $1,088
Fire risk 3/10 · Minor
- Est. fire insurance / yr
- $1,054 – $1,958
Heat risk 4/10 · Minor
- Hot days now (above 106°F)
- 7 days/yr
- Hot days in 30 yrs
- 16 days/yr
Wind risk 2/10 · Minimal
- Chance of severe wind over 30 yrs
- —
Air-quality risk 2/10 · Minimal
- Unhealthy air days now
- 0 days/yr
- Unhealthy air days in 30 yrs
- 1 days/yr
Risk factors via First Street. Map © Google.
Why this score? — see what drove the D grade
The composite is a weighted blend of 9 inputs, each scored 0–100. Each bar is that input's sub-score; the figure is the points it added to the 100-point composite (weight × sub-score).
- Cash flow +10.5/30.0
- Appreciation +8.5/10.0
- ARV discount +7.5/15.0
- Schools +4.9/10.0
- Livability +3.4/5.0
- DSCR +3.0/10.0
- Rent growth +2.5/5.0
- Condition / age +2.5/5.0
- 1% rule +2.1/10.0
$110,000
🖨 Deal sheet (PDF) 📄 Offer letter ✓ Due diligence
Listing remarks
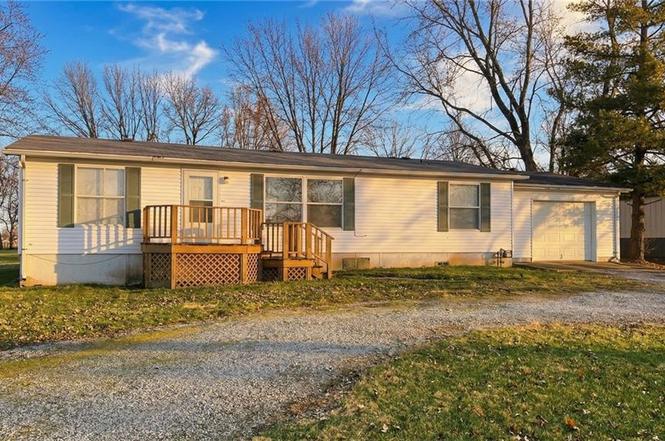
Welcome to this 3 bedroom, 2 bathroom manufactured home in Meadville, MO offering comfortable living with a spacious open living room perfect for relaxing or entertaining. The home sits on a large yard and features a long circle drive for easy access and extra parking. The stove and dishwasher stay, making it move-in ready for the next owner.
Key facts
- Stove and dishwasher
- Open living room
- Circle drive
Tags
Property features AI
Finance
- HOA & community: No association fees
Exterior
- Parking: Attached garage with garage door opener; Off-street parking; 1 garage space
- Utilities: Public water; Public sewer
- Home design: Single-family residence; Attached property; Ranch-style; About 21–30 years old; 1,248 above-grade living area
- Construction: Vinyl siding; Composition roof; Crawl space foundation; Built roughly 21–30 years ago
- Exterior features: Public water; Public sewer; Not in a flood plain; Lot approximately 0.66 acres
Interior
- Kitchen: Kitchen (appliances not specified)
- Bedrooms: 3 bedrooms
- Flooring: Carpet; Laminate
- Bathrooms: 2 full bathrooms
- Heating & cooling: Natural gas heating; Electric cooling (has central or electric cooling)
- Interior features: Crawl space basement; Carpet and laminate flooring; Ranch floor plan
- Laundry & utility: Washer/dryer not specified
Neighborhood map
What this means for you Summary
Snapshot
- This is a 3-bed/2.0-bath manufactured listed at $110k.
Deal economics
- At list price, monthly cash flow is $-57 ($-684/yr) — negative.
- To cash-flow at today's rent, offer at most $100k (9.2% below list).
- To meet the 1% rule (rent ≥ 1% of price), the offer needs to be $79k (28.6% below list).
- Recommended offer: $79k (28.6% below list) — sets the bar for 1% rule.
Location & tenants
- Location reads 67/100 on livability (#226 in MO) — a middle-class / working-renter tenant base. Strengths: cost of living A+, housing A+, employment B; Watch: crime F, amenities F, commute F.
- Meadville R-IV (rural): math 55% / reading 55% proficiency, ranked #63 of 535 in MO (top 12%) — acceptable for families but not a draw, mixed tenant base, ~2y average lease.
- Zoned schools: Meadville Elem. (math 44% / reading 54%, grade D, #284 of 1,115 statewide, top 30%, 117 students, 41% FRL); Meadville High (math 64% / reading 64%, grade B-, #19 of 521 statewide, top 4%, 111 students, 38% FRL).
- Market conditions: 3 active listings in the ZIP; 4 units permitted in Linn County in 2024 (0 in 5+ unit buildings).
Forward outlook
- In year one you build about $8k of equity ($761 loan paydown + $8k appreciation (6.9% local appreciation)).
- Linn County population projected at -21% by 2050 — secular population decline; favor cash flow + early exit over multi-decade hold.
- At projected returns (6.9% appreciation + 3.0% rent growth), your $31k cash investment doubles in ~4 years — after that, you're playing with house money.
- By year 5, paydown + projected appreciation supports a ~$37k cash-out refi (75% LTV) — recoverable capital for the next deal without selling this one.
Negotiation context
- It's been on market 51 days — a 3% lower offer ($107k) is reasonable based on typical stale-listing flexibility.
- 2 sale attempts with the ask held roughly flat each time — persistent listings suggest the price (not the market) is what's stuck; bring a comps-based counter.
- Current owner paid $8k; list at $110k implies a 1367% gain — meaningful room to come down on a strong offer.
Questions for the listing agent
- What do current leases actually rent for vs. the listed asking? Can we see a recent rent roll and the last 12 months of T-12 income?
- It's been on market 51 days. Have you received any prior offers? Is the seller open to a 29% concession, seller financing, or rate buy-down credit?
- Is there a deadline driving the sale (1031 exchange, divorce, estate, relocation)? That informs how much negotiation room exists.
- Schools are A-rated — typically a magnet for longer-tenancy family renters. What's the average tenant stay here, and is there a school-zone premium baked into asking?
- Crime grade is F in this area — have there been break-ins, vandalism, or insurance claims at this property in the last 3 years? What carrier currently insures it and at what premium?
- The area grade is low — what's the realistic commute time and amenity access for the typical tenant pool here? Any planned neighborhood developments (good or bad) we should know about?
- What's the average days-on-market for RENTAL listings here right now (not sales)? A rising rental-DOM trend means longer vacancies and softer asking-rent achievability than the comps imply.
- What's the recent tenant-quality profile in this submarket — average credit score on applications, eviction rate, late-payment / NSF rate, and stable-employment percentage? A property-management company in the area should have these aggregated.
- How much new for-sale + rental construction is in the pipeline within 1–3 miles? Heavy new supply typically softens prices + rents 12–24 months out; constrained supply supports both.
Investment metrics
- 1% rule
- 0.71% ✗
- Cap rate
- 5.67%
- Cash-on-cash
- -2.22%
- DSCR
- 0.90
- GRM
- 11.7
CMA / ARV
No comps found within radius.
Projected returns pro-forma
6.91% appreciation · 3.0% rent growth · sell at horizon
- IRR
- 15.8%
- Equity multiple
- 2.11×
- Total profit
- $34,130
- Equity at exit
- $75,576
- IRR
- 15.5%
- Equity multiple
- 4.31×
- Total profit
- $101,906
- Equity at exit
- $142,974
Cash invested: $30,800 (down + closing). Projections, not guarantees.
Landlord ↔ Tenant lean methodology
- Overall (STATE)
- 81 Strongly Landlord-Friendly
- State Missouri
- 81 Strongly Landlord-Friendly · R+10
- County
- — inherits STATE
- City
- — inherits STATE
ZIP-level market 64659
- Home prices YoY
- 2.8%
- Active inventory
- 3
- Price-to-rent
- 11.7×
Monthly cashflow live
- Estimated rent
- $785 medium interval (Pro) →
- Mortgage (P&I)
- −$577
- Tax from tax record
- −$55 /mo · $657/yr
- Insurance
- −$46
- HOA
- −$0
- Lot rent leased land?
- −$0
- Vacancy / Maint / Mgmt
- −$165
- Net cashflow
- $-57
Break-even live
Sensitivity live
| Price | -10% $5 | -5% $-26 | +0% $-57 | +5% $-88 | +10% $-119 |
|---|---|---|---|---|---|
| Rent | -10% $-119 | -5% $-88 | +0% $-57 | +5% $-26 | +10% $5 |
| Rate | -1.0pp $-2 | -0.5pp $-29 | base $-57 | +0.5pp $-85 | +1.0pp $-114 |
UW: 25.0% down · 7.5% · 30yr · 1.5% tax · 5.0% vac · 8.0% maint · 8.0% mgmt
Financing live
Cash to close
- Down payment
- $27,500
- Closing costs
- $3,300
- Reserves months
- —
- Total cash needed
- —
Loan-product check · same deal, 3 products live
Conventional
25% down · 7.5% · 30yr
- Down + closing
- —
- Monthly P&I
- —
- Monthly cashflow
- —
- DSCR
- —
- Eligible?
- —
Personal DTI + credit; lowest rate.
DSCR
20% down · 8.5% · 30yr
- Down + closing
- —
- Monthly P&I
- —
- Monthly cashflow
- —
- DSCR
- —
- Eligible?
- —
No personal income docs; deal must DSCR.
Hard money
10% down · 12.0% · 12mo
- Down + closing
- —
- Monthly P&I
- —
- Monthly cashflow
- —
- DSCR
- —
- Eligible?
- —
Short-term bridge; refi at stabilization.
Listing history 11 events
-
2026-06-05statusdays on market $110,000 Pending 51 DOM
-
2026-06-04days on market $110,000 Active 50 DOM
-
2026-06-02days on market $110,000 Active 49 DOM
-
2026-06-01days on market $110,000 Active 48 DOM
-
2026-05-31days on market $110,000 Active 47 DOM
-
2026-05-01status Pending
-
2026-04-17status Active
-
2026-04-08status Pending
-
2026-03-12$110,000 Active
-
2001-12-01soldstatus
-
2000-11-28soldstatus $7,500
ⓘ Source: listings_history table (triggers on properties + properties_extension) + one-shot
backfill from property_details.listing_events for pre-trigger history.
Tax reassessment forecast MO · Resets to sale price
- Current annual tax
- $657 · $55/mo
- Projected year-2 tax
- $1,067 · $89/mo
- Expected delta
- +$410/yr (+$34/mo · 62.4%)
ⓘ Screening estimate from a state-policy table — verify with the county assessor before closing.
Climate risk First Street
- Flood 1/10 Low FEMA zone X (unshaded) · 0% chance over 30 yrs
- Wildfire 3/10 Moderate
- Heat 4/10 Moderate 7 d/yr ≥106°F today · 16 d/yr by 30 yrs out
- Wind 2/10 Low
- Air quality 2/10 Low 0 unhealthy d/yr today · 1 by 30 yrs out
Nearby sold comps map
Loading sold comps map…
Walkable amenities ~0.75 mi
Loading nearby amenities…
Taxation est. · year 1
- Rental income
- $9,425
- − Mortgage interest
- −$6,162
- − Property taxes
- −$657
- − Insurance
- −$550
- − Repairs & maintenance
- −$754
- − Management
- −$754
- − Depreciation
- −$3,200
- Taxable loss
- −$2,652
- Est. tax savings @ 24.0%
- +$637
- After-tax cash flow
- $-47/yr
For passive investors: Depreciation is non-cash, so a rental often shows a tax loss while cash-flowing — sheltering income. Rental losses are passive: they offset passive income freely, and up to $25,000/yr can offset ordinary (W-2) income if you actively participate and your MAGI is under $100k (phasing out to $0 by $150k); unused losses carry forward. On sale, claimed depreciation is recaptured at up to 25%, and gains may owe capital-gains tax (a 1031 exchange can defer both). Figures are a year-1 estimate at your 24.0% rate — not tax advice; consult a CPA.
Schools (NCES district)
- District
- Meadville R-IV
- NCES district ID
- 2920640
- Math proficiency
- 55% ▬ 0.00%
- Reading proficiency
- 55% ▬ 0.00%
- Median HH income
- $50,749
- Composite
- 48.82/100
- National rank
- #4510
- State rank
- #63 of 535 in MO
Livability — Meadville
- Score
- 67/100
- State rank
- #226
- US rank
- #11041
Category grades
Schools grade is shown separately in the Schools card above.
Census & demographics
- Census place
- Meadville, MO
- Population (ZIP)
- 876
Population outlook (Linn County) Hauer SSP2
- Today (2025)
- 11,437 people
- By 2030
- 10,946 · -4.3%
- By 2040
- 9,969 · -12.8%
- By 2050
- 9,056 · -20.8%
- By 2075
- 7,342 · -35.8%
- By 2100
- 5,656 · -50.5%
Race, ethnicity, and origin ACS 2023
- Neighborhood character
- Predominantly White (98%)
- Race & ethnicity
- White 98%
- Common ancestry
- Italian 2% Slovak 1% Portuguese 1%
- Foreign-born
- 1% · Canada
- Languages at home
- 98% English-only · Spanish 1%
Political lean MEDSL · Linn
- 2024 margin
- Solid R (+57.2) · D 20.8% · R 78.1% · Other 1.1%
- 2008→2024 swing
- -48.8pp toward R · 2008: -8.5pp · 2024: -57.2pp
- All cycles
- 2024: R+57.2 2020: R+53.9 2016: R+51.1 2012: R+23.5 2008: R+8.5
Not yet ingested
- Civics
- —
Market trends
- HPI YoY
- ▲ 6.91%
- Current HPI
- 253.9682
- Rent YoY
- —
- Metro
- —
- State GDP YoY
- ▲ 1.84%
- F500 in state
- 20
Industry mix (Fortune 500 HQ in MO)
| Industry | F500 HQs | Revenue |
|---|---|---|
| Healthcare | 1 | $163B |
|
||
| Insurance | 1 | $21B |
|
||
| Industrial Technology | 1 | $17B |
|
||
| Retail | 1 | $16B |
|
||
| Industrial Distribution | 1 | $10B |
|
||
| Utilities | 1 | $9B |
|
||
Price history
+1366.7% since first listed6 events — show timeline
- 2026-05-01 Pending — Heartland MLS as Distributed by MLS Grid
- 2026-04-17 Relisted — Heartland MLS as Distributed by MLS Grid
- 2026-04-08 Pending — Heartland MLS as Distributed by MLS Grid
- 2026-03-12 Listed $110,000 Heartland MLS as Distributed by MLS Grid
- 2001-12-01 Sold (Public Records) — Public Records
- 2000-11-28 Sold (Public Records) $7,500 Public Records
Property tax history
+0.6%/yrLatest (2025): $657 · +4.8% YoY. Source: county tax records.
Cash-flow waterfall
monthlySold comps — $/sqft
last 12 mo · ≤1 miLoading sold comps…