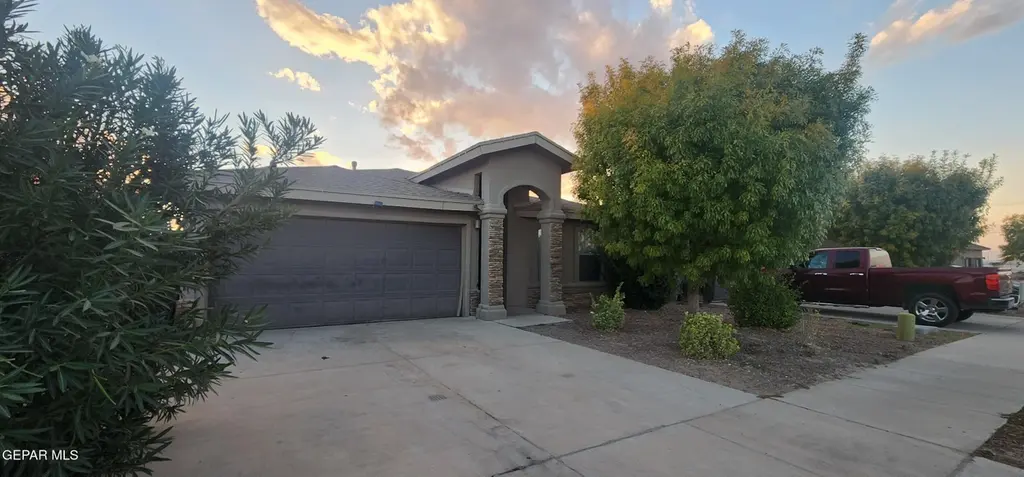
11132 Catherine Slutter Ln · Socorro, TX
Flood risk 1/10 · Minimal
- FEMA flood zone
- X
- Chance of flooding over 30 yrs
- 0.0%
- Est. flood insurance / yr
- $507 – $1,088
Fire risk 3/10 · Minor
- Est. fire insurance / yr
- $1,222 – $2,270
Heat risk 6/10 · Moderate
- Hot days now (above 101°F)
- 7 days/yr
- Hot days in 30 yrs
- 25 days/yr
Wind risk 1/10 · Minimal
- Chance of severe wind over 30 yrs
- —
Air-quality risk 3/10 · Minor
- Unhealthy air days now
- 2 days/yr
- Unhealthy air days in 30 yrs
- 3 days/yr
Risk factors via First Street. Map © Google.
Why this score? — see what drove the D- grade
The composite is a weighted blend of 9 inputs, each scored 0–100. Each bar is that input's sub-score; the figure is the points it added to the 100-point composite (weight × sub-score).
- Cash flow +8.6/30.0
- ARV discount +7.5/15.0
- Appreciation +4.5/10.0
- Rent growth +3.8/5.0
- 1% rule +3.3/10.0
- Livability +3.2/5.0
- Schools +2.6/10.0
- Condition / age +2.5/5.0
- DSCR +2.4/10.0
$225,950
🖨 Deal sheet (PDF) 📄 Offer letter ✓ Due diligence
Listing remarks
Nice single level home with 4 bedrooms, 3 baths. Good size living room with fireplace Open kitchen with island and dining area. Save electricity has solar panels. One room carpet was removed and not replaced, Home selling ''AS IS''. Solar Panels still owe. Seller will pay for half of solar panels at closing, buyer to paid the remaining. Close to schools and shopping centers.
Key facts
- Close to schools
- Solar panels
- 4,698 sq ft lot
Tags
Property features AI
Finance
- Other: Property offered as a fixer upper
- HOA & community: No HOA fees
Exterior
- Parking: 2-car garage
- Utilities: Has heating and cooling
- Home design: Single family residence
- Construction: Stucco exterior; Composition roof; Built by Tropicana Homes
- Exterior features: Walled backyard; Fenced back yard; Open patio/porch
Interior
- Kitchen: Free-standing electric oven; Refrigerator
- Bedrooms: Includes walk-in closet(s)
- Flooring: Tile; Carpet
- Bathrooms: Master bath with shower and tub
- Heating & cooling: Central heating; Refrigerated cooling; Ceiling fan(s)
- Interior features: Ceiling fans; Kitchen island; Master bathroom with shower and tub; Pantry; Walk-in closet(s); Blinds on windows; One fireplace
- Laundry & utility: Owned water softener
Neighborhood map
What this means for you Summary
Snapshot
- This is a 3-bed/?-bath single-family listed at $226k.
Deal economics
- At list price, monthly cash flow is $-192 ($-2k/yr) — negative.
- To cash-flow at today's rent, offer at most $192k (15.0% below list).
- To meet the 1% rule (rent ≥ 1% of price), the offer needs to be $188k (16.7% below list).
- Recommended offer: $188k (16.7% below list) — sets the bar for 1% rule.
Location & tenants
- Location reads 63/100 on livability (#830 in TX) — a middle-class / working-renter tenant base. Strengths: crime A+, cost of living A+, housing A+; Watch: amenities F, commute F, employment F.
- Socorro ISD (urban): math 23% / reading 36% proficiency, ranked #624 of 826 in TX (top 76%) — low school quality limits family demand, transient renter base, plan for 1-2y turnover; 66% free/reduced lunch — lower-income household profile, screen leases tightly.
- Zoned schools: H D Hilley El (math 22% / reading 27%, grade F, #3,052 of 4,322 statewide, top 74%, 514 students, 88% FRL); Salvador Sanchez Middle (math 12% / reading 17%, grade F, #1,583 of 1,662 statewide, top 96%, 615 students, 86% FRL); Socorro H S (math 13% / reading 35%, grade F, #1,333 of 1,632 statewide, top 82%, 2,484 students, 87% FRL) — zoned schools average 87% FRL vs 66% district-wide (21 pts higher); higher-poverty schools than district average — tighter screening recommended.
- Market conditions: Rents rising fast (+5.3%/yr); 219 active listings in the ZIP; 17 comparable units currently listed for rent nearby; rentals at typical pace (median 15d on market — plan ~3-4 weeks tenant-placement turnaround); 2,196 units permitted in El Paso County in 2024 (143 in 5+ unit buildings).
- This rent runs 42% of the median local income ($54k/yr) — at the standard rent-burdened threshold; future hikes will face affordability resistance.
Forward outlook
- Local home prices are declining (-0.9%/yr); year-one equity from $2k of loan paydown is wiped out by about $2k of value loss. Plan a longer hold.
- El Paso County population projected at +10% by 2050 — modest demand growth; plan on rents tracking national, not racing it.
Negotiation context
- Only 2 days on market — expect competitive offers; lowballing is unlikely to land.
- 4 sale attempts since 9y ago with the ask held roughly flat each time — persistent listings suggest the price (not the market) is what's stuck; bring a comps-based counter.
Risks & watch-outs
- Climate carrying-cost: extreme-heat days projected 7→25/yr by 2055 (HVAC capex compounding) — expect insurance premiums to compound above CPI over the hold.
Questions for the listing agent
- What do current leases actually rent for vs. the listed asking? Can we see a recent rent roll and the last 12 months of T-12 income?
- Is there a deadline driving the sale (1031 exchange, divorce, estate, relocation)? That informs how much negotiation room exists.
- Schools are F-rated, which usually means shorter tenancies and higher turnover. Who's the typical renter profile here, and what's been the actual vacancy rate?
- The area grade is low — what's the realistic commute time and amenity access for the typical tenant pool here? Any planned neighborhood developments (good or bad) we should know about?
- What's the average days-on-market for RENTAL listings here right now (not sales)? A rising rental-DOM trend means longer vacancies and softer asking-rent achievability than the comps imply.
- What's the recent tenant-quality profile in this submarket — average credit score on applications, eviction rate, late-payment / NSF rate, and stable-employment percentage? A property-management company in the area should have these aggregated.
- How much new for-sale + rental construction is in the pipeline within 1–3 miles? Heavy new supply typically softens prices + rents 12–24 months out; constrained supply supports both.
Investment metrics
- 1% rule
- 0.83% ✗
- Cap rate
- 5.27%
- Cash-on-cash
- -3.65%
- DSCR
- 0.84
- GRM
- 10.0
CMA / ARV
No comps found within radius.
Projected returns pro-forma
-0.93% appreciation · 5.29% rent growth · sell at horizon
- IRR
- -8.6%
- Equity multiple
- 0.62×
- Total profit
- $-24,046
- Equity at exit
- $55,262
- IRR
- 0.3%
- Equity multiple
- 1.03×
- Total profit
- $1,884
- Equity at exit
- $58,645
Cash invested: $63,266 (down + closing). Projections, not guarantees.
Landlord ↔ Tenant lean methodology
- Overall (STATE)
- 87 Strongly Landlord-Friendly
- State Texas
- 87 Strongly Landlord-Friendly · R+5
- County
- — inherits STATE
- City
- — inherits STATE
ZIP-level market 79927
- Home prices YoY
- -0.4%
- Rents YoY
- 5.3%
- Active inventory
- 219
- Price-to-rent
- 10.0×
Monthly cashflow live
- Estimated rent
- $1,882 high interval (Pro) →
- Mortgage (P&I)
- −$1,185
- Tax from tax record
- −$400 /mo · $4,805/yr
- Insurance
- −$94
- HOA
- −$0
- Vacancy / Maint / Mgmt
- −$395
- Net cashflow
- $-192
Break-even live
Sensitivity live
| Price | -10% $-64 | -5% $-128 | +0% $-192 | +5% $-256 | +10% $-320 |
|---|---|---|---|---|---|
| Rent | -10% $-341 | -5% $-267 | +0% $-192 | +5% $-118 | +10% $-44 |
| Rate | -1.0pp $-79 | -0.5pp $-135 | base $-192 | +0.5pp $-251 | +1.0pp $-310 |
UW: 25.0% down · 7.5% · 30yr · 1.5% tax · 5.0% vac · 8.0% maint · 8.0% mgmt
Financing live
Cash to close
- Down payment
- $56,488
- Closing costs
- $6,778
- Reserves months
- —
- Total cash needed
- —
Loan-product check · same deal, 3 products live
Conventional
25% down · 7.5% · 30yr
- Down + closing
- —
- Monthly P&I
- —
- Monthly cashflow
- —
- DSCR
- —
- Eligible?
- —
Personal DTI + credit; lowest rate.
DSCR
20% down · 8.5% · 30yr
- Down + closing
- —
- Monthly P&I
- —
- Monthly cashflow
- —
- DSCR
- —
- Eligible?
- —
No personal income docs; deal must DSCR.
Hard money
10% down · 12.0% · 12mo
- Down + closing
- —
- Monthly P&I
- —
- Monthly cashflow
- —
- DSCR
- —
- Eligible?
- —
Short-term bridge; refi at stabilization.
Rent comps 17 comps
| Address | Beds | Baths | Sqft | Rent | $/sqft | DOM | Units | Dist |
|---|---|---|---|---|---|---|---|---|
| 445 Stetson Dr El Paso, TX | 3.0 | 2.0 | 1464 | $1,850 | $1.26 | 3d | 1 | 0.76mi |
| 13847 Sandy Pine Way Horizon City, TX | 4.0 | 2.0 | 1566 | $2,200 | $1.40 | 44d | 1 | 0.77mi |
| 125 Via Rojas Dr Horizon City, TX | 4.0 | 2.0 | 1487 | $1,760 | $1.18 | 4d | 1 | 0.98mi |
| 141 Nonap Rd El Paso, TX | 1.0–3.0 | 1.0–2.0 | 1007 | $1,980 | $1.97 | 3d | 9 | 1.07mi |
| 213 Epsom Dr El Paso, TX | 3.0 | 2.0 | 1499 | $1,750 | $1.17 | 44d | 1 | 1.09mi |
| 10129 Christmas Cactus Pl El Paso, TX | 4.0 | 2.0 | 1824 | $1,895 | $1.04 | 4d | 1 | 1.20mi |
| 12874 Woolstone Dr El Paso, TX | 4.0 | 2.5 | 1771 | $1,995 | $1.13 | 44d | 1 | 1.25mi |
| 223 Notts Way El Paso, TX | 4.0 | 2.0 | 1437 | $1,680 | $1.17 | 45d | 1 | 1.27mi |
| 12926 Terrington Ave El Paso, TX | 3.0 | 2.0 | 1366 | $1,800 | $1.32 | 24d | 1 | 1.28mi |
| 12832 Haxby Ct El Paso, TX | 3.0 | 2.0 | 1605 | $1,800 | $1.12 | 3d | 1 | 1.28mi |
| 12934 Terrington Ave El Paso, TX | 3.0 | 2.0 | 1575 | $1,925 | $1.22 | 11d | 1 | 1.29mi |
| 10680 Horn Cir Socorro, TX | 2.0 | 2.0 | 940 | $1,338 | $1.42 | 3d | 3 | 1.29mi |
| 10680 Horn Cir Unit 12 Socorro, TX | 2.0 | 2.0 | 940 | $1,350 | $1.44 | 44d | 1 | 1.29mi |
| 12407 Joe Gomez Ave El Paso, TX | 3.0 | 2.5 | 1639 | $1,700 | $1.04 | 15d | 1 | 1.31mi |
| 247 Herts Way El Paso, TX | 4.0 | 2.0 | 1642 | $1,900 | $1.16 | 12d | 1 | 1.38mi |
| 12911 Aberdare Dr El Paso, TX | 4.0 | 2.5 | 1838 | $2,200 | $1.20 | 15d | 1 | 1.38mi |
| 12878 Clevedon St El Paso, TX | 4.0 | 2.5 | 1872 | $2,250 | $1.20 | 44d | 1 | 1.40mi |
Listing history 12 events
-
2026-06-18days on market $225,950 Active 2 DOM
-
2026-06-17remarks 378-char remark
-
2026-06-17pricedays on market $225,950 Active 1 DOM
-
2026-05-31days on market $220,950 Active 179 DOM
-
2026-04-14status Active 341-char remark
-
2026-03-28status Pending 341-char remark
-
2026-02-25price $220,950 341-char remark
-
2026-01-15price $224,950 341-char remark
-
2025-12-06price $229,950 341-char remark
-
2025-11-17$236,950 Active 341-char remark
-
2017-11-28status Pending
-
2017-05-25$156,950 Active
ⓘ Source: listings_history table (triggers on properties + properties_extension) + one-shot
backfill from property_details.listing_events for pre-trigger history.
Tax reassessment forecast TX · Resets to sale price
- Current annual tax
- $4,805 · $400/mo
- Projected year-2 tax
- $4,805 · $400/mo
- Expected delta
- $0/yr ($0/mo · 0.0%)
ⓘ Screening estimate from a state-policy table — verify with the county assessor before closing.
Climate risk First Street
- Flood 1/10 Low FEMA zone X · 0% chance over 30 yrs
- Wildfire 3/10 Moderate
- Heat 6/10 Major 7 d/yr ≥101°F today · 25 d/yr by 30 yrs out
- Wind 1/10 Low
- Air quality 3/10 Moderate 2 unhealthy d/yr today · 3 by 30 yrs out
Nearby sold comps map
Loading sold comps map…
Walkable amenities ~0.75 mi
Loading nearby amenities…
Taxation est. · year 1
- Rental income
- $22,589
- − Mortgage interest
- −$12,657
- − Property taxes
- −$4,805
- − Insurance
- −$1,130
- − Repairs & maintenance
- −$1,807
- − Management
- −$1,807
- − Depreciation
- −$6,573
- Taxable loss
- −$6,189
- Est. tax savings @ 24.0%
- +$1,485
- After-tax cash flow
- $-822/yr
For passive investors: Depreciation is non-cash, so a rental often shows a tax loss while cash-flowing — sheltering income. Rental losses are passive: they offset passive income freely, and up to $25,000/yr can offset ordinary (W-2) income if you actively participate and your MAGI is under $100k (phasing out to $0 by $150k); unused losses carry forward. On sale, claimed depreciation is recaptured at up to 25%, and gains may owe capital-gains tax (a 1031 exchange can defer both). Figures are a year-1 estimate at your 24.0% rate — not tax advice; consult a CPA.
Schools (NCES district)
- District
- Socorro ISD
- NCES district ID
- 4840710
- Math proficiency
- 23% ▼ -34.00%
- Reading proficiency
- 36% ▼ -14.00%
- Median HH income
- $49,318
- Composite
- 25.67/100
- National rank
- #7396
- State rank
- #624 of 826 in TX
Livability — Socorro
- Score
- 63/100
- State rank
- #830
- US rank
- #14960
Category grades
Schools grade is shown separately in the Schools card above.
Census & demographics
- County
- El Paso County · 761,266 people
- City population
- 44,444
- Metro
- El Paso, TX
- Population (ZIP)
- 44,444
- Household income
- $53,652
- Rent vs Own
- Severe rent burden
- 732.0
Population outlook (El Paso County) Hauer SSP2
- Today (2025)
- 897,899 people
- By 2030
- 922,694 · +2.8%
- By 2040
- 960,492 · +7.0%
- By 2050
- 982,919 · +9.5%
- By 2075
- 997,266 · +11.1%
- By 2100
- 900,630 · +0.3%
Race, ethnicity, and origin ACS 2023
- Neighborhood character
- Predominantly Hispanic (97%)
- Race & ethnicity
- Hispanic / Latino 97% Two or more races 39% Native American 2% White 2%
- Hispanic origin (detail)
- Mexican 94%
- Foreign-born
- 34% · Canada
- Languages at home
- 16% English-only · Spanish 84%
Political lean MEDSL · El Paso
- 2024 margin
- D (+15.1) · D 57.0% · R 41.8% · Other 1.2%
- 2008→2024 swing
- -17.4pp toward R · 2008: 32.5pp · 2024: 15.1pp
- All cycles
- 2024: D+15.1 2020: D+35.1 2016: D+43.2 2012: D+32.6 2008: D+32.5
Not yet ingested
- Civics
- —
Market trends
- HPI YoY
- ▼ -0.93%
- Current HPI
- 239.646
- Rent YoY
- ▲ 5.29%
- Metro
- El Paso, TX
- State GDP YoY
- ▲ 3.95%
- F500 in state
- 110
Industry mix (Fortune 500 HQ in TX)
| Industry | F500 HQs | Revenue |
|---|---|---|
| Energy | 16 | $1,198B |
|
||
| Technology | 5 | $198B |
|
||
| Engineering / Construction | 4 | $72B |
|
||
| Energy Services | 3 | $60B |
|
||
| Utilities | 3 | $41B |
|
||
| Healthcare | 2 | $330B |
|
||
Price history
+44.0% since first listed10 events — show timeline
- 2026-06-16 Listed $225,950 GEPARMLS
- 2026-04-14 Relisted — GEPARMLS
- 2026-03-28 Pending — GEPARMLS
- 2026-03-28 Listing Removed — GEPARMLS
- 2026-02-25 Price Changed $220,950 GEPARMLS
- 2026-01-15 Price Changed $224,950 GEPARMLS
- 2025-12-06 Price Changed $229,950 GEPARMLS
- 2025-11-17 Listed $236,950 GEPARMLS
- 2017-11-28 Pending — GEPARMLS
- 2017-05-25 Listed $156,950 GEPARMLS
Property tax history
+17.5%/yrLatest (2025): $4,805 · +8.4% YoY. Source: county tax records.
Cash-flow waterfall
monthlySold comps — $/sqft
last 12 mo · ≤1 miLoading sold comps…