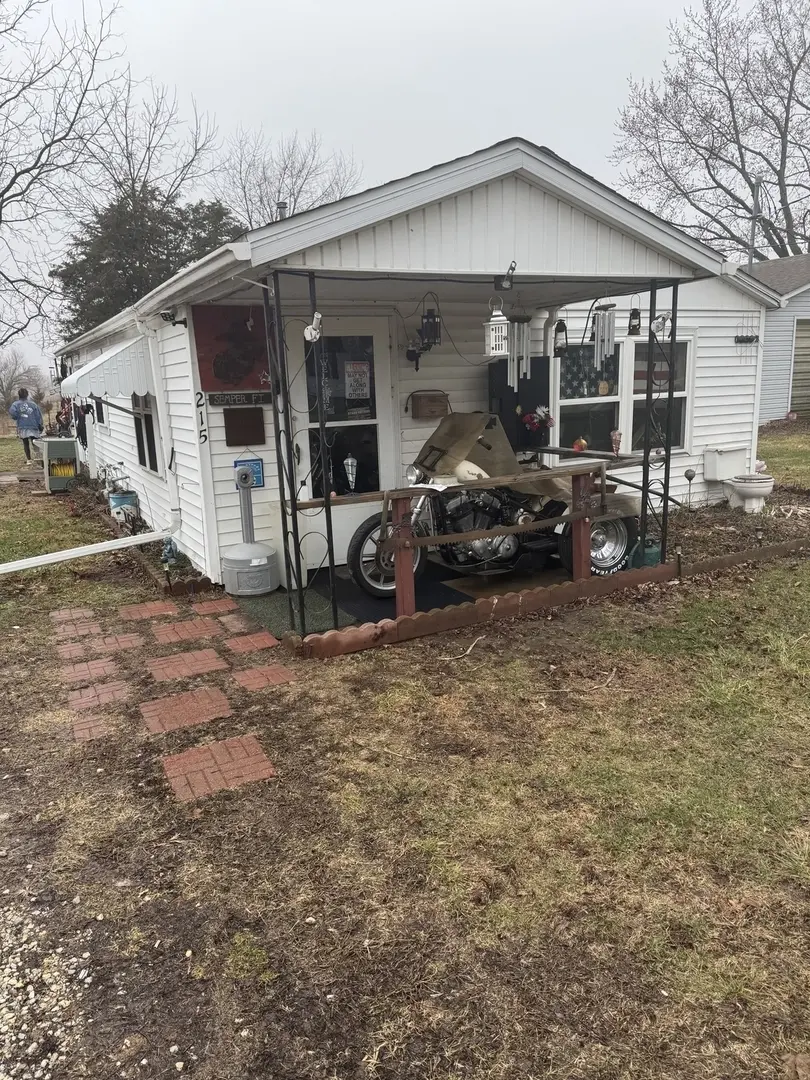
215 S Missouri St · Atwood, IL
Flood risk 1/10 · Minimal
- FEMA flood zone
- X (unshaded)
- Chance of flooding over 30 yrs
- 0.0%
- Est. flood insurance / yr
- $473 – $860
Fire risk 1/10 · Minimal
- Est. fire insurance / yr
- $804 – $1,492
Heat risk 3/10 · Minor
- Hot days now (above 105°F)
- 7 days/yr
- Hot days in 30 yrs
- 20 days/yr
Wind risk 2/10 · Minimal
- Chance of severe wind over 30 yrs
- 2.0%
Air-quality risk 2/10 · Minimal
- Unhealthy air days now
- 1 days/yr
- Unhealthy air days in 30 yrs
- 1 days/yr
Risk factors via First Street. Map © Google.
Why this score? — see what drove the B+ grade
The composite is a weighted blend of 9 inputs, each scored 0–100. Each bar is that input's sub-score; the figure is the points it added to the 100-point composite (weight × sub-score).
- Cash flow +30.0/30.0
- ARV discount +12.1/15.0
- 1% rule +10.0/10.0
- DSCR +10.0/10.0
- Appreciation +5.1/10.0
- Livability +3.1/5.0
- Schools +2.6/10.0
- Rent growth +2.5/5.0
- Condition / age +2.5/5.0
$35,000
🖨 Deal sheet 📄 Offer letter ✓ Due diligence
Listing remarks MLS
Charming 1-bedroom, 1-bath property with a long-term tenant already in place-perfect for investors seeking immediate rental income. The current tenant would love to stay, offering stability and a seamless transition for the new owner. A great opportunity to expand your portfolio with a low-maintenance, income-producing property.
Key facts
- 4,822 sq ft lot
- Built 1970
- Listed 42 days
Property features AI
Finance
- Other: Living area estimated
- Financial info: Fee simple ownership
- HOA & community: No master association fee required
Exterior
- Parking: 2 parking spaces (owned)
- Utilities: Public water; Public sewer
- Home design: Detached single-family home; One-story
- Construction: Built 51–60 years ago; Constructed with other materials; Built before 1978
- Exterior features: Lot dimensions approximately 40 x 121; Lot size less than 0.25 acre; Property currently leased
Interior
- Kitchen: Kitchen (main level, 12 x 7)
- Bedrooms: 1 bedroom; Master bedroom (main level, 12 x 9); Additional bedrooms listed
- Bathrooms: 1 full bathroom
- Heating & cooling: Forced air heating; Central air conditioning
- Interior features: 3 total rooms; Living room (20 x 12); Family room; Dining room
- Laundry & utility: Laundry room
Neighborhood map
What this means for you Summary
Snapshot
- This is a 1-bed/1.0-bath single-family listed at $35k.
Deal economics
- At list price, monthly cash flow is $404 ($5k/yr) — positive.
- The deal already cash-flows at list — no discount required.
- Meets the 1% rule at list price ($771 rent vs $35k).
- Recommended offer: $34k (3.0% below list) — sets the bar for market timing.
Location & tenants
- Location reads 62/100 on livability (#885 in IL) — a middle-class / working-renter tenant base. Strengths: cost of living A+, housing A+; Watch: amenities F, commute F, health & safety F.
- Arthur CUSD 305 (rural): math 24% / reading 36% proficiency, ranked #252 of 620 in IL (top 41%) — families likely to look elsewhere, expect single-tenant / working-renter base with shorter leases.
- Zoned schools: Atwood-Hammond Grade School (math 17% / reading 37%, grade F, #749 of 2,056 statewide, top 40%, 236 students, 0% FRL); Arthur-Lovington-Atwood-Hammond (math 22% / reading 32%, grade F, #218 of 693 statewide, top 35%, 324 students, 0% FRL) — zoned schools average 0% FRL vs 35% district-wide (35 pts lower); this property's tenant base skews higher-income than the district average.
- Market conditions: 7 active listings in the ZIP; 34 units permitted in Piatt County in 2024 (0 in 5+ unit buildings).
Forward outlook
- In year one you build about $295 of equity ($242 loan paydown + $53 appreciation (0.1% local appreciation)).
- Piatt County population projected at -19% by 2050 — secular population decline; favor cash flow + early exit over multi-decade hold.
- At projected returns (0.1% appreciation + 3.0% rent growth), your $10k cash investment doubles in ~2 years — after that, you're playing with house money.
Negotiation context
- It's been on market 42 days — a 3% lower offer ($34k) is reasonable based on typical stale-listing flexibility.
- 2 sale attempts with the ask held roughly flat each time — persistent listings suggest the price (not the market) is what's stuck; bring a comps-based counter.
- Current owner paid $25k; 40% above their basis — modest negotiation headroom, anchor on the comps not their cost.
Questions for the listing agent
- It's been on market 42 days. Have you received any prior offers? Is the seller open to a 3% concession, seller financing, or rate buy-down credit?
- Built in 1970 — when were the roof, HVAC, electrical panel, plumbing, and water heater last replaced?
- Is there a deadline driving the sale (1031 exchange, divorce, estate, relocation)? That informs how much negotiation room exists.
- Schools are F-rated, which usually means shorter tenancies and higher turnover. Who's the typical renter profile here, and what's been the actual vacancy rate?
- What's the average days-on-market for RENTAL listings here right now (not sales)? A rising rental-DOM trend means longer vacancies and softer asking-rent achievability than the comps imply.
- What's the recent tenant-quality profile in this submarket — average credit score on applications, eviction rate, late-payment / NSF rate, and stable-employment percentage? A property-management company in the area should have these aggregated.
- How much new for-sale + rental construction is in the pipeline within 1–3 miles? Heavy new supply typically softens prices + rents 12–24 months out; constrained supply supports both.
Investment metrics
- 1% rule
- 2.20% ✓
- Cap rate
- 20.13%
- Cash-on-cash
- 49.41%
- DSCR
- 3.20
- GRM
- 3.8
CMA / ARV
- ARV (on-the-fly)
- $39,000
- Comps found
- 2
Show comp detail 2 sales within ~0.75 mi
| Address | Dist | Beds/Ba | Sqft | Sold | Price | $/sf | Match |
|---|---|---|---|---|---|---|---|
| 215 S Missouri St | 0.00mi | 1/1.0 | 500 (0%) | 1mo | $39,000 | $78 | 99 |
| 215 S Missouri St | 0.00mi | 1/1.0 | 500 (0%) | 1mo | $39,000 | $78 | 99 |
Match score weights: distance 35% · size 25% · config 20% · recency 20%. Top-matched comps best support the ARV.
Projected returns pro-forma
0.15% appreciation · 3.0% rent growth · sell at horizon
- IRR
- 51.0%
- Equity multiple
- 3.54×
- Total profit
- $24,914
- Equity at exit
- $10,427
- IRR
- 53.4%
- Equity multiple
- 7.08×
- Total profit
- $59,618
- Equity at exit
- $12,747
Cash invested: $9,800 (down + closing). Projections, not guarantees.
Landlord ↔ Tenant lean methodology
- Overall (STATE)
- 43 Moderately Tenant-Leaning
- State Illinois
- 43 Moderately Tenant-Leaning · D+7
- County
- — inherits STATE
- City
- — inherits STATE
ZIP-level market 61913
- Home prices YoY
- 0.1%
- Active inventory
- 7
- Price-to-rent
- 3.8×
Monthly cashflow live
- Estimated rent
- $771 medium interval (Pro) →
- Mortgage (P&I)
- −$184
- Tax from tax record
- −$7 /mo · $86/yr
- Insurance
- −$15
- HOA
- −$0
- Vacancy / Maint / Mgmt
- −$162
- Net cashflow
- $404
Break-even live
UW: 25.0% down · 7.5% · 30yr · 1.5% tax · 5.0% vac · 8.0% maint · 8.0% mgmt
Financing live
Cash to close
- Down payment
- $8,750
- Closing costs
- $1,050
- Reserves months
- —
- Total cash needed
- —
Loan-product check · same deal, 3 products live
Conventional
25% down · 7.5% · 30yr
- Down + closing
- —
- Monthly P&I
- —
- Monthly cashflow
- —
- DSCR
- —
- Eligible?
- —
Personal DTI + credit; lowest rate.
DSCR
20% down · 8.5% · 30yr
- Down + closing
- —
- Monthly P&I
- —
- Monthly cashflow
- —
- DSCR
- —
- Eligible?
- —
No personal income docs; deal must DSCR.
Hard money
10% down · 12.0% · 12mo
- Down + closing
- —
- Monthly P&I
- —
- Monthly cashflow
- —
- DSCR
- —
- Eligible?
- —
Short-term bridge; refi at stabilization.
Listing history 7 events
-
2026-05-31statusdays on market $35,000 Pending 42 DOM
-
2026-04-22historical Active Under Contract 330-char remark
Show marketing remark (330 chars)
Charming 1-bedroom, 1-bath property with a long-term tenant already in place-perfect for investors seeking immediate rental income. The current tenant would love to stay, offering stability and a seamless transition for the new owner. A great opportunity to expand your portfolio with a low-maintenance, income-producing property.
-
2026-04-22historical Contingent - Continue to Show
Show marketing remark (330 chars)
Charming 1-bedroom, 1-bath property with a long-term tenant already in place-perfect for investors seeking immediate rental income. The current tenant would love to stay, offering stability and a seamless transition for the new owner. A great opportunity to expand your portfolio with a low-maintenance, income-producing property.
-
2026-04-17$35,000 Active 330-char remark
Show marketing remark (330 chars)
Charming 1-bedroom, 1-bath property with a long-term tenant already in place-perfect for investors seeking immediate rental income. The current tenant would love to stay, offering stability and a seamless transition for the new owner. A great opportunity to expand your portfolio with a low-maintenance, income-producing property.
-
2026-04-16$35,000 Active
-
2023-02-14soldstatus $25,000
-
2017-08-01historical
ⓘ Source: listings_history table (triggers on properties + properties_extension) + one-shot
backfill from property_details.listing_events for pre-trigger history.
Tax reassessment forecast IL · Partial reset (capped growth)
- Current annual tax
- $86 · $7/mo
- Projected year-2 tax
- $440 · $37/mo
- Expected delta
- +$354/yr (+$30/mo · 413.5%)
ⓘ Screening estimate from a state-policy table — verify with the county assessor before closing.
Climate risk First Street
- Flood 1/10 Low FEMA zone X (unshaded) · 0% chance over 30 yrs
- Wildfire 1/10 Low
- Heat 3/10 Moderate 7 d/yr ≥105°F today · 20 d/yr by 30 yrs out
- Wind 2/10 Low 2% chance of damaging wind over 30 yrs
- Air quality 2/10 Low 1 unhealthy d/yr today · 1 by 30 yrs out
Nearby sold comps map
Loading sold comps map…
Walkable amenities ~0.75 mi
Loading nearby amenities…
Taxation est. · year 1
- Rental income
- $9,247
- − Mortgage interest
- −$1,961
- − Property taxes
- −$86
- − Insurance
- −$175
- − Repairs & maintenance
- −$740
- − Management
- −$740
- − Depreciation
- −$1,018
- Taxable income
- $4,528
- Est. tax owed @ 24.0%
- −$1,087
- After-tax cash flow
- $3,755/yr
For passive investors: Depreciation is non-cash, so a rental often shows a tax loss while cash-flowing — sheltering income. Rental losses are passive: they offset passive income freely, and up to $25,000/yr can offset ordinary (W-2) income if you actively participate and your MAGI is under $100k (phasing out to $0 by $150k); unused losses carry forward. On sale, claimed depreciation is recaptured at up to 25%, and gains may owe capital-gains tax (a 1031 exchange can defer both). Figures are a year-1 estimate at your 24.0% rate — not tax advice; consult a CPA.
Schools (NCES district)
- District
- Arthur CUSD 305
- NCES district ID
- 1704260
- Math proficiency
- 24% ▬ 0.00%
- Reading proficiency
- 36% ▲ 4.00%
- Median HH income
- $48,266
- Composite
- 25.99/100
- National rank
- #7320
- State rank
- #252 of 620 in IL
Livability — Atwood
- Score
- 62/100
- State rank
- #885
- US rank
- #17235
Category grades
Schools grade is shown separately in the Schools card above.
Census & demographics
- Census place
- Atwood, IL
- Population (ZIP)
- 1,192
Population outlook (Piatt County) Hauer SSP2
- Today (2025)
- 15,501 people
- By 2030
- 14,978 · -3.4%
- By 2040
- 13,805 · -10.9%
- By 2050
- 12,563 · -19.0%
- By 2075
- 9,916 · -36.0%
- By 2100
- 7,295 · -52.9%
Race, ethnicity, and origin ACS 2023
- Neighborhood character
- Predominantly White (97%)
- Race & ethnicity
- White 97% Hispanic / Latino 2% Two or more races 1%
- Common ancestry
- Lithuanian 1%
- Foreign-born
- 1% · Canada
- Languages at home
- 96% English-only · Spanish 2% German/W. Germanic 1% Tagalog/Filipino 1%
Political lean MEDSL · Piatt
- 2024 margin
- Solid R (+30.5) · D 33.7% · R 64.3% · Other 2.0%
- 2008→2024 swing
- -18.0pp toward R · 2008: -12.6pp · 2024: -30.5pp
- All cycles
- 2024: R+30.5 2020: R+29.6 2016: R+33.6 2012: R+26.8 2008: R+12.6
Not yet ingested
- Civics
- —
Market trends
- HPI YoY
- ▲ 0.15%
- Current HPI
- 177.4735
- Rent YoY
- —
- Metro
- —
- State GDP YoY
- ▲ 1.59%
- F500 in state
- 60
Industry mix (Fortune 500 HQ in IL)
| Industry | F500 HQs | Revenue |
|---|---|---|
| Insurance | 4 | $201B |
|
||
| Consumer Goods | 4 | $87B |
|
||
| Industrial Machinery | 3 | $64B |
|
||
| Healthcare | 2 | $55B |
|
||
| Retail / Pharmacy | 1 | $148B |
|
||
| Agriculture / Food | 1 | $86B |
|
||
Price history
+40.0% since first listed6 events — show timeline
- 2026-04-22 Contingent — CIBR
- 2026-04-22 Contingent — MRED as Distributed by MLS Grid
- 2026-04-17 Listed $35,000 CIBR
- 2026-04-16 Listed $35,000 MRED as Distributed by MLS Grid
- 2023-02-14 Sold (Public Records) $25,000 Public Records
- 2017-08-01 Listing Removed — MRED as Distributed by MLS Grid
Property tax history
-14.3%/yrLatest (2024): $86 · -84.1% YoY. Source: county tax records.
Cash-flow waterfall
monthlySold comps — $/sqft
last 12 mo · ≤1 miLoading sold comps…