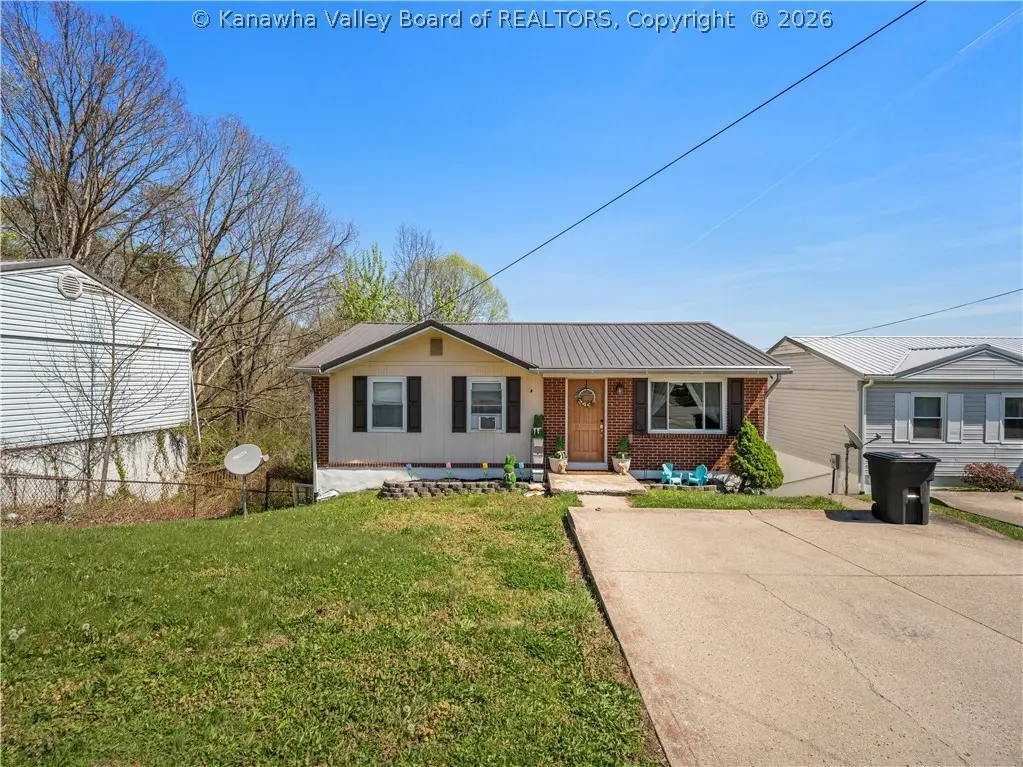
1452 Clearview Heights Rd · Sissonville, WV
Flood risk 1/10 · Minimal
- FEMA flood zone
- X (unshaded)
- Chance of flooding over 30 yrs
- 0.0%
- Est. flood insurance / yr
- $473 – $860
Fire risk 6/10 · Moderate
- Est. fire insurance / yr
- $787 – $1,461
Heat risk 4/10 · Minor
- Hot days now (above 100°F)
- 7 days/yr
- Hot days in 30 yrs
- 19 days/yr
Wind risk 2/10 · Minimal
- Chance of severe wind over 30 yrs
- 1.0%
Air-quality risk 2/10 · Minimal
- Unhealthy air days now
- 0 days/yr
- Unhealthy air days in 30 yrs
- 1 days/yr
Risk factors via First Street. Map © Google.
Why this score? — see what drove the D+ grade
The composite is a weighted blend of 9 inputs, each scored 0–100. Each bar is that input's sub-score; the figure is the points it added to the 100-point composite (weight × sub-score).
- ARV discount +15.0/15.0
- Cash flow +11.9/30.0
- Appreciation +4.5/10.0
- DSCR +3.5/10.0
- Livability +3.1/5.0
- Schools +2.9/10.0
- Rent growth +2.5/5.0
- Condition / age +2.5/5.0
- 1% rule +2.4/10.0
$167,500
🖨 Deal sheet 📄 Offer letter ✓ Due diligence
Listing remarks MLS
Easy living with this raised rancher with full walkout basement! This super cute home features 3 bedrooms, 2 on the main level and one on the lower level, two full bathrooms, updated kitchen, two living spaces, plenty of storage space, lower-level deck overlooking back yard. Plenty of parking, super convenient location!
Key facts
- Updated appliances
- Large deck
- Modern aesthetic
Tags
Property features AI
Exterior
- Parking: Parking pad
- Security: Smoke detector(s)
- Utilities: Public water; Public sewer; Cable available
- Home design: Single family residence; Residential property
- Construction: Brick and vinyl siding exterior; Metal roof
- Exterior features: Deck
Interior
- Kitchen: Dishwasher; Electric range; Microwave; Refrigerator
- Bedrooms: 6 total rooms (includes bedrooms and living spaces)
- Flooring: Laminate flooring; Tile flooring; Vinyl flooring
- Bathrooms: 2 full bathrooms
- Heating & cooling: Central air conditioning; Electric forced air heating
- Interior features: Eat-in kitchen; Insulated windows; Full basement with sump pump
Neighborhood map
What this means for you Summary
Snapshot
- This is a 3-bed/2.0-bath single-family listed at $168k.
Deal economics
- At list price, monthly cash flow is $-43 ($-517/yr) — negative.
- To cash-flow at today's rent, offer at most $160k (4.5% below list).
- To meet the 1% rule (rent ≥ 1% of price), the offer needs to be $124k (25.8% below list).
- Recommended offer: $124k (25.8% below list) — sets the bar for 1% rule.
- Cap rate 6.0% vs local median 4.1% in Sissonville — top-decile yield for the area; either an underpriced asset or a hidden risk that comps aren't pricing in. Stress-test before assuming the spread holds.
Location & tenants
- Location reads 62/100 on livability (#183 in WV) — a middle-class / working-renter tenant base. Strengths: crime A+, cost of living A+, housing A-; Watch: employment D+, amenities F, commute F.
- Kanawha County Schools (suburban): math 29% / reading 40% proficiency, ranked #17 of 55 in WV (top 31%) — families likely to look elsewhere, expect single-tenant / working-renter base with shorter leases.
- Zoned schools: Flinn Elementary School (math 32% / reading 32%, grade F, #191 of 377 statewide, top 56%, 439 students, 0% FRL); Sissonville Middle School (math 33% / reading 45%, grade F, #21 of 109 statewide, top 19%, 541 students, 0% FRL); Sissonville High School (math 17% / reading 42%, grade F, #69 of 110 statewide, top 71%, 563 students, 0% FRL) — zoned schools average 0% FRL vs 46% district-wide (46 pts lower); this property's tenant base skews higher-income than the district average.
- Market conditions: 40 active listings in the ZIP; 103 units permitted in Kanawha County in 2024 (0 in 5+ unit buildings).
Forward outlook
- Local home prices are declining (-1.0%/yr); year-one equity from $1k of loan paydown is wiped out by about $2k of value loss. Plan a longer hold.
- Kanawha County population projected at -17% by 2050 — secular population decline; favor cash flow + early exit over multi-decade hold.
Negotiation context
- It's been on market 57 days — a 3% lower offer ($162k) is reasonable based on typical stale-listing flexibility.
- 3 sale attempts since 3y ago with the ask held roughly flat each time — persistent listings suggest the price (not the market) is what's stuck; bring a comps-based counter.
- Current owner paid $145k; 16% above their basis — modest negotiation headroom, anchor on the comps not their cost.
Risks & watch-outs
- Climate carrying-cost: major wildfire risk — expect insurance premiums to compound above CPI over the hold.
Questions for the listing agent
- What do current leases actually rent for vs. the listed asking? Can we see a recent rent roll and the last 12 months of T-12 income?
- It's been on market 57 days. Have you received any prior offers? Is the seller open to a 26% concession, seller financing, or rate buy-down credit?
- Built in 1973 — when were the roof, HVAC, electrical panel, plumbing, and water heater last replaced?
- Is there a deadline driving the sale (1031 exchange, divorce, estate, relocation)? That informs how much negotiation room exists.
- Schools are F-rated, which usually means shorter tenancies and higher turnover. Who's the typical renter profile here, and what's been the actual vacancy rate?
- The area grade is low — what's the realistic commute time and amenity access for the typical tenant pool here? Any planned neighborhood developments (good or bad) we should know about?
- What's the average days-on-market for RENTAL listings here right now (not sales)? A rising rental-DOM trend means longer vacancies and softer asking-rent achievability than the comps imply.
- What's the recent tenant-quality profile in this submarket — average credit score on applications, eviction rate, late-payment / NSF rate, and stable-employment percentage? A property-management company in the area should have these aggregated.
- How much new for-sale + rental construction is in the pipeline within 1–3 miles? Heavy new supply typically softens prices + rents 12–24 months out; constrained supply supports both.
Investment metrics
- 1% rule
- 0.74% ✗
- Cap rate
- 5.98%
- Cash-on-cash
- -1.10%
- DSCR
- 0.95
- GRM
- 11.2
CMA / ARV
- ARV (on-the-fly)
- $202,176
- Comps found
- 3
Show comp detail 3 sales within ~0.75 mi
| Address | Dist | Beds/Ba | Sqft | Sold | Price | $/sf | Match |
|---|---|---|---|---|---|---|---|
| 7012 Kanawha Farm Cir | 0.28mi | 3/2.0 | 1,723 (-0%) | 20mo | $270,000 | $157 | 70 |
| 7018 Kanawha Farm Cir | 0.33mi | 3/2.5 | 1,925 (+11%) | 8mo | $197,000 | $102 | 57 |
| 1812 Oakwood Dr | 0.69mi | 3/2.5 | 1,628 (-6%) | 22mo | $190,000 | $117 | 38 |
Match score weights: distance 35% · size 25% · config 20% · recency 20%. Top-matched comps best support the ARV.
Projected returns pro-forma
-1.04% appreciation · 3.0% rent growth · sell at horizon
- IRR
- -7.8%
- Equity multiple
- 0.66×
- Total profit
- $-15,729
- Equity at exit
- $40,105
- IRR
- -1.0%
- Equity multiple
- 0.91×
- Total profit
- $-4,161
- Equity at exit
- $41,834
Cash invested: $46,900 (down + closing). Projections, not guarantees.
Landlord ↔ Tenant lean methodology
- Overall (STATE)
- 83 Strongly Landlord-Friendly
- State West Virginia
- 83 Strongly Landlord-Friendly · R+22
- County
- — inherits STATE
- City
- — inherits STATE
ZIP-level market 25312
- Home prices YoY
- -0.5%
- Active inventory
- 40
- Price-to-rent
- 11.2×
Monthly cashflow live
- Estimated rent
- $1,243 medium interval (Pro) →
- Mortgage (P&I)
- −$878
- Tax from tax record
- −$77 /mo · $918/yr
- Insurance
- −$70
- HOA
- −$0
- Vacancy / Maint / Mgmt
- −$261
- Net cashflow
- $-43
Break-even live
UW: 25.0% down · 7.5% · 30yr · 1.5% tax · 5.0% vac · 8.0% maint · 8.0% mgmt
Financing live
Cash to close
- Down payment
- $41,875
- Closing costs
- $5,025
- Reserves months
- —
- Total cash needed
- —
Loan-product check · same deal, 3 products live
Conventional
25% down · 7.5% · 30yr
- Down + closing
- —
- Monthly P&I
- —
- Monthly cashflow
- —
- DSCR
- —
- Eligible?
- —
Personal DTI + credit; lowest rate.
DSCR
20% down · 8.5% · 30yr
- Down + closing
- —
- Monthly P&I
- —
- Monthly cashflow
- —
- DSCR
- —
- Eligible?
- —
No personal income docs; deal must DSCR.
Hard money
10% down · 12.0% · 12mo
- Down + closing
- —
- Monthly P&I
- —
- Monthly cashflow
- —
- DSCR
- —
- Eligible?
- —
Short-term bridge; refi at stabilization.
Listing history 16 events
-
2026-06-07statusdays on market $167,500 Pending 57 DOM
-
2026-06-05days on market $167,500 Active 56 DOM
-
2026-06-03days on market $167,500 Active 55 DOM
-
2026-06-02days on market $167,500 Active 54 DOM
-
2026-06-01days on market $167,500 Active 53 DOM
-
2026-05-31days on market $167,500 Active 52 DOM
-
2026-05-30days on market $167,500 Active 51 DOM
-
2026-05-11price $167,500
-
2026-04-09$172,500 Active
-
2026-03-09price $172,500
-
2026-01-22price $180,000
-
2025-11-18price $189,900
-
2025-11-03$199,900 Active
-
2024-03-29soldstatus $145,000 321-char remark
Show marketing remark (321 chars)
Easy living with this raised rancher with full walkout basement! This super cute home features 3 bedrooms, 2 on the main level and one on the lower level, two full bathrooms, updated kitchen, two living spaces, plenty of storage space, lower-level deck overlooking back yard. Plenty of parking, super convenient location!
-
2023-11-13$145,000 321-char remark
Show marketing remark (321 chars)
Easy living with this raised rancher with full walkout basement! This super cute home features 3 bedrooms, 2 on the main level and one on the lower level, two full bathrooms, updated kitchen, two living spaces, plenty of storage space, lower-level deck overlooking back yard. Plenty of parking, super convenient location!
-
1984-10-05soldstatus $10,000
ⓘ Source: listings_history table (triggers on properties + properties_extension) + one-shot
backfill from property_details.listing_events for pre-trigger history.
Tax reassessment forecast WV · Resets to sale price
- Current annual tax
- $918 · $77/mo
- Projected year-2 tax
- $988 · $82/mo
- Expected delta
- +$70/yr (+$6/mo · 7.6%)
ⓘ Screening estimate from a state-policy table — verify with the county assessor before closing.
Climate risk First Street
- Flood 1/10 Low FEMA zone X (unshaded) · 0% chance over 30 yrs
- Wildfire 6/10 Major
- Heat 4/10 Moderate 7 d/yr ≥100°F today · 19 d/yr by 30 yrs out
- Wind 2/10 Low 100% chance of damaging wind over 30 yrs
- Air quality 2/10 Low 0 unhealthy d/yr today · 1 by 30 yrs out
Nearby sold comps map
Loading sold comps map…
Walkable amenities ~0.75 mi
Loading nearby amenities…
Taxation est. · year 1
- Rental income
- $14,910
- − Mortgage interest
- −$9,383
- − Property taxes
- −$918
- − Insurance
- −$838
- − Repairs & maintenance
- −$1,193
- − Management
- −$1,193
- − Depreciation
- −$4,873
- Taxable loss
- −$3,486
- Est. tax savings @ 24.0%
- +$837
- After-tax cash flow
- $319/yr
For passive investors: Depreciation is non-cash, so a rental often shows a tax loss while cash-flowing — sheltering income. Rental losses are passive: they offset passive income freely, and up to $25,000/yr can offset ordinary (W-2) income if you actively participate and your MAGI is under $100k (phasing out to $0 by $150k); unused losses carry forward. On sale, claimed depreciation is recaptured at up to 25%, and gains may owe capital-gains tax (a 1031 exchange can defer both). Figures are a year-1 estimate at your 24.0% rate — not tax advice; consult a CPA.
Schools (NCES district)
- District
- Kanawha County Schools
- NCES district ID
- 5400600
- Math proficiency
- 29% ▼ -13.00%
- Reading proficiency
- 40% ▼ -7.00%
- Median HH income
- $44,329
- Composite
- 29.35/100
- National rank
- #6540
- State rank
- #17 of 55 in WV
Livability — Sissonville
- Score
- 62/100
- State rank
- #183
- US rank
- #16829
Category grades
Schools grade is shown separately in the Schools card above.
Census & demographics
- Census place
- Sissonville, WV
- Population (ZIP)
- 10,089
Population outlook (Kanawha County) Hauer SSP2
- Today (2025)
- 178,946 people
- By 2030
- 172,906 · -3.4%
- By 2040
- 159,874 · -10.7%
- By 2050
- 148,148 · -17.2%
- By 2075
- 123,257 · -31.1%
- By 2100
- 96,454 · -46.1%
Race, ethnicity, and origin ACS 2023
- Neighborhood character
- Predominantly White (96%)
- Race & ethnicity
- White 96% Two or more races 1%
- Common ancestry
- Slovak 2% Iranian 1% Serbian 1%
Political lean MEDSL · Kanawha
- 2024 margin
- R (+17.4) · D 40.2% · R 57.6% · Other 2.2%
- 2008→2024 swing
- -17.0pp toward R · 2008: -0.4pp · 2024: -17.4pp
- All cycles
- 2024: R+17.4 2020: R+14.7 2016: R+20.6 2012: R+11.9 2008: R+0.4
Not yet ingested
- Civics
- —
Market trends
- HPI YoY
- ▼ -1.04%
- Current HPI
- 205.2853
- Rent YoY
- —
- Metro
- —
- State GDP YoY
- —
- F500 in state
- 0
Price history
+1575.0% since first listed9 events — show timeline
- 2026-05-11 Price Changed $167,500 KVBOR
- 2026-04-09 Listed $172,500 KVBOR
- 2026-03-09 Price Changed $172,500 KVBOR
- 2026-01-22 Price Changed $180,000 KVBOR
- 2025-11-18 Price Changed $189,900 KVBOR
- 2025-11-03 Listed $199,900 KVBOR
- 2024-03-29 Sold (MLS) $145,000 KVBOR
- 2023-11-13 Listed $145,000 KVBOR
- 1984-10-05 Sold (Public Records) $10,000 Public Records
Property tax history
+7.1%/yrLatest (2025): $918 · +52.8% YoY. Source: county tax records.
Cash-flow waterfall
monthlySold comps — $/sqft
last 12 mo · ≤1 miLoading sold comps…