44431 Lakewood Dr · Prairieville, LA
Flood risk 1/10 · Minimal
- FEMA flood zone
- X
- Chance of flooding over 30 yrs
- 0.0%
- Est. flood insurance / yr
- $507 – $1,088
Fire risk 1/10 · Minimal
- Est. fire insurance / yr
- $1,269 – $2,357
Heat risk 8/10 · Major
- Hot days now (above 108°F)
- 7 days/yr
- Hot days in 30 yrs
- 22 days/yr
Wind risk 9/10 · Severe
- Chance of severe wind over 30 yrs
- 99.0%
Air-quality risk 2/10 · Minimal
- Unhealthy air days now
- 2 days/yr
- Unhealthy air days in 30 yrs
- 2 days/yr
Risk factors via First Street. Map © Google.
Why this score? — see what drove the B grade
The composite is a weighted blend of 9 inputs, each scored 0–100. Each bar is that input's sub-score; the figure is the points it added to the 100-point composite (weight × sub-score).
- Cash flow +30.0/30.0
- 1% rule +10.0/10.0
- DSCR +10.0/10.0
- ARV discount +7.5/15.0
- Schools +4.7/10.0
- Livability +3.5/5.0
- Rent growth +3.4/5.0
- Condition / age +2.5/5.0
- Appreciation +0.0/10.0
$120,000
🖨 Deal sheet (PDF) 📄 Offer letter ✓ Due diligence
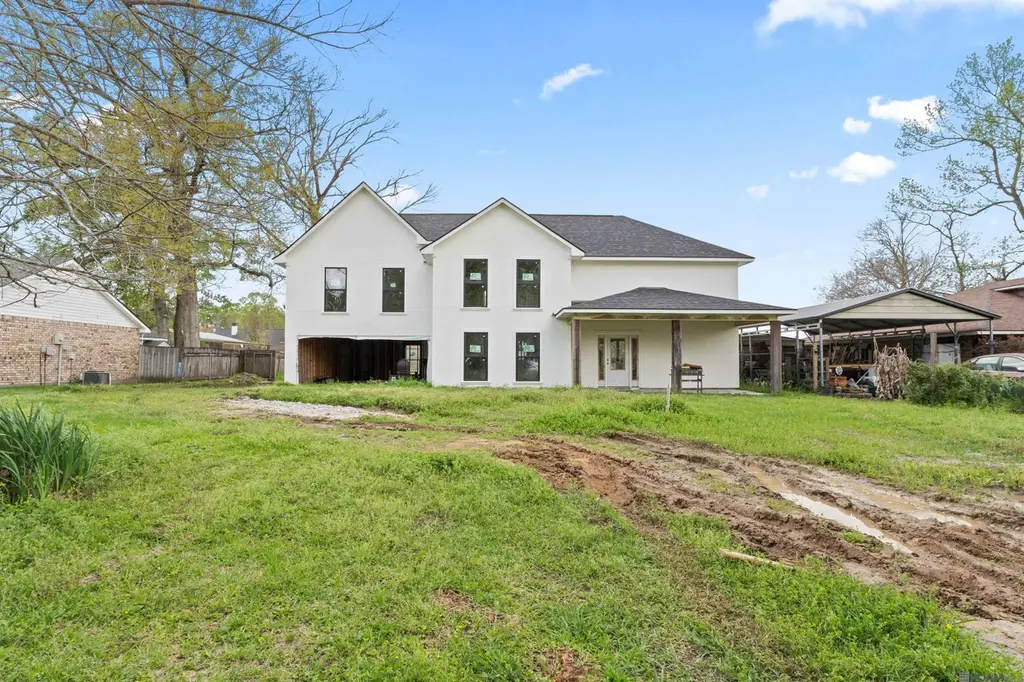
Listing remarks MLS
Flood Zone X!!! Investor special with tons of potential! This two-story property is already well underway, featuring new construction elements and a solid structure ready for your finishing touches. Situated on a spacious lot, it offers a great layout, covered parking, and plenty of opportunity to add value. Ideal for a flip, rental, or custom project. Estimated resale potential around $400K. Submit HIGHEST & BEST Offer.
Key facts
- Covered parking
- Great layout
- Spacious lot
Tags
Neighborhood map
What this means for you Summary
Snapshot
- This is a 5-bed/3.0-bath other listed at $120k.
Deal economics
- At list price, monthly cash flow is $1k ($15k/yr) — positive.
- The deal already cash-flows at list — no discount required.
- Meets the 1% rule at list price ($2k rent vs $120k).
- Recommended offer: $113k (6.0% below list) — sets the bar for market timing.
- Cap rate 18.5% vs local median 4.3% in Prairieville — top-decile yield for the area; either an underpriced asset or a hidden risk that comps aren't pricing in. Stress-test before assuming the spread holds.
Location & tenants
- Location reads 69/100 on livability (#70 in LA) — a middle-class / working-renter tenant base. Strengths: schools A+, employment A+, housing A+; Watch: amenities F, commute F, health & safety F.
- Ascension Parish (suburban): math 48% / reading 58% proficiency, ranked #7 of 98 in LA (top 7%) — acceptable for families but not a draw, mixed tenant base, ~2y average lease.
- Market conditions: Rents rising (+3.5%/yr); 496 active listings in the ZIP; solid renter incomes; 579 units permitted in Ascension Parish in 2024 (0 in 5+ unit buildings).
Forward outlook
- Local home prices are declining (-3.0%/yr); year-one equity from $830 of loan paydown is wiped out by about $4k of value loss. Plan a longer hold.
- Ascension County population projected at +43% by 2050 — long-run rental-demand tailwind backs the buy-and-hold thesis.
- At projected returns (-3.0% appreciation + 3.5% rent growth), your $34k cash investment doubles in ~3 years — after that, you're playing with house money.
Negotiation context
- It's been on market 89 days — a 6% lower offer ($113k) is reasonable based on typical stale-listing flexibility.
- 12 sale attempts since 22y ago; this cycle's ask is 21% above the opening price — seller raised mid-cycle; expect resistance to lowballs.
- Current owner paid $80k; list at $120k implies a 50% gain — meaningful room to come down on a strong offer.
Risks & watch-outs
- Climate carrying-cost: severe wind risk, 99% chance of damaging wind over 30y; extreme-heat days projected 7→22/yr by 2055 (HVAC capex compounding) — expect insurance premiums to compound above CPI over the hold.
Questions for the listing agent
- It's been on market 89 days. Have you received any prior offers? Is the seller open to a 6% concession, seller financing, or rate buy-down credit?
- Why hasn't it sold? Are there any deal-killer items the seller is aware of (foundation, flood, title, zoning, code violations)?
- Is there a deadline driving the sale (1031 exchange, divorce, estate, relocation)? That informs how much negotiation room exists.
- Schools are A-rated — typically a magnet for longer-tenancy family renters. What's the average tenant stay here, and is there a school-zone premium baked into asking?
- What's the average days-on-market for RENTAL listings here right now (not sales)? A rising rental-DOM trend means longer vacancies and softer asking-rent achievability than the comps imply.
- What's the recent tenant-quality profile in this submarket — average credit score on applications, eviction rate, late-payment / NSF rate, and stable-employment percentage? A property-management company in the area should have these aggregated.
- How much new for-sale + rental construction is in the pipeline within 1–3 miles? Heavy new supply typically softens prices + rents 12–24 months out; constrained supply supports both.
Investment metrics
- 1% rule
- 2.04% ✓
- Cap rate
- 18.49%
- Cash-on-cash
- 43.56%
- DSCR
- 2.94
- GRM
- 4.1
CMA / ARV
- ARV (median comp)
- $432,133
- List price
- $120,000
- Delta
- -72.23%
- Verdict
- UNDERPRICED
- Comps
- 5 within 1.0 mi
Projected returns pro-forma
-3.0% appreciation · 3.47% rent growth · sell at horizon
- IRR
- 40.9%
- Equity multiple
- 2.77×
- Total profit
- $59,358
- Equity at exit
- $17,892
- IRR
- 47.4%
- Equity multiple
- 5.65×
- Total profit
- $156,383
- Equity at exit
- $10,375
Cash invested: $33,600 (down + closing). Projections, not guarantees.
Landlord ↔ Tenant lean methodology
- Overall (STATE)
- 90 Strongly Landlord-Friendly
- State Louisiana
- 90 Strongly Landlord-Friendly · R+12
- County
- — inherits STATE
- City
- — inherits STATE
ZIP-level market 70769
- Rents YoY
- 3.5%
- Active inventory
- 496
- Price-to-rent
- 4.1×
Monthly cashflow live
- Estimated rent
- $2,446 medium interval (Pro) →
- Mortgage (P&I)
- −$629
- Tax from tax record
- −$34 /mo · $405/yr
- Insurance
- −$50
- HOA
- −$0
- Vacancy / Maint / Mgmt
- −$514
- Net cashflow
- $1,220
Break-even live
Sensitivity live
| Price | -10% $1,288 | -5% $1,254 | +0% $1,220 | +5% $1,186 | +10% $1,152 |
|---|---|---|---|---|---|
| Rent | -10% $1,026 | -5% $1,123 | +0% $1,220 | +5% $1,316 | +10% $1,413 |
| Rate | -1.0pp $1,280 | -0.5pp $1,250 | base $1,220 | +0.5pp $1,188 | +1.0pp $1,157 |
UW: 25.0% down · 7.5% · 30yr · 1.5% tax · 5.0% vac · 8.0% maint · 8.0% mgmt
Financing live
Cash to close
- Down payment
- $30,000
- Closing costs
- $3,600
- Reserves months
- —
- Total cash needed
- —
Loan-product check · same deal, 3 products live
Conventional
25% down · 7.5% · 30yr
- Down + closing
- —
- Monthly P&I
- —
- Monthly cashflow
- —
- DSCR
- —
- Eligible?
- —
Personal DTI + credit; lowest rate.
DSCR
20% down · 8.5% · 30yr
- Down + closing
- —
- Monthly P&I
- —
- Monthly cashflow
- —
- DSCR
- —
- Eligible?
- —
No personal income docs; deal must DSCR.
Hard money
10% down · 12.0% · 12mo
- Down + closing
- —
- Monthly P&I
- —
- Monthly cashflow
- —
- DSCR
- —
- Eligible?
- —
Short-term bridge; refi at stabilization.
Listing history 39 events
-
2026-06-21days on market $120,000 Active 89 DOM
-
2026-06-18days on market $120,000 Active 86 DOM
-
2026-06-17days on market $120,000 Active 85 DOM
-
2026-06-16pricedays on market $120,000 Active 84 DOM
-
2026-06-15days on market $130,000 Active 83 DOM
-
2026-06-14days on market $130,000 Active 81 DOM
-
2026-06-10days on market $130,000 Active 78 DOM
-
2026-06-09days on market $130,000 Active 77 DOM
-
2026-06-08days on market $130,000 Active 76 DOM
-
2026-06-07days on market $130,000 Active 75 DOM
-
2026-06-05days on market $130,000 Active 72 DOM
-
2026-06-03pricedays on market $130,000 Active 71 DOM
-
2026-06-02days on market $149,900 Active 70 DOM
-
2026-06-01days on market $149,900 Active 69 DOM
-
2026-05-31days on market $149,900 Active 68 DOM
-
2026-05-31days on market $149,900 Active 67 DOM
-
2026-04-10price $149,900 428-char remark
Show marketing remark (430 chars)
Flood Zone X!!! Investor special with tons of potential! This two-story property is already well underway, featuring new construction elements and a solid structure ready for your finishing touches. Situated on a spacious lot, it offers a great layout, covered parking, and plenty of opportunity to add value. Ideal for a flip, rental, or custom project. Estimated resale potential around $400K. Submit HIGHEST & BEST Offer.
-
2026-04-10price $149,900 430-char remark
Show marketing remark (430 chars)
Flood Zone X!!! Investor special with tons of potential! This two-story property is already well underway, featuring new construction elements and a solid structure ready for your finishing touches. Situated on a spacious lot, it offers a great layout, covered parking, and plenty of opportunity to add value. Ideal for a flip, rental, or custom project. Estimated resale potential around $400K. Submit HIGHEST & BEST Offer.
-
2026-03-24$99,000 Active 430-char remark
Show marketing remark (428 chars)
Flood Zone X!!! Investor special with tons of potential! This two-story property is already well underway, featuring new construction elements and a solid structure ready for your finishing touches. Situated on a spacious lot, it offers a great layout, covered parking, and plenty of opportunity to add value. Ideal for a flip, rental, or custom project. Estimated resale potential around $400K. Submit HIGHEST & BEST Offer.
-
2026-03-24$99,000 Active 428-char remark
Show marketing remark (428 chars)
Flood Zone X!!! Investor special with tons of potential! This two-story property is already well underway, featuring new construction elements and a solid structure ready for your finishing touches. Situated on a spacious lot, it offers a great layout, covered parking, and plenty of opportunity to add value. Ideal for a flip, rental, or custom project. Estimated resale potential around $400K. Submit HIGHEST & BEST Offer.
-
2025-08-22soldstatus $80,000
-
2023-01-24soldstatus $45,000
-
2022-12-12soldstatus $324,625
-
2014-08-01soldstatus $197,900
-
2014-01-15soldstatus
-
2013-10-02$86,500
-
2013-10-02$86,500
-
2008-11-20soldstatus $109,900
-
2008-08-21soldstatus
-
2008-08-12soldstatus
-
2008-04-18$114,900
-
2008-04-18$114,900
-
2006-01-06$117,600
-
2006-01-06$117,600
-
2005-05-05$124,900
-
2005-05-05$124,900
-
2004-07-28$149,900
-
2004-07-28$149,900
-
2003-02-10soldstatus $139,000
ⓘ Source: listings_history table (triggers on properties + properties_extension) + one-shot
backfill from property_details.listing_events for pre-trigger history.
Tax reassessment forecast LA · Resets to sale price
- Current annual tax
- $405 · $34/mo
- Projected year-2 tax
- $660 · $55/mo
- Expected delta
- +$255/yr (+$21/mo · 62.8%)
ⓘ Screening estimate from a state-policy table — verify with the county assessor before closing.
Climate risk First Street
- Flood 1/10 Low FEMA zone X · 0% chance over 30 yrs
- Wildfire 1/10 Low
- Heat 8/10 Severe 7 d/yr ≥108°F today · 22 d/yr by 30 yrs out
- Wind 9/10 Extreme 99% chance of damaging wind over 30 yrs
- Air quality 2/10 Low 2 unhealthy d/yr today · 2 by 30 yrs out
Nearby sold comps map
Loading sold comps map…
Walkable amenities ~0.75 mi
Loading nearby amenities…
Taxation est. · year 1
- Rental income
- $29,357
- − Mortgage interest
- −$6,722
- − Property taxes
- −$405
- − Insurance
- −$600
- − Repairs & maintenance
- −$2,349
- − Management
- −$2,349
- − Depreciation
- −$3,491
- Taxable income
- $13,442
- Est. tax owed @ 24.0%
- −$3,226
- After-tax cash flow
- $11,409/yr
For passive investors: Depreciation is non-cash, so a rental often shows a tax loss while cash-flowing — sheltering income. Rental losses are passive: they offset passive income freely, and up to $25,000/yr can offset ordinary (W-2) income if you actively participate and your MAGI is under $100k (phasing out to $0 by $150k); unused losses carry forward. On sale, claimed depreciation is recaptured at up to 25%, and gains may owe capital-gains tax (a 1031 exchange can defer both). Figures are a year-1 estimate at your 24.0% rate — not tax advice; consult a CPA.
Schools (NCES district)
- District
- Ascension Parish
- NCES district ID
- 2200090
- Math proficiency
- 48% ▼ -31.00%
- Reading proficiency
- 58% ▼ -25.00%
- Median HH income
- $68,423
- Composite
- 47.0/100
- National rank
- #2347
- State rank
- #7 of 98 in LA
Livability — Prairieville
- Score
- 69/100
- State rank
- #70
- US rank
- #8507
Category grades
Schools grade is shown separately in the Schools card above.
Census & demographics
- County
- Ascension Parish · 98,362 people
- City population
- 49,278
- Metro
- Baton Rouge, LA
- Population (ZIP)
- 49,278
- Household income
- $109,404
- Rent vs Own
- Severe rent burden
- 91.0
Population outlook (Ascension County) Hauer SSP2
- Today (2025)
- 145,480 people
- By 2030
- 158,329 · +8.8%
- By 2040
- 183,741 · +26.3%
- By 2050
- 207,615 · +42.7%
- By 2075
- 260,244 · +78.9%
- By 2100
- 289,576 · +99.0%
Race, ethnicity, and origin ACS 2023
- Neighborhood character
- Predominantly White (73%)
- Race & ethnicity
- White 73% Black 15% Two or more races 6% Hispanic / Latino 6% Asian 1%
- Hispanic origin (detail)
- Mexican 2%
- Common ancestry
- Lithuanian 16% Italian 1% Slovak 1%
- Foreign-born
- 4% · Canada
- Languages at home
- 93% English-only · Spanish 4% Other Indo-European 1%
Political lean MEDSL · Ascension
- 2024 margin
- Solid R (+34.0) · D 32.2% · R 66.1% · Other 1.7%
- 2008→2024 swing
- +1.7pp toward D · 2008: -35.7pp · 2024: -34.0pp
- All cycles
- 2024: R+34.0 2020: R+32.5 2016: R+36.0 2012: R+34.3 2008: R+35.7
Not yet ingested
- Civics
- —
Market trends
- HPI YoY
- ▼ -111.56%
- Current HPI
- 144.2267
- Rent YoY
- ▲ 3.47%
- Metro
- Baton Rouge, LA
- State GDP YoY
- ▲ 3.29%
- F500 in state
- 10
Industry mix (Fortune 500 HQ in LA)
| Industry | F500 HQs | Revenue |
|---|---|---|
| Telecommunications | 2 | $23B |
|
||
| Utilities | 1 | $12B |
|
||
| Wholesale / Distribution | 1 | $5B |
|
||
| Advertising | 1 | $2B |
|
||
Price history
+7.8% since first listed23 events — show timeline
- 2026-04-10 Price Changed $149,900 AcadianaMLS
- 2026-04-10 Price Changed $149,900 GBRMLS
- 2026-03-24 Listed $99,000 GBRMLS
- 2026-03-24 Listed $99,000 AcadianaMLS
- 2025-08-22 Sold (Public Records) $80,000 Public Records
- 2023-01-24 Sold (Public Records) $45,000 Public Records
- 2022-12-12 Sold (Public Records) $324,625 Public Records
- 2014-08-01 Sold (Public Records) $197,900 Public Records
- 2014-01-15 Sold (MLS) — GBRMLS
- 2013-10-02 Listed $86,500 AcadianaMLS
- 2013-10-02 Listed $86,500 GBRMLS
- 2008-11-20 Sold (Public Records) $109,900 Public Records
- 2008-08-21 Sold (Public Records) — Public Records
- 2008-08-12 Sold (MLS) — GBRMLS
- 2008-04-18 Listed $114,900 GBRMLS
- 2008-04-18 Listed $114,900 AcadianaMLS
- 2006-01-06 Listed $117,600 AcadianaMLS
- 2006-01-06 Listed $117,600 GBRMLS
- 2005-05-05 Listed $124,900 AcadianaMLS
- 2005-05-05 Listed $124,900 GBRMLS
- 2004-07-28 Listed $149,900 AcadianaMLS
- 2004-07-28 Listed $149,900 GBRMLS
- 2003-02-10 Sold (Public Records) $139,000 Public Records
Property tax history
-10.5%/yrLatest (2025): $405 · -1.8% YoY. Source: county tax records.
Cash-flow waterfall
monthlySold comps — $/sqft
last 12 mo · ≤1 miLoading sold comps…