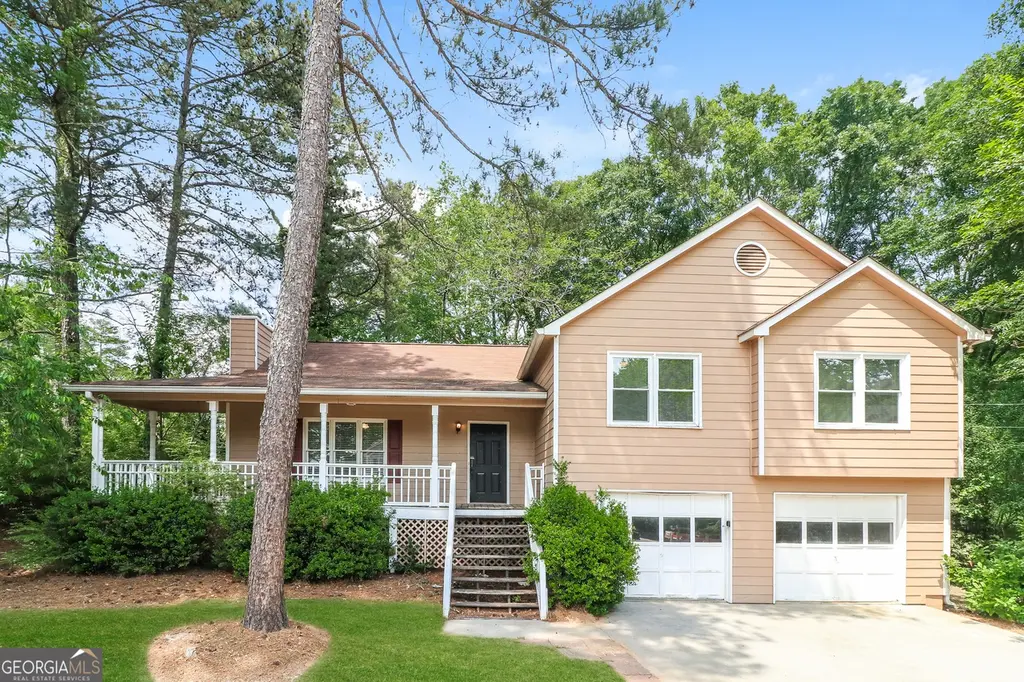
21 Willow Bend Dr · Hiram, GA
Flood risk 1/10 · Minimal
- FEMA flood zone
- X (unshaded)
- Chance of flooding over 30 yrs
- 0.0%
- Est. flood insurance / yr
- $473 – $860
Fire risk 5/10 · Moderate
- Est. fire insurance / yr
- $963 – $1,789
Heat risk 5/10 · Moderate
- Hot days now (above 103°F)
- 7 days/yr
- Hot days in 30 yrs
- 18 days/yr
Wind risk 5/10 · Moderate
- Chance of severe wind over 30 yrs
- 25.0%
Air-quality risk 4/10 · Minor
- Unhealthy air days now
- 4 days/yr
- Unhealthy air days in 30 yrs
- 5 days/yr
Risk factors via First Street. Map © Google.
Why this score? — see what drove the D grade
The composite is a weighted blend of 9 inputs, each scored 0–100. Each bar is that input's sub-score; the figure is the points it added to the 100-point composite (weight × sub-score).
- ARV discount +15.0/15.0
- Cash flow +8.7/30.0
- Schools +3.6/10.0
- Livability +3.4/5.0
- Rent growth +3.2/5.0
- Condition / age +2.5/5.0
- DSCR +2.4/10.0
- 1% rule +2.2/10.0
- Appreciation +0.0/10.0
$300,700
🖨 Deal sheet (PDF) 📄 Offer letter ✓ Due diligence
Listing remarks
Check out this 3 bed, 2 1/2 bath home in Hiram. Drive up to find a welcoming front porch. Take notice of the beautiful, mature landscaping all around the home. Step inside and find the living room, complete with ceiling fan and fireplace. And right off the dining room is the sunroom. And the backyard is perfect for incorporating your own landscaping touches. Schedule your showing today.
Key facts
- Ceiling fan
- Front porch
- Living room
Tags
Property features AI
Finance
- Other: Lot size about 0.43 acre
- Financial info: Investor-owned special listing condition; Accepts Cash, Conventional, FHA, VA financing
- HOA & community: No HOA
Exterior
- Parking: Attached garage
- Utilities: Public water; Septic sewer; Electricity available; Natural gas available
- Home design: Single-family residence (house); Two levels; Resale property
- Construction: Built in 1994; Other construction materials
- Exterior features: Composition roof; Lot includes other features
Interior
- Kitchen: Dishwasher; Refrigerator
- Bedrooms: 3 bedrooms
- Flooring: Carpet; Laminate; Tile
- Bathrooms: 2 full bathrooms; 1 half bathroom
- Heating & cooling: Forced air heating (natural gas); Central air conditioning
- Interior features: Walk-in closet(s); Finished basement; Sun room; Fireplace (1)
- Laundry & utility: Laundry in basement
Neighborhood map
What this means for you Summary
Snapshot
- This is a 3-bed/2.5-bath single-family listed at $301k.
Deal economics
- At list price, monthly cash flow is $-256 ($-3k/yr) — negative.
- To cash-flow at today's rent, offer at most $256k (15.0% below list).
- To meet the 1% rule (rent ≥ 1% of price), the offer needs to be $216k (28.1% below list).
- Recommended offer: $216k (28.1% below list) — sets the bar for 1% rule.
- Cap rate 5.3% vs local median 3.8% in Hiram — top-decile yield for the area; either an underpriced asset or a hidden risk that comps aren't pricing in. Stress-test before assuming the spread holds.
Location & tenants
- Location reads 68/100 on livability (#152 in GA) — a middle-class / working-renter tenant base. Strengths: employment A+, cost of living A+, housing A+; Watch: amenities D+, crime F, commute F.
- Paulding County (suburban): math 39% / reading 42% proficiency, ranked #33 of 174 in GA (top 19%) — families likely to look elsewhere, expect single-tenant / working-renter base with shorter leases.
- Zoned schools: Sam D. Panter Elementary School (math 38% / reading 37%, grade F, #474 of 1,228 statewide, top 39%, 511 students, 63% FRL); J. A. Dobbins Middle School (math 28% / reading 37%, grade F, #221 of 470 statewide, top 48%, 532 students, 61% FRL); Hiram High School (math 19% / reading 17%, grade F, #258 of 424 statewide, top 62%, 1,468 students, 55% FRL) — zoned schools average 60% FRL vs 33% district-wide (26 pts higher); higher-poverty schools than district average — tighter screening recommended.
- Market conditions: Rents rising (+2.9%/yr); 240 active listings in the ZIP; 4 comparable units currently listed for rent nearby; rentals lingering (median 46d on market — plan ~5-8 weeks vacancy on turnover, expect pricing pressure); 50% of comp listings sitting > 30 days — soft ceiling on asking rent; solid renter incomes; 1,458 units permitted in Paulding County in 2024 (0 in 5+ unit buildings).
Forward outlook
- Local home prices are declining (-3.0%/yr); year-one equity from $2k of loan paydown is wiped out by about $9k of value loss. Plan a longer hold.
- Paulding County population projected at +24% by 2050 — long-run rental-demand tailwind backs the buy-and-hold thesis.
Negotiation context
- It's been on market 49 days — a 3% lower offer ($292k) is reasonable based on typical stale-listing flexibility.
Risks & watch-outs
- Climate carrying-cost: moderate wind risk, 25% chance of damaging wind over 30y; moderate wildfire risk; extreme-heat days projected 7→18/yr by 2055 (HVAC capex compounding) — expect insurance premiums to compound above CPI over the hold.
Questions for the listing agent
- What do current leases actually rent for vs. the listed asking? Can we see a recent rent roll and the last 12 months of T-12 income?
- It's been on market 49 days. Have you received any prior offers? Is the seller open to a 28% concession, seller financing, or rate buy-down credit?
- Is there a deadline driving the sale (1031 exchange, divorce, estate, relocation)? That informs how much negotiation room exists.
- Schools are D-rated, which usually means shorter tenancies and higher turnover. Who's the typical renter profile here, and what's been the actual vacancy rate?
- Crime grade is F in this area — have there been break-ins, vandalism, or insurance claims at this property in the last 3 years? What carrier currently insures it and at what premium?
- The area grade is low — what's the realistic commute time and amenity access for the typical tenant pool here? Any planned neighborhood developments (good or bad) we should know about?
- What's the average days-on-market for RENTAL listings here right now (not sales)? A rising rental-DOM trend means longer vacancies and softer asking-rent achievability than the comps imply.
- What's the recent tenant-quality profile in this submarket — average credit score on applications, eviction rate, late-payment / NSF rate, and stable-employment percentage? A property-management company in the area should have these aggregated.
- How much new for-sale + rental construction is in the pipeline within 1–3 miles? Heavy new supply typically softens prices + rents 12–24 months out; constrained supply supports both.
Investment metrics
- 1% rule
- 0.72% ✗
- Cap rate
- 5.27%
- Cash-on-cash
- -3.64%
- DSCR
- 0.84
- GRM
- 11.6
CMA / ARV
- ARV (median comp)
- $514,495
- List price
- $300,700
- Delta
- -41.55%
- Verdict
- UNDERPRICED
- Comps
- 20 within 1.0 mi
Show comp detail 12 sales within ~0.75 mi
| Address | Dist | Beds/Ba | Sqft | Sold | Price | $/sf | Match |
|---|---|---|---|---|---|---|---|
| 278 Willow Bend Dr | 0.25mi | 4/2.5 (+1) | 1,810 (+6%) | 1mo | $322,915 | $178 | 72 |
| 261 Township Dr | 0.54mi | 3/2.0 | 1,648 (-3%) | 3mo | $289,900 | $176 | 65 |
| 77 Township Dr | 0.45mi | 4/2.5 (+1) | 1,652 (-3%) | 13mo | $344,900 | $209 | 59 |
| 196 Boulder Run | 0.61mi | 3/2.5 | 1,800 (+6%) | 12mo | $315,000 | $175 | 52 |
| 3124 Hiram Sudie Rd | 0.48mi | 4/2.0 (+1) | 1,879 (+10%) | 4mo | $369,000 | $196 | 50 |
| 597 Rich Davis Rd | 0.73mi | 3/2.0 | 1,621 (-5%) | 12mo | $315,000 | $194 | 46 |
| 95 Gorham Gates Dr | 0.65mi | 3/2.0 | 1,575 (-7%) | 12mo | $359,000 | $228 | 45 |
| 0 Rich Davis Rd | 0.52mi | 4/2.0 (+1) | 1,768 (+4%) | 22mo | $396,150 | $224 | 44 |
| 210 Boulder Run | 0.61mi | 3/2.0 | 1,800 (+6%) | 20mo | $250,000 | $139 | 43 |
| 63 Boulder Run | 0.56mi | 3/2.0 | 1,924 (+13%) | 19mo | $339,000 | $176 | 34 |
| 63 Boulder Run | 0.56mi | 3/2.0 | 1,924 (+13%) | 19mo | $339,000 | $176 | 34 |
| 256 Bollen Ln | 0.69mi | 4/2.0 (+1) | 1,930 (+14%) | 12mo | $345,000 | $179 | 28 |
Match score weights: distance 35% · size 25% · config 20% · recency 20%. Top-matched comps best support the ARV.
Projected returns pro-forma
-3.0% appreciation · 2.9% rent growth · sell at horizon
- IRR
- -22.5%
- Equity multiple
- 0.22×
- Total profit
- $-65,257
- Equity at exit
- $44,835
- IRR
- -17.0%
- Equity multiple
- 0.06×
- Total profit
- $-78,826
- Equity at exit
- $25,999
Cash invested: $84,196 (down + closing). Projections, not guarantees.
Landlord ↔ Tenant lean methodology
- Overall (STATE)
- 90 Strongly Landlord-Friendly
- State Georgia
- 90 Strongly Landlord-Friendly · R+3
- County
- — inherits STATE
- City
- — inherits STATE
ZIP-level market 30141
- Home prices YoY
- -17.3%
- Rents YoY
- 2.9%
- Active inventory
- 240
- Price-to-rent
- 11.6×
Monthly cashflow live
- Estimated rent
- $2,161 medium interval (Pro) →
- Mortgage (P&I)
- −$1,577
- Tax from tax record
- −$261 /mo · $3,129/yr
- Insurance
- −$125
- HOA
- −$0
- Lot rent
- −$0
- Vacancy / Maint / Mgmt
- −$454
- Net cashflow
- $-256
Break-even live
Sensitivity live
| Price | -10% $-85 | -5% $-170 | +0% $-256 | +5% $-341 | +10% $-426 |
|---|---|---|---|---|---|
| Rent | -10% $-426 | -5% $-341 | +0% $-256 | +5% $-170 | +10% $-85 |
| Rate | -1.0pp $-104 | -0.5pp $-179 | base $-256 | +0.5pp $-333 | +1.0pp $-413 |
UW: 25.0% down · 7.5% · 30yr · 1.5% tax · 5.0% vac · 8.0% maint · 8.0% mgmt
Financing live
Cash to close
- Down payment
- $75,175
- Closing costs
- $9,021
- Reserves months
- —
- Total cash needed
- —
Loan-product check · same deal, 3 products live
Conventional
25% down · 7.5% · 30yr
- Down + closing
- —
- Monthly P&I
- —
- Monthly cashflow
- —
- DSCR
- —
- Eligible?
- —
Personal DTI + credit; lowest rate.
DSCR
20% down · 8.5% · 30yr
- Down + closing
- —
- Monthly P&I
- —
- Monthly cashflow
- —
- DSCR
- —
- Eligible?
- —
No personal income docs; deal must DSCR.
Hard money
10% down · 12.0% · 12mo
- Down + closing
- —
- Monthly P&I
- —
- Monthly cashflow
- —
- DSCR
- —
- Eligible?
- —
Short-term bridge; refi at stabilization.
Rent comps 4 comps
| Address | Beds | Baths | Sqft | Rent | $/sqft | DOM | Units | Dist |
|---|---|---|---|---|---|---|---|---|
| 319 Lanier Ct Hiram, GA | 4.0 | 2.5 | 1974 | $2,225 | $1.13 | 46d | 1 | 0.67mi |
| 48 Temperence Way Hiram, GA | 3.0 | 2.0 | 1632 | $1,921 | $1.18 | 7d | 1 | 0.72mi |
| 124 Spring Dr Hiram, GA | 4.0 | 2.0 | 1440 | $1,796 | $1.25 | 46d | 1 | 0.77mi |
| 28 Doe Ln Hiram, GA | 4.0 | 2.0 | 2080 | $2,035 | $0.98 | 0d | 1 | 1.32mi |
Listing history 23 events
-
2026-06-22days on market $300,700 Active 49 DOM
-
2026-06-21days on market $300,700 Active 48 DOM
-
2026-06-18days on market $300,700 Active 45 DOM
-
2026-06-17days on market $300,700 Active 44 DOM
-
2026-06-16days on market $300,700 Active 43 DOM
-
2026-06-15days on market $300,700 Active 42 DOM
-
2026-06-13days on market $300,700 Active 40 DOM
-
2026-06-13days on market $300,700 Active 39 DOM
-
2026-06-09days on market $300,700 Active 36 DOM
-
2026-06-08statusdays on market $300,700 Active 35 DOM
-
2026-06-07pricestatusdays on market $300,700 Price Change 34 DOM
-
2026-06-04days on market $305,400 Active 31 DOM
-
2026-06-03days on market $305,400 Active 30 DOM
-
2026-06-02days on market $305,400 Active 29 DOM
-
2026-06-01days on market $305,400 Active 28 DOM
-
2026-05-31days on market $305,400 Active 27 DOM
-
2026-05-01$310,000 New 389-char remark
-
2022-04-22price $1,795
-
2021-10-05soldstatus $1,029,613
-
2021-08-03soldstatus $490,000
-
2010-01-26price $132,900
-
1994-05-24soldstatus $87,400
-
1993-01-27soldstatus $11,300
ⓘ Source: listings_history table (triggers on properties + properties_extension) + one-shot
backfill from property_details.listing_events for pre-trigger history.
Tax reassessment forecast GA · Resets to sale price
- Current annual tax
- $3,129 · $261/mo
- Projected year-2 tax
- $3,129 · $261/mo
- Expected delta
- $0/yr ($0/mo · 0.0%)
ⓘ Screening estimate from a state-policy table — verify with the county assessor before closing.
Climate risk First Street
- Flood 1/10 Low FEMA zone X (unshaded) · 0% chance over 30 yrs
- Wildfire 5/10 Major
- Heat 5/10 Major 7 d/yr ≥103°F today · 18 d/yr by 30 yrs out
- Wind 5/10 Major 25% chance of damaging wind over 30 yrs
- Air quality 4/10 Moderate 4 unhealthy d/yr today · 5 by 30 yrs out
Nearby sold comps map
Loading sold comps map…
Walkable amenities ~0.75 mi
Loading nearby amenities…
Taxation est. · year 1
- Rental income
- $25,936
- − Mortgage interest
- −$16,844
- − Property taxes
- −$3,129
- − Insurance
- −$1,504
- − Repairs & maintenance
- −$2,075
- − Management
- −$2,075
- − Depreciation
- −$8,748
- Taxable loss
- −$8,438
- Est. tax savings @ 24.0%
- +$2,025
- After-tax cash flow
- $-1,041/yr
For passive investors: Depreciation is non-cash, so a rental often shows a tax loss while cash-flowing — sheltering income. Rental losses are passive: they offset passive income freely, and up to $25,000/yr can offset ordinary (W-2) income if you actively participate and your MAGI is under $100k (phasing out to $0 by $150k); unused losses carry forward. On sale, claimed depreciation is recaptured at up to 25%, and gains may owe capital-gains tax (a 1031 exchange can defer both). Figures are a year-1 estimate at your 24.0% rate — not tax advice; consult a CPA.
Schools (NCES district)
- District
- Paulding County
- NCES district ID
- 1304020
- Math proficiency
- 39% ▼ -6.00%
- Reading proficiency
- 42% ▼ -7.00%
- Median HH income
- $61,447
- Composite
- 36.0/100
- National rank
- #4784
- State rank
- #33 of 174 in GA
Livability — Hiram
- Score
- 68/100
- State rank
- #152
- US rank
- #9861
Category grades
Schools grade is shown separately in the Schools card above.
Census & demographics
- County
- Paulding County · 134,013 people
- City population
- 27,220
- Metro
- Atlanta-Sandy Springs-Alpharetta, GA
- Population (ZIP)
- 27,220
- Household income
- $86,824
- Rent vs Own
- Severe rent burden
- 498.0
Population outlook (Paulding County) Hauer SSP2
- Today (2025)
- 175,714 people
- By 2030
- 186,082 · +5.9%
- By 2040
- 204,414 · +16.3%
- By 2050
- 217,040 · +23.5%
- By 2075
- 236,980 · +34.9%
- By 2100
- 238,314 · +35.6%
Race, ethnicity, and origin ACS 2023
- Neighborhood character
- Diverse neighborhood (Simpson 0.61)
- Race & ethnicity
- White 52% Black 33% Two or more races 9% Hispanic / Latino 8% Asian 1%
- Hispanic origin (detail)
- Mexican 4%
- Common ancestry
- Slovak 3% Lithuanian 2% Iranian 2%
- Foreign-born
- 10% · Canada
- Languages at home
- 89% English-only · Spanish 7% Other Indo-European 1%
Political lean MEDSL · Paulding
- 2024 margin
- Strong R (+24.1) · D 37.6% · R 61.7%
- 2008→2024 swing
- +14.4pp toward D · 2008: -38.5pp · 2024: -24.1pp
- All cycles
- 2024: R+24.1 2020: R+29.1 2016: R+41.2 2012: R+43.6 2008: R+38.5
Not yet ingested
- Civics
- —
Market trends
- HPI YoY
- ▼ -41.28%
- Current HPI
- 197.6767
- Rent YoY
- ▲ 2.90%
- Metro
- Atlanta-Sandy Springs-Alpharetta, GA
- State GDP YoY
- ▲ 2.66%
- F500 in state
- 28
Industry mix (Fortune 500 HQ in GA)
| Industry | F500 HQs | Revenue |
|---|---|---|
| Paper / Packaging | 2 | $29B |
|
||
| Retail | 1 | $160B |
|
||
| Transportation / Logistics | 1 | $91B |
|
||
| Airlines | 1 | $62B |
|
||
| Consumer Goods | 1 | $47B |
|
||
| Utilities | 1 | $25B |
|
||
Price history
+2561.1% since first listed9 events — show timeline
- 2026-06-05 Price Changed $300,700 GAMLS
- 2026-05-22 Price Changed $305,400 GAMLS
- 2026-05-01 Listed $310,000 GAMLS
- 2022-04-22 Price Changed $1,795 RENT.
- 2021-10-05 Sold (Public Records) $1,029,613 Public Records
- 2021-08-03 Sold (Public Records) $490,000 Public Records
- 2010-01-26 Price Changed $132,900 GAMLS
- 1994-05-24 Sold (Public Records) $87,400 Public Records
- 1993-01-27 Sold (Public Records) $11,300 Public Records
Property tax history
+3.3%/yrLatest (2025): $3,129 · +0.0% YoY. Source: county tax records.
Cash-flow waterfall
monthlySold comps — $/sqft
last 12 mo · ≤1 miLoading sold comps…