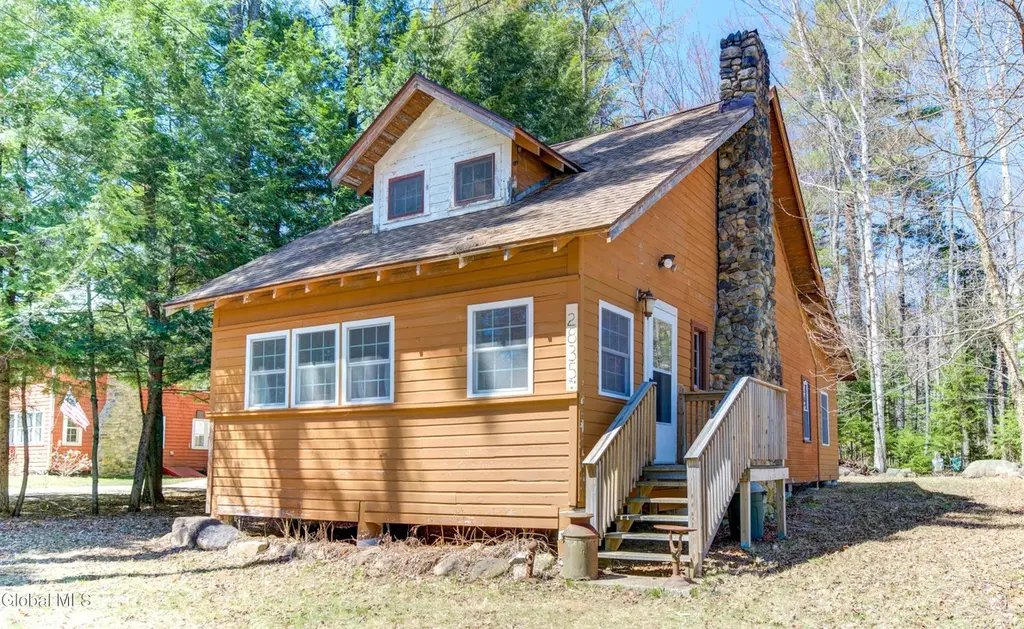
2835 State Route 8 · Speculator, NY
Flood risk 1/10 · Minimal
- FEMA flood zone
- —
- Chance of flooding over 30 yrs
- 0.0%
- Est. flood insurance / yr
- —
Fire risk 1/10 · Minimal
- Est. fire insurance / yr
- $691 – $1,283
Heat risk 1/10 · Minimal
- Hot days now (above 88°F)
- 7 days/yr
- Hot days in 30 yrs
- 16 days/yr
Wind risk 2/10 · Minimal
- Chance of severe wind over 30 yrs
- 1.0%
Air-quality risk 1/10 · Minimal
- Unhealthy air days now
- 0 days/yr
- Unhealthy air days in 30 yrs
- 0 days/yr
Risk factors via First Street. Map © Google.
Why this score? — see what drove the D grade
The composite is a weighted blend of 9 inputs, each scored 0–100. Each bar is that input's sub-score; the figure is the points it added to the 100-point composite (weight × sub-score).
- ARV discount +15.0/15.0
- Cash flow +7.1/30.0
- Appreciation +5.0/10.0
- Schools +4.1/10.0
- Livability +3.4/5.0
- Rent growth +2.5/5.0
- Condition / age +2.5/5.0
- DSCR +1.3/10.0
- 1% rule +1.0/10.0
$229,000
🖨 Deal sheet 📄 Offer letter ✓ Due diligence
Listing remarks
Act quickly to secure this charming 3 season Adirondack retreat with shared deeded access to Lake Pleasant, located just moments from the water in the heart of Speculator . This inviting property is the perfect landing pad for weekend getaways, and outdoor enthusiasts looking to enjoy lake life and mountain living. Inside, the home offers a warm and welcoming layout featuring a kitchen, a dining area, and a spacious living room centered around a majestic stone hearth. The spaces flow naturally together, creating a comfortable setting for gathering and relaxing. Enter through a charming mudroom with knotty pine walls, ideal for Adirondack living. The main floor also includes a bedroom and fu
Key facts
- Firepit
- Seasonal lake access
- Charming mudroom
Tags
Property features AI
Exterior
- Parking: Off-street parking for 5 vehicles
- Utilities: Public water; Public sewer
- Home design: Single family residence
- Construction: Wood siding
- Exterior features: Shingle/asphalt roof; Shed(s); Wooded lot with views; Deeded shared water access to Lake Pleasant; Waterfront on Lake Pleasant
Interior
- Kitchen: Range; Refrigerator
- Bedrooms: First-floor bedroom; Second-floor bedroom; Second-floor bedroom
- Flooring: Hardwood
- Bathrooms: Two full bathrooms — one on the first floor and one on the second floor
- Heating & cooling: Electric heating; Wood heating
- Interior features: Paddle fan; Two wood-burning fireplaces (one with insert) — fireplaces in family room and living room; Total of 9 rooms
Neighborhood map
What this means for you Summary
Snapshot
- This is a 3-bed/1.0-bath single-family listed at $229k.
Deal economics
- At list price, monthly cash flow is $-327 ($-4k/yr) — negative.
- To cash-flow at today's rent, offer at most $171k (25.2% below list).
- To meet the 1% rule (rent ≥ 1% of price), the offer needs to be $137k (40.0% below list).
- Recommended offer: $137k (40.0% below list) — sets the bar for 1% rule.
Location & tenants
- Location reads 68/100 on livability (#525 in NY) — a middle-class / working-renter tenant base. Strengths: employment A+, housing A+, cost of living B+; Watch: health & safety C-, crime D-, amenities F.
- Lake Pleasant Central School District (rural): math 40% / reading 50% proficiency, ranked #546 of 755 in NY (top 72%) — families likely to look elsewhere, expect single-tenant / working-renter base with shorter leases.
- Zoned schools: Lake Pleasant School (math 44% / reading 74%, grade B-, #745 of 2,108 statewide, top 39%, 73 students, 0% FRL) — zoned schools average 0% FRL vs 21% district-wide (21 pts lower); this property's tenant base skews higher-income than the district average.
- Zoned-school proficiency averages 60% at this address vs 45% district-wide (+14 pts) — the actual schools serving this property are materially stronger than the Lake Pleasant Central School District average implies; a family-tenant draw the district grade alone would hide.
- Market conditions: 2 active listings in the ZIP; 55 units permitted in Hamilton County in 2024 (0 in 5+ unit buildings).
Forward outlook
- In year one you build about $8k of equity ($2k loan paydown + $7k appreciation (3.0% local appreciation)).
- Hamilton County population projected at -26% by 2050 — secular population decline; favor cash flow + early exit over multi-decade hold.
- By year 5, paydown + projected appreciation supports a ~$37k cash-out refi (75% LTV) — recoverable capital for the next deal without selling this one.
Negotiation context
- It's been on market 16 days — a 2% lower offer ($226k) is reasonable based on typical stale-listing flexibility.
- Current owner paid $38k; list at $229k implies a 503% gain — meaningful room to come down on a strong offer.
Risks & watch-outs
- Watch-outs: built in 1928 — expect roof / HVAC / electrical / plumbing capex.
Questions for the listing agent
- What do current leases actually rent for vs. the listed asking? Can we see a recent rent roll and the last 12 months of T-12 income?
- Built in 1928 — when were the roof, HVAC, electrical panel, plumbing, and water heater last replaced?
- Is there a deadline driving the sale (1031 exchange, divorce, estate, relocation)? That informs how much negotiation room exists.
- Schools are D-rated, which usually means shorter tenancies and higher turnover. Who's the typical renter profile here, and what's been the actual vacancy rate?
- Crime grade is D in this area — have there been break-ins, vandalism, or insurance claims at this property in the last 3 years? What carrier currently insures it and at what premium?
- The area grade is low — what's the realistic commute time and amenity access for the typical tenant pool here? Any planned neighborhood developments (good or bad) we should know about?
- What's the average days-on-market for RENTAL listings here right now (not sales)? A rising rental-DOM trend means longer vacancies and softer asking-rent achievability than the comps imply.
- What's the recent tenant-quality profile in this submarket — average credit score on applications, eviction rate, late-payment / NSF rate, and stable-employment percentage? A property-management company in the area should have these aggregated.
- How much new for-sale + rental construction is in the pipeline within 1–3 miles? Heavy new supply typically softens prices + rents 12–24 months out; constrained supply supports both.
Investment metrics
- 1% rule
- 0.60% ✗
- Cap rate
- 4.58%
- Cash-on-cash
- -6.11%
- DSCR
- 0.73
- GRM
- 13.9
CMA / ARV
- ARV (median comp)
- $308,970
- List price
- $229,000
- Delta
- -25.88%
- Verdict
- UNDERPRICED
- Comps
- 8 within 1.0 mi
Show comp detail 2 sales within ~0.75 mi
| Address | Dist | Beds/Ba | Sqft | Sold | Price | $/sf | Match |
|---|---|---|---|---|---|---|---|
| 107 Charlie Brown Ln | 0.46mi | 2/1.0 (-1) | 1,100 (-9%) | 17mo | $260,000 | $236 | 44 |
| 123 Elm Lake Rd | 0.70mi | 4/2.0 (+1) | 1,349 (+11%) | 6mo | $262,500 | $195 | 34 |
Match score weights: distance 35% · size 25% · config 20% · recency 20%. Top-matched comps best support the ARV.
Projected returns pro-forma
3.0% appreciation · 3.0% rent growth · sell at horizon
- IRR
- 1.8%
- Equity multiple
- 1.10×
- Total profit
- $6,704
- Equity at exit
- $102,968
- IRR
- 5.4%
- Equity multiple
- 1.83×
- Total profit
- $52,934
- Equity at exit
- $158,686
Cash invested: $64,120 (down + closing). Projections, not guarantees.
Landlord ↔ Tenant lean methodology
- Overall (STATE)
- 15 Strongly Tenant-Friendly
- State New York
- 15 Strongly Tenant-Friendly · D+10
- County
- — inherits STATE
- City
- — inherits STATE
ZIP-level market 12164
- Active inventory
- 2
- Price-to-rent
- 13.9×
Monthly cashflow live
- Estimated rent
- $1,374 medium interval (Pro) →
- Mortgage (P&I)
- −$1,201
- Tax from tax record
- −$115 /mo · $1,384/yr
- Insurance
- −$95
- HOA
- −$0
- Vacancy / Maint / Mgmt
- −$288
- Net cashflow
- $-327
Break-even live
UW: 25.0% down · 7.5% · 30yr · 1.5% tax · 5.0% vac · 8.0% maint · 8.0% mgmt
Financing live
Cash to close
- Down payment
- $57,250
- Closing costs
- $6,870
- Reserves months
- —
- Total cash needed
- —
Loan-product check · same deal, 3 products live
Conventional
25% down · 7.5% · 30yr
- Down + closing
- —
- Monthly P&I
- —
- Monthly cashflow
- —
- DSCR
- —
- Eligible?
- —
Personal DTI + credit; lowest rate.
DSCR
20% down · 8.5% · 30yr
- Down + closing
- —
- Monthly P&I
- —
- Monthly cashflow
- —
- DSCR
- —
- Eligible?
- —
No personal income docs; deal must DSCR.
Hard money
10% down · 12.0% · 12mo
- Down + closing
- —
- Monthly P&I
- —
- Monthly cashflow
- —
- DSCR
- —
- Eligible?
- —
Short-term bridge; refi at stabilization.
Listing history 2 events
-
2026-05-04$229,000 Active 1512-char remark
-
2011-11-18soldstatus $38,000
ⓘ Source: listings_history table (triggers on properties + properties_extension) + one-shot
backfill from property_details.listing_events for pre-trigger history.
Tax reassessment forecast NY · Partial reset (capped growth)
- Current annual tax
- $1,384 · $115/mo
- Projected year-2 tax
- $2,627 · $219/mo
- Expected delta
- +$1,243/yr (+$104/mo · 89.8%)
ⓘ Screening estimate from a state-policy table — verify with the county assessor before closing.
Climate risk First Street
- Flood 1/10 Low 0% chance over 30 yrs
- Wildfire 1/10 Low
- Heat 1/10 Low 7 d/yr ≥88°F today · 16 d/yr by 30 yrs out
- Wind 2/10 Low 100% chance of damaging wind over 30 yrs
- Air quality 1/10 Low 0 unhealthy d/yr today · 0 by 30 yrs out
Nearby sold comps map
Loading sold comps map…
Walkable amenities ~0.75 mi
Loading nearby amenities…
Taxation est. · year 1
- Rental income
- $16,482
- − Mortgage interest
- −$12,828
- − Property taxes
- −$1,384
- − Insurance
- −$1,145
- − Repairs & maintenance
- −$1,319
- − Management
- −$1,319
- − Depreciation
- −$6,662
- Taxable loss
- −$8,173
- Est. tax savings @ 24.0%
- +$1,962
- After-tax cash flow
- $-1,957/yr
For passive investors: Depreciation is non-cash, so a rental often shows a tax loss while cash-flowing — sheltering income. Rental losses are passive: they offset passive income freely, and up to $25,000/yr can offset ordinary (W-2) income if you actively participate and your MAGI is under $100k (phasing out to $0 by $150k); unused losses carry forward. On sale, claimed depreciation is recaptured at up to 25%, and gains may owe capital-gains tax (a 1031 exchange can defer both). Figures are a year-1 estimate at your 24.0% rate — not tax advice; consult a CPA.
Schools (NCES district)
- District
- Lake Pleasant Central School District
- NCES district ID
- 3616530
- Math proficiency
- 40% ▬ 0.00%
- Reading proficiency
- 50% ▬ 0.00%
- Median HH income
- $54,885
- Composite
- 41.31/100
- National rank
- #7364
- State rank
- #546 of 755 in NY
Livability — Speculator
- Score
- 68/100
- State rank
- #525
- US rank
- #9282
Category grades
Schools grade is shown separately in the Schools card above.
Census & demographics
- Census place
- Speculator, NY
- Population (ZIP)
- 520
Population outlook (Hamilton County) Hauer SSP2
- Today (2025)
- 4,374 people
- By 2030
- 4,157 · -5.0%
- By 2040
- 3,641 · -16.8%
- By 2050
- 3,238 · -26.0%
- By 2075
- 2,644 · -39.6%
- By 2100
- 2,017 · -53.9%
Race, ethnicity, and origin ACS 2023
- Neighborhood character
- Predominantly White (97%)
- Race & ethnicity
- White 97% Hispanic / Latino 2% Two or more races 2% Asian 2%
- Common ancestry
- Lithuanian 8% Slovak 7% Romanian 7%
- Foreign-born
- 2% · South Korea
- Languages at home
- 97% English-only · Chinese 2% German/W. Germanic 1%
Political lean MEDSL · Hamilton
- 2024 margin
- Strong R (+29.5) · D 35.3% · R 64.7%
- 2008→2024 swing
- -2.6pp toward R · 2008: -26.9pp · 2024: -29.5pp
- All cycles
- 2024: R+29.5 2020: R+30.3 2016: R+38.8 2012: R+26.2 2008: R+26.9
Not yet ingested
- Civics
- —
Market trends
- HPI YoY
- —
- Current HPI
- —
- Rent YoY
- —
- Metro
- —
- State GDP YoY
- ▲ 2.60%
- F500 in state
- 92
Industry mix (Fortune 500 HQ in NY)
| Industry | F500 HQs | Revenue |
|---|---|---|
| Financial Services | 10 | $950B |
|
||
| Consumer Goods | 9 | $162B |
|
||
| Insurance | 4 | $225B |
|
||
| Telecommunications | 2 | $144B |
|
||
| Pharmaceuticals | 2 | $112B |
|
||
| Media / Entertainment | 2 | $69B |
|
||
Price history
+502.6% since first listed3 events — show timeline
- 2026-05-20 Pending — Global MLS
- 2026-05-04 Listed $229,000 Global MLS
- 2011-11-18 Sold (Public Records) $38,000 Public Records
Property tax history
+5.3%/yrLatest (2025): $1,384 · +2.4% YoY. Source: county tax records.
Cash-flow waterfall
monthlySold comps — $/sqft
last 12 mo · ≤1 miLoading sold comps…