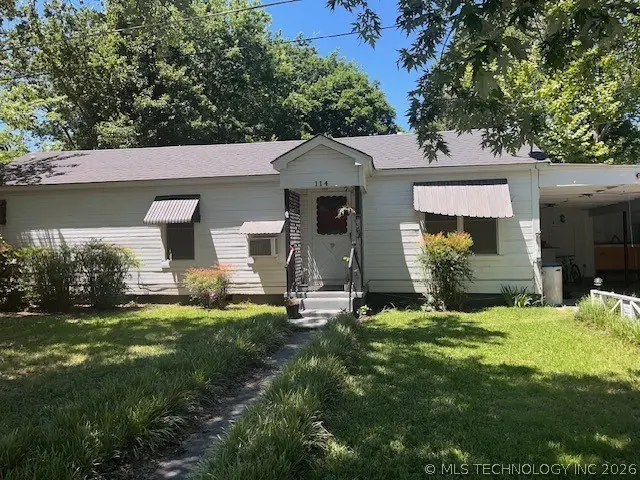
114 S 12 St · Madill, OK
Flood risk 1/10 · Minimal
- FEMA flood zone
- X
- Chance of flooding over 30 yrs
- 0.0%
- Est. flood insurance / yr
- $507 – $1,088
Fire risk 6/10 · Moderate
- Est. fire insurance / yr
- $2,463 – $4,575
Heat risk 6/10 · Moderate
- Hot days now (above 111°F)
- 7 days/yr
- Hot days in 30 yrs
- 20 days/yr
Wind risk 4/10 · Minor
- Chance of severe wind over 30 yrs
- 15.0%
Air-quality risk 3/10 · Minor
- Unhealthy air days now
- 2 days/yr
- Unhealthy air days in 30 yrs
- 3 days/yr
Risk factors via First Street. Map © Google.
Why this score? — see what drove the D grade
The composite is a weighted blend of 9 inputs, each scored 0–100. Each bar is that input's sub-score; the figure is the points it added to the 100-point composite (weight × sub-score).
- Cash flow +12.8/30.0
- ARV discount +7.5/15.0
- DSCR +3.8/10.0
- Appreciation +3.6/10.0
- 1% rule +3.3/10.0
- Livability +3.2/5.0
- Rent growth +2.5/5.0
- Condition / age +2.5/5.0
- Schools +1.8/10.0
$125,000
🖨 Deal sheet (PDF) 📄 Offer letter ✓ Due diligence
Listing remarks
COZY 2 BED, 1 BATH HOME IN FRIENDLY NEIGHBORHOOD IN MADILL CITY LIMITS. HOME HAS NICE LIVING ROOM, 2 CAR CARPORT WITH WORK AREA. HOME INCLUDES A COVERED BACK PATIO, STORAGE SHEDS, AND ONE LIVE IN STORAGE BUILDING. HOME INCLUDES CENTRAL HEAT, WINDOW UNITS AND IS SOLD FULLY FURNISHED NOT INCLUDING PERSONAL ITEMS.
Key facts
- Central heat
- Living room
- Covered back patio
Tags
Property features AI
Finance
- HOA & community: Sidewalks in the community
Exterior
- Parking: Attached garage (tandem) with workshop area; Carport
- Security: Smoke detector(s); No safety shelter
- Utilities: Electricity available; Natural gas available; Public water; Public sewer
- Home design: Single-story; Faces east; Entry on main level
- Construction: Built per public records; Wood siding and wood frame construction; Asphalt/fiberglass roof; Crawlspace foundation
- Exterior features: Covered porch, deck and patio; Satellite dish; Chain link fence; Shed/storage and workshop
Interior
- Kitchen: Microwave; Range; Oven; Refrigerator; Plumbed for ice maker
- Flooring: Carpet; Wood veneer
- Bathrooms: 1 full bathroom
- Heating & cooling: Gas heating; Heat pump; Window cooling unit(s)
- Interior features: Laminate counters; Ceiling fan(s); Electric oven and range connections; Storm windows with wood frames; Wood veneer and carpet flooring
- Laundry & utility: Washer; Dryer; Washer hookup; Electric dryer hookup; Electric water heater
Neighborhood map
What this means for you Summary
Snapshot
- This is a 2-bed/1.0-bath single-family listed at $125k.
Deal economics
- At list price, monthly cash flow is $-12 ($-139/yr) — negative.
- To cash-flow at today's rent, offer at most $123k (1.6% below list).
- To meet the 1% rule (rent ≥ 1% of price), the offer needs to be $103k (17.4% below list).
- Recommended offer: $103k (17.4% below list) — sets the bar for 1% rule.
- Cap rate 6.2% vs local median 3.0% in Madill — top-decile yield for the area; either an underpriced asset or a hidden risk that comps aren't pricing in. Stress-test before assuming the spread holds.
Location & tenants
- Location reads 63/100 on livability (#232 in OK) — a middle-class / working-renter tenant base. Strengths: crime A+, cost of living A+, housing A; Watch: employment D, amenities F, commute F.
- Madill (town): math 20% / reading 22% proficiency, ranked #162 of 270 in OK (top 60%) — low school quality limits family demand, transient renter base, plan for 1-2y turnover; 61% free/reduced lunch — lower-income household profile, screen leases tightly.
- Zoned schools: Madill Es (math 28% / reading 24%, grade F, #342 of 845 statewide, top 41%, 841 students, 0% FRL); Madill Ms (math 14% / reading 20%, grade F, #193 of 345 statewide, top 60%, 373 students, 0% FRL); Madill Hs (math 12% / reading 22%, grade F, #314 of 447 statewide, top 72%, 546 students, 0% FRL) — zoned schools average 0% FRL vs 61% district-wide (61 pts lower); this property's tenant base skews higher-income than the district average.
- Market conditions: 105 active listings in the ZIP; 2 comparable units currently listed for rent nearby; 42 units permitted in Marshall County in 2024 (0 in 5+ unit buildings).
Forward outlook
- Local home prices are declining (-2.8%/yr); year-one equity from $864 of loan paydown is wiped out by about $3k of value loss. Plan a longer hold.
- Marshall County population projected at +22% by 2050 — long-run rental-demand tailwind backs the buy-and-hold thesis.
Negotiation context
- It's been on market 42 days — a 3% lower offer ($121k) is reasonable based on typical stale-listing flexibility.
Risks & watch-outs
- Watch-outs: built in 1950 — expect roof / HVAC / electrical / plumbing capex.
- Climate carrying-cost: major wildfire risk; extreme-heat days projected 7→20/yr by 2055 (HVAC capex compounding) — expect insurance premiums to compound above CPI over the hold.
Questions for the listing agent
- What do current leases actually rent for vs. the listed asking? Can we see a recent rent roll and the last 12 months of T-12 income?
- It's been on market 42 days. Have you received any prior offers? Is the seller open to a 17% concession, seller financing, or rate buy-down credit?
- Built in 1950 — when were the roof, HVAC, electrical panel, plumbing, and water heater last replaced?
- Is there a deadline driving the sale (1031 exchange, divorce, estate, relocation)? That informs how much negotiation room exists.
- Schools are F-rated, which usually means shorter tenancies and higher turnover. Who's the typical renter profile here, and what's been the actual vacancy rate?
- The area grade is low — what's the realistic commute time and amenity access for the typical tenant pool here? Any planned neighborhood developments (good or bad) we should know about?
- What's the average days-on-market for RENTAL listings here right now (not sales)? A rising rental-DOM trend means longer vacancies and softer asking-rent achievability than the comps imply.
- What's the recent tenant-quality profile in this submarket — average credit score on applications, eviction rate, late-payment / NSF rate, and stable-employment percentage? A property-management company in the area should have these aggregated.
- How much new for-sale + rental construction is in the pipeline within 1–3 miles? Heavy new supply typically softens prices + rents 12–24 months out; constrained supply supports both.
Investment metrics
- 1% rule
- 0.83% ✗
- Cap rate
- 6.18%
- Cash-on-cash
- -0.40%
- DSCR
- 0.98
- GRM
- 10.1
CMA / ARV
- ARV (on-the-fly)
- $78,000
- Comps found
- 6
Show comp detail 6 sales within ~0.75 mi
| Address | Dist | Beds/Ba | Sqft | Sold | Price | $/sf | Match |
|---|---|---|---|---|---|---|---|
| 611 N 7th Ave | 0.58mi | 2/1.0 | 966 (-3%) | 3mo | $75,000 | $78 | 65 |
| 207 N Sunset | 0.16mi | 3/1.0 (+1) | 1,029 (+3%) | 24mo | $76,000 | $74 | 63 |
| 508 W Lillie Blvd | 0.46mi | 2/1.0 | 1,040 (+4%) | 18mo | $95,000 | $91 | 57 |
| 908 W Taliaferro | 0.17mi | 3/1.0 (+1) | 1,102 (+10%) | 20mo | $40,000 | $36 | 54 |
| 515 S 4th | 0.67mi | 2/1.0 | 1,066 (+7%) | 14mo | $80,000 | $75 | 46 |
| 18819 Elizabeth Blvd | 0.62mi | 3/1.5 (+1) | 1,108 (+11%) | 23mo | $130,000 | $117 | 27 |
Match score weights: distance 35% · size 25% · config 20% · recency 20%. Top-matched comps best support the ARV.
Projected returns pro-forma
-2.76% appreciation · 3.0% rent growth · sell at horizon
- IRR
- -15.5%
- Equity multiple
- 0.44×
- Total profit
- $-19,751
- Equity at exit
- $19,966
- IRR
- -7.4%
- Equity multiple
- 0.51×
- Total profit
- $-17,106
- Equity at exit
- $13,102
Cash invested: $35,000 (down + closing). Projections, not guarantees.
Landlord ↔ Tenant lean methodology
- Overall (STATE)
- 83 Strongly Landlord-Friendly
- State Oklahoma
- 83 Strongly Landlord-Friendly · R+20
- County
- — inherits STATE
- City
- — inherits STATE
ZIP-level market 73446
- Home prices YoY
- -1.4%
- Active inventory
- 105
- Price-to-rent
- 10.1×
Monthly cashflow live
- Estimated rent
- $1,032 medium interval (Pro) →
- Mortgage (P&I)
- −$656
- Tax from tax record
- −$120 /mo · $1,434/yr
- Insurance
- −$52
- HOA
- −$0
- Vacancy / Maint / Mgmt
- −$217
- Net cashflow
- $-12
Break-even live
Sensitivity live
| Price | -10% $59 | -5% $24 | +0% $-12 | +5% $-47 | +10% $-82 |
|---|---|---|---|---|---|
| Rent | -10% $-93 | -5% $-52 | +0% $-12 | +5% $29 | +10% $70 |
| Rate | -1.0pp $51 | -0.5pp $20 | base $-12 | +0.5pp $-44 | +1.0pp $-77 |
UW: 25.0% down · 7.5% · 30yr · 1.5% tax · 5.0% vac · 8.0% maint · 8.0% mgmt
Financing live
Cash to close
- Down payment
- $31,250
- Closing costs
- $3,750
- Reserves months
- —
- Total cash needed
- —
Loan-product check · same deal, 3 products live
Conventional
25% down · 7.5% · 30yr
- Down + closing
- —
- Monthly P&I
- —
- Monthly cashflow
- —
- DSCR
- —
- Eligible?
- —
Personal DTI + credit; lowest rate.
DSCR
20% down · 8.5% · 30yr
- Down + closing
- —
- Monthly P&I
- —
- Monthly cashflow
- —
- DSCR
- —
- Eligible?
- —
No personal income docs; deal must DSCR.
Hard money
10% down · 12.0% · 12mo
- Down + closing
- —
- Monthly P&I
- —
- Monthly cashflow
- —
- DSCR
- —
- Eligible?
- —
Short-term bridge; refi at stabilization.
Rent comps 2 comps
| Address | Beds | Baths | Sqft | Rent | $/sqft | DOM | Units | Dist |
|---|---|---|---|---|---|---|---|---|
| 703 S 8th Ave Apt 1A Madill, OK | 2.0 | 1.0 | 900 | $875 | $0.97 | 22d | 1 | 0.52mi |
| 512 Sweet Pea Ln Madill, OK | 3.0 | 2.0 | 1308 | $1,500 | $1.15 | 22d | 1 | 1.32mi |
Listing history 19 events
-
2026-06-21days on market $125,000 Active 42 DOM
-
2026-06-19days on market $125,000 Active 40 DOM
-
2026-06-18days on market $125,000 Active 39 DOM
-
2026-06-17days on market $125,000 Active 38 DOM
-
2026-06-16days on market $125,000 Active 37 DOM
-
2026-06-15days on market $125,000 Active 36 DOM
-
2026-06-14days on market $125,000 Active 34 DOM
-
2026-06-12days on market $125,000 Active 33 DOM
-
2026-06-09days on market $125,000 Active 30 DOM
-
2026-06-08days on market $125,000 Active 29 DOM
-
2026-06-07days on market $125,000 Active 28 DOM
-
2026-06-05days on market $125,000 Active 25 DOM
-
2026-06-02days on market $125,000 Active 23 DOM
-
2026-06-01days on market $125,000 Active 22 DOM
-
2026-05-31days on market $125,000 Active 21 DOM
-
2026-05-30days on market $125,000 Active 20 DOM
-
2026-05-10$125,000 Active
-
2024-07-19soldstatus $139,000
-
1994-08-08soldstatus $8,500
ⓘ Source: listings_history table (triggers on properties + properties_extension) + one-shot
backfill from property_details.listing_events for pre-trigger history.
Tax reassessment forecast OK · Resets to sale price
- Current annual tax
- $1,434 · $120/mo
- Projected year-2 tax
- $1,434 · $120/mo
- Expected delta
- $0/yr ($0/mo · 0.0%)
ⓘ Screening estimate from a state-policy table — verify with the county assessor before closing.
Climate risk First Street
- Flood 1/10 Low FEMA zone X · 0% chance over 30 yrs
- Wildfire 6/10 Major
- Heat 6/10 Major 7 d/yr ≥111°F today · 20 d/yr by 30 yrs out
- Wind 4/10 Moderate 15% chance of damaging wind over 30 yrs
- Air quality 3/10 Moderate 2 unhealthy d/yr today · 3 by 30 yrs out
Nearby sold comps map
Loading sold comps map…
Walkable amenities ~0.75 mi
Loading nearby amenities…
Taxation est. · year 1
- Rental income
- $12,388
- − Mortgage interest
- −$7,002
- − Property taxes
- −$1,434
- − Insurance
- −$625
- − Repairs & maintenance
- −$991
- − Management
- −$991
- − Depreciation
- −$3,636
- Taxable loss
- −$2,292
- Est. tax savings @ 24.0%
- +$550
- After-tax cash flow
- $411/yr
For passive investors: Depreciation is non-cash, so a rental often shows a tax loss while cash-flowing — sheltering income. Rental losses are passive: they offset passive income freely, and up to $25,000/yr can offset ordinary (W-2) income if you actively participate and your MAGI is under $100k (phasing out to $0 by $150k); unused losses carry forward. On sale, claimed depreciation is recaptured at up to 25%, and gains may owe capital-gains tax (a 1031 exchange can defer both). Figures are a year-1 estimate at your 24.0% rate — not tax advice; consult a CPA.
Schools (NCES district)
- District
- Madill
- NCES district ID
- 4018700
- Math proficiency
- 20% ▼ -17.00%
- Reading proficiency
- 22% ▼ -13.00%
- Median HH income
- $40,372
- Composite
- 17.82/100
- National rank
- #9008
- State rank
- #162 of 270 in OK
Livability — Madill
- Score
- 63/100
- State rank
- #232
- US rank
- #15955
Category grades
Schools grade is shown separately in the Schools card above.
Census & demographics
- Census place
- Madill, OK
- City population
- 8,414
- Population (ZIP)
- 8,414
Population outlook (Marshall County) Hauer SSP2
- Today (2025)
- 17,405 people
- By 2030
- 18,038 · +3.6%
- By 2040
- 19,513 · +12.1%
- By 2050
- 21,283 · +22.3%
- By 2075
- 27,884 · +60.2%
- By 2100
- 35,435 · +103.6%
Race, ethnicity, and origin ACS 2023
- Neighborhood character
- Diverse neighborhood (Simpson 0.63)
- Race & ethnicity
- White 54% Hispanic / Latino 28% Two or more races 15% Native American 8%
- Hispanic origin (detail)
- Mexican 27%
- Common ancestry
- Iranian 1% Serbian 1% Lithuanian 1%
- Foreign-born
- 11% · Canada
- Languages at home
- 76% English-only · Spanish 22% German/W. Germanic 1%
Political lean MEDSL · Marshall
- 2024 margin
- Solid R (+63.4) · D 17.7% · R 81.2% · Other 1.1%
- 2008→2024 swing
- -24.6pp toward R · 2008: -38.8pp · 2024: -63.4pp
- All cycles
- 2024: R+63.4 2020: R+62.5 2016: R+56.6 2012: R+45.7 2008: R+38.8
Not yet ingested
- Civics
- —
Market trends
- HPI YoY
- ▼ -2.76%
- Current HPI
- 188.3049
- Rent YoY
- —
- Metro
- —
- State GDP YoY
- ▲ 1.55%
- F500 in state
- 6
Industry mix (Fortune 500 HQ in OK)
| Industry | F500 HQs | Revenue |
|---|---|---|
| Energy | 3 | $48B |
|
||
Price history
+1370.6% since first listed3 events — show timeline
- 2026-05-10 Listed $125,000 MLS Technology, Inc.
- 2024-07-19 Sold (Public Records) $139,000 Public Records
- 1994-08-08 Sold (Public Records) $8,500 Public Records
Property tax history
+25.9%/yrLatest (2025): $1,434 · +373.3% YoY. Source: county tax records.
Cash-flow waterfall
monthlySold comps — $/sqft
last 12 mo · ≤1 miLoading sold comps…