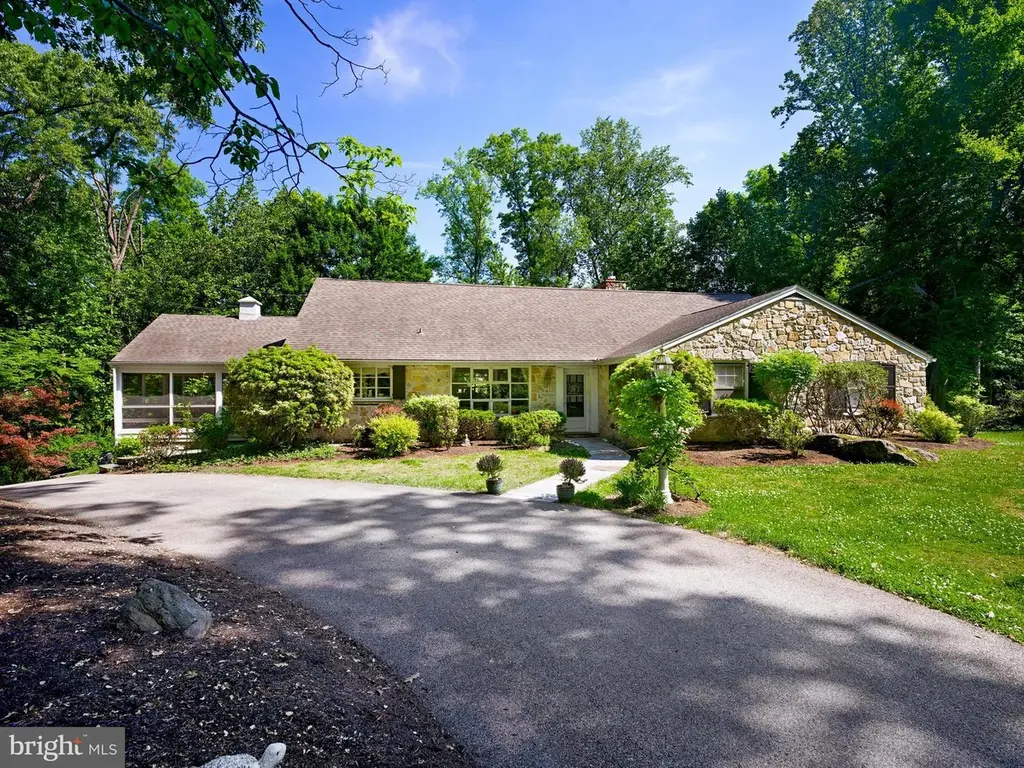
1626 Mount Pleasant Rd · West Conshohocken, PA
Flood risk 1/10 · Minimal
- FEMA flood zone
- X (unshaded)
- Chance of flooding over 30 yrs
- 0.0%
- Est. flood insurance / yr
- $473 – $860
Fire risk 1/10 · Minimal
- Est. fire insurance / yr
- $511 – $949
Heat risk 5/10 · Moderate
- Hot days now (above 101°F)
- 6 days/yr
- Hot days in 30 yrs
- 13 days/yr
Wind risk 6/10 · Moderate
- Chance of severe wind over 30 yrs
- 27.0%
Air-quality risk 4/10 · Minor
- Unhealthy air days now
- 5 days/yr
- Unhealthy air days in 30 yrs
- 8 days/yr
Risk factors via First Street. Map © Google.
Why this score? — see what drove the F grade
The composite is a weighted blend of 9 inputs, each scored 0–100. Each bar is that input's sub-score; the figure is the points it added to the 100-point composite (weight × sub-score).
- ARV discount +7.5/15.0
- Schools +7.3/10.0
- Livability +4.0/5.0
- Rent growth +2.5/5.0
- Condition / age +2.5/5.0
- Cash flow +0.6/30.0
- 1% rule +0.0/10.0
- DSCR +0.0/10.0
- Appreciation +0.0/10.0
$1,195,000
🖨 Deal sheet (PDF) 📄 Offer letter ✓ Due diligence
Listing remarks
A stone Cape Cod on just over an acre in Villanova. The house sits well back from Mount Pleasant Road, with two curb cuts and a connecting drive. Built in 1956, five bedrooms and three and a half baths across approximately 4,453 finished square feet. The floor plan places the primary suite, two additional bedrooms, and the principal living spaces on a single level. The living room runs the depth of the house, with a wall of windows facing into the tree canopy and across the valley beyond. A wood-burning fireplace anchors the room. The renovated kitchen has 42-inch cherry cabinetry, granite counters and backsplash, a wall oven, cooktop, stainless appliances, and a sunny breakfast area with g
Key facts
- Acre in villanova
- Two curb cuts
- Primary suite
Tags
Property features AI
Finance
- Other: Not in a federal flood zone; Finished below-grade living area with outside entrance and walkout level; lower level is fully finished, heated, has windows and garage access; Ground rent paid annually
Exterior
- Parking: Attached garage with inside access and side entry; Garage door opener; Two garage spaces (total two parking spaces); Private paved/asphalt driveway
- Security: Garage provides interior access
- Utilities: Public water; On-site septic; 200+ amp electric service with circuit breakers; Natural gas for heating and hot water; Cable TV available; Municipal trash service
- Home design: Detached property; Pitched shingle roof; Bay/Bow windows; Level entry to main floor; Fee simple ownership
- Construction: Stone and masonry construction; Stone foundation; Above-grade and below-grade finished areas
- Exterior features: Exterior lighting; Extensive hardscape; Patio(s) and porch(es); Wood fencing; Sloping, irregular lot with trees and landscaping; Front and rear yard, side yards, partly wooded and secluded areas; Backs to trees
Interior
- Kitchen: Cooktop; Wall oven; Self-cleaning oven; Dishwasher; Refrigerator; Garbage disposal; Microwave; Gourmet kitchen; Stainless steel appliances; Energy-efficient appliances; Upgraded countertops
- Bedrooms: Three bedrooms on the main level; Two bedrooms on the first upper level
- Flooring: Hardwood/wood floors; Ceramic tile; Fully carpeted areas; Tile/brick
- Bathrooms: Three full bathrooms (two on main level, one on upper level)
- Heating & cooling: Forced air heating with natural gas; Energy Star heating system; Programmable thermostat; Central air conditioning (Energy Star cooling system)
- Interior features: Master bathroom(s); Stall shower and tub/shower; Attic; Built-in shelving; Crown molding; Wainscoting; Recessed lighting; Dining area and formal separate dining room; Family room off the kitchen; Traditional floor plan; Upgraded countertops; Window treatments
- Laundry & utility: Washer and dryer included; Laundry on main floor and lower floor; Air filter system
Neighborhood map
What this means for you Summary
Snapshot
- This is a 3-bed/3.5-bath single-family listed at $1.20M.
Deal economics
- At list price, monthly cash flow is $-5k ($-62k/yr) — negative.
- To cash-flow at today's rent, offer at most $449k (62.4% below list).
- To meet the 1% rule (rent ≥ 1% of price), the offer needs to be $439k (63.2% below list).
- Recommended offer: $439k (63.2% below list) — sets the bar for 1% rule.
- Cap rate 1.1% vs local median 2.0% in West Conshohocken — below-typical yield; the buyer is paying a premium for something (appreciation thesis, condition, location) that the cap rate doesn't capture.
Location & tenants
- Location reads 79/100 on livability (#261 in PA, #2,261 nationally) — a middle-class / working-renter tenant base. Strengths: crime A+, employment A+, housing A+; Watch: amenities F, cost of living F.
- Lower Merion SD (suburban): math 74% / reading 84% proficiency, ranked #3 of 539 in PA (top 1%) — strong family-tenant draw, lease renewals of 3-5y typical; only 7% free/reduced lunch — higher-income household profile.
- Zoned schools: Gladwyne Sch (math 80% / reading 89%, grade A+, #14 of 1,518 statewide, top 2%, 540 students, 9% FRL); Black Rock Ms (1,032 students, 13% FRL); Harriton Shs (math 85%, 1,261 students, 14% FRL).
- Market conditions: 36 active listings in the ZIP; 1,936 units permitted in Montgomery County in 2024 (530 in 5+ unit buildings).
Forward outlook
- Local home prices are declining (-3.0%/yr); year-one equity from $8k of loan paydown is wiped out by about $36k of value loss. Plan a longer hold.
- Montgomery County population projected at +5% by 2050 — modest demand growth; plan on rents tracking national, not racing it.
Negotiation context
- Only 12 days on market — expect competitive offers; lowballing is unlikely to land.
- 8 sale attempts since 9y ago with the ask held roughly flat each time — persistent listings suggest the price (not the market) is what's stuck; bring a comps-based counter.
Risks & watch-outs
- Watch-outs: built in 1956 — expect roof / HVAC / electrical / plumbing capex.
- Climate carrying-cost: major wind risk, 27% chance of damaging wind over 30y; extreme-heat days projected 6→13/yr by 2055 (HVAC capex compounding) — expect insurance premiums to compound above CPI over the hold.
Questions for the listing agent
- What do current leases actually rent for vs. the listed asking? Can we see a recent rent roll and the last 12 months of T-12 income?
- Built in 1956 — when were the roof, HVAC, electrical panel, plumbing, and water heater last replaced?
- Is there a deadline driving the sale (1031 exchange, divorce, estate, relocation)? That informs how much negotiation room exists.
- The area grade is low — what's the realistic commute time and amenity access for the typical tenant pool here? Any planned neighborhood developments (good or bad) we should know about?
- What's the average days-on-market for RENTAL listings here right now (not sales)? A rising rental-DOM trend means longer vacancies and softer asking-rent achievability than the comps imply.
- What's the recent tenant-quality profile in this submarket — average credit score on applications, eviction rate, late-payment / NSF rate, and stable-employment percentage? A property-management company in the area should have these aggregated.
- How much new for-sale + rental construction is in the pipeline within 1–3 miles? Heavy new supply typically softens prices + rents 12–24 months out; constrained supply supports both.
Investment metrics
- 1% rule
- 0.37% ✗
- Cap rate
- 1.11%
- Cash-on-cash
- -18.52%
- DSCR
- 0.18
- GRM
- 22.7
CMA / ARV
- ARV (on-the-fly)
- $3,500,058
- Comps found
- 2
Show comp detail 2 sales within ~0.75 mi
| Address | Dist | Beds/Ba | Sqft | Sold | Price | $/sf | Match |
|---|---|---|---|---|---|---|---|
| 1109 Brynlawn Rd | 0.37mi | 4/4.5 (+1) | 4,295 (-4%) | 1mo | $3,375,200 | $786 | 67 |
| 1123 Riverview Ln | 0.67mi | 3/3.5 | 3,867 (-13%) | 11mo | $900,000 | $233 | 38 |
Match score weights: distance 35% · size 25% · config 20% · recency 20%. Top-matched comps best support the ARV.
Projected returns pro-forma
-3.0% appreciation · 3.0% rent growth · sell at horizon
- IRR
- -53.7%
- Equity multiple
- -0.56×
- Total profit
- $-522,210
- Equity at exit
- $178,178
- IRR
- —
- Equity multiple
- -1.62×
- Total profit
- $-876,989
- Equity at exit
- $103,322
Cash invested: $334,600 (down + closing). Projections, not guarantees.
Landlord ↔ Tenant lean methodology
- Overall (STATE)
- 62 Landlord-Friendly
- State Pennsylvania
- 62 Landlord-Friendly · EVEN
- County
- — inherits STATE
- City
- — inherits STATE
ZIP-level market 19085
- Active inventory
- 36
- Price-to-rent
- 22.7×
Monthly cashflow live
- Estimated rent
- $4,395 medium interval (Pro) →
- Mortgage (P&I)
- −$6,267
- Tax from tax record
- −$1,871 /mo · $22,451/yr
- Insurance
- −$498
- HOA
- −$0
- Vacancy / Maint / Mgmt
- −$923
- Net cashflow
- $-5,164
Break-even live
Sensitivity live
| Price | -10% $-4,487 | -5% $-4,825 | +0% $-5,164 | +5% $-5,502 | +10% $-5,840 |
|---|---|---|---|---|---|
| Rent | -10% $-5,511 | -5% $-5,337 | +0% $-5,164 | +5% $-4,990 | +10% $-4,816 |
| Rate | -1.0pp $-4,562 | -0.5pp $-4,860 | base $-5,164 | +0.5pp $-5,473 | +1.0pp $-5,788 |
UW: 25.0% down · 7.5% · 30yr · 1.5% tax · 5.0% vac · 8.0% maint · 8.0% mgmt
Financing live
Cash to close
- Down payment
- $298,750
- Closing costs
- $35,850
- Reserves months
- —
- Total cash needed
- —
Loan-product check · same deal, 3 products live
Conventional
25% down · 7.5% · 30yr
- Down + closing
- —
- Monthly P&I
- —
- Monthly cashflow
- —
- DSCR
- —
- Eligible?
- —
Personal DTI + credit; lowest rate.
DSCR
20% down · 8.5% · 30yr
- Down + closing
- —
- Monthly P&I
- —
- Monthly cashflow
- —
- DSCR
- —
- Eligible?
- —
No personal income docs; deal must DSCR.
Hard money
10% down · 12.0% · 12mo
- Down + closing
- —
- Monthly P&I
- —
- Monthly cashflow
- —
- DSCR
- —
- Eligible?
- —
Short-term bridge; refi at stabilization.
Listing history 9 events
-
2026-06-21days on market $1,195,000 Active 12 DOM
-
2026-06-18days on market $1,195,000 Active 9 DOM
-
2026-06-17days on market $1,195,000 Active 8 DOM
-
2026-06-16days on market $1,195,000 Active 7 DOM
-
2026-06-15days on market $1,195,000 Active 6 DOM
-
2026-06-13days on market $1,195,000 Active 4 DOM
-
2026-06-13days on market $1,195,000 Active 3 DOM
-
2026-06-10remarks 699-char remark
-
2026-06-10$1,195,000 Active 1 DOM
ⓘ Source: listings_history table (triggers on properties + properties_extension) + one-shot
backfill from property_details.listing_events for pre-trigger history.
Tax reassessment forecast PA · Partial reset (capped growth)
- Current annual tax
- $22,451 · $1,871/mo
- Projected year-2 tax
- $22,451 · $1,871/mo
- Expected delta
- $0/yr ($0/mo · 0.0%)
ⓘ Screening estimate from a state-policy table — verify with the county assessor before closing.
Climate risk First Street
- Flood 1/10 Low FEMA zone X (unshaded) · 0% chance over 30 yrs
- Wildfire 1/10 Low
- Heat 5/10 Major 6 d/yr ≥101°F today · 13 d/yr by 30 yrs out
- Wind 6/10 Major 27% chance of damaging wind over 30 yrs
- Air quality 4/10 Moderate 5 unhealthy d/yr today · 8 by 30 yrs out
Nearby sold comps map
Loading sold comps map…
Walkable amenities ~0.75 mi
Loading nearby amenities…
Taxation est. · year 1
- Rental income
- $52,739
- − Mortgage interest
- −$66,939
- − Property taxes
- −$22,451
- − Insurance
- −$5,975
- − Repairs & maintenance
- −$4,219
- − Management
- −$4,219
- − Depreciation
- −$34,764
- Taxable loss
- −$85,827
- Est. tax savings @ 24.0%
- +$20,598
- After-tax cash flow
- $-41,364/yr
For passive investors: Depreciation is non-cash, so a rental often shows a tax loss while cash-flowing — sheltering income. Rental losses are passive: they offset passive income freely, and up to $25,000/yr can offset ordinary (W-2) income if you actively participate and your MAGI is under $100k (phasing out to $0 by $150k); unused losses carry forward. On sale, claimed depreciation is recaptured at up to 25%, and gains may owe capital-gains tax (a 1031 exchange can defer both). Figures are a year-1 estimate at your 24.0% rate — not tax advice; consult a CPA.
Schools (NCES district)
- District
- Lower Merion SD
- NCES district ID
- 4214160
- Math proficiency
- 74% ▼ -5.00%
- Reading proficiency
- 84% ▼ -4.00%
- Median HH income
- $113,035
- Composite
- 72.82/100
- National rank
- #194
- State rank
- #3 of 539 in PA
Livability — West Conshohocken
- Score
- 79/100
- State rank
- #261
- US rank
- #2261
Category grades
Schools grade is shown separately in the Schools card above.
Census & demographics
- Population (ZIP)
- 10,679
Population outlook (Montgomery County) Hauer SSP2
- Today (2025)
- 856,074 people
- By 2030
- 870,887 · +1.7%
- By 2040
- 891,195 · +4.1%
- By 2050
- 896,417 · +4.7%
- By 2075
- 903,212 · +5.5%
- By 2100
- 843,240 · -1.5%
Race, ethnicity, and origin ACS 2023
- Neighborhood character
- Predominantly White (76%)
- Race & ethnicity
- White 76% Asian 8% Two or more races 6% Hispanic / Latino 5% Black 5%
- Hispanic origin (detail)
- Common ancestry
- Romanian 6% Scotch-Irish 3% Slovak 2%
- Foreign-born
- 9% · Canada, Vietnam, South Korea
- Languages at home
- 84% English-only · Spanish 4% Other Indo-European 3% Vietnamese 2%
Political lean MEDSL · Montgomery
- 2024 margin
- Strong D (+22.8) · D 60.9% · R 38.1% · Other 1.1%
- 2008→2024 swing
- +2.0pp toward D · 2008: 20.8pp · 2024: 22.8pp
- All cycles
- 2024: D+22.8 2020: D+26.3 2016: D+21.1 2012: D+14.3 2008: D+20.8
Not yet ingested
- Civics
- —
Market trends
- HPI YoY
- ▼ -355.53%
- Current HPI
- 286.5602
- Rent YoY
- —
- Metro
- —
- State GDP YoY
- ▲ 1.68%
- F500 in state
- 34
Industry mix (Fortune 500 HQ in PA)
| Industry | F500 HQs | Revenue |
|---|---|---|
| Healthcare | 2 | $309B |
|
||
| Insurance | 2 | $27B |
|
||
| Telecommunications / Media | 1 | $124B |
|
||
| Industrial Distribution | 1 | $22B |
|
||
| Financial Services | 1 | $20B |
|
||
| Chemicals / Materials | 1 | $18B |
|
||
Price history
-14.6% since first listed22 events — show timeline
- 2026-06-09 Listed $1,195,000 BRIGHT MLS
- 2026-04-22 Listing Removed — BRIGHT MLS
- 2026-03-06 Listed $1,350,000 BRIGHT MLS
- 2026-03-03 Coming Soon — BRIGHT MLS
- 2025-12-16 Listing Removed — BRIGHT MLS
- 2025-11-01 Listed $1,385,000 BRIGHT MLS
- 2025-10-26 Listing Removed — BRIGHT MLS
- 2025-09-24 Price Changed $1,399,000 BRIGHT MLS
- 2025-08-13 Price Changed $1,499,900 BRIGHT MLS
- 2025-08-11 Price Changed $1,525,000 BRIGHT MLS
- 2025-05-09 Listed $1,599,000 BRIGHT MLS
- 2025-05-05 Coming Soon — BRIGHT MLS
- 2020-03-21 Relisted — BRIGHT MLS
- 2020-03-21 Listing Removed — BRIGHT MLS
- 2020-03-20 Listing Removed — BRIGHT MLS
- 2019-06-27 Price Changed $995,000 BRIGHT MLS
- 2019-03-21 Listed $1,030,000 BRIGHT MLS
- 2019-01-03 Listing Removed — BRIGHT MLS
- 2018-08-31 Price Changed $1,100,000 BRIGHT MLS
- 2018-04-18 Listed $1,200,000 BRIGHT MLS
- 2017-08-31 Listing Removed — BRIGHT MLS
- 2017-02-16 Listed $1,400,000 BRIGHT MLS
Property tax history
+3.0%/yrLatest (2026): $22,451 · +4.6% YoY. Source: county tax records.
Cash-flow waterfall
monthlySold comps — $/sqft
last 12 mo · ≤1 miLoading sold comps…