203 N Washington Ave · Centereach, NY
Flood risk 1/10 · Minimal
- FEMA flood zone
- X (unshaded)
- Chance of flooding over 30 yrs
- 0.0%
- Est. flood insurance / yr
- $473 – $860
Fire risk 1/10 · Minimal
- Est. fire insurance / yr
- $691 – $1,283
Heat risk 5/10 · Moderate
- Hot days now (above 94°F)
- 7 days/yr
- Hot days in 30 yrs
- 17 days/yr
Wind risk 7/10 · Major
- Chance of severe wind over 30 yrs
- 78.0%
Air-quality risk 4/10 · Minor
- Unhealthy air days now
- 4 days/yr
- Unhealthy air days in 30 yrs
- 5 days/yr
Risk factors via First Street. Map © Google.
Why this score? — see what drove the B grade
The composite is a weighted blend of 9 inputs, each scored 0–100. Each bar is that input's sub-score; the figure is the points it added to the 100-point composite (weight × sub-score).
- Cash flow +25.6/30.0
- ARV discount +15.0/15.0
- DSCR +8.5/10.0
- 1% rule +7.2/10.0
- Schools +5.3/10.0
- Livability +3.6/5.0
- Rent growth +2.5/5.0
- Condition / age +2.5/5.0
- Appreciation +0.0/10.0
$399,900
🖨 Deal sheet (PDF) 📄 Offer letter ✓ Due diligence
Listing remarks
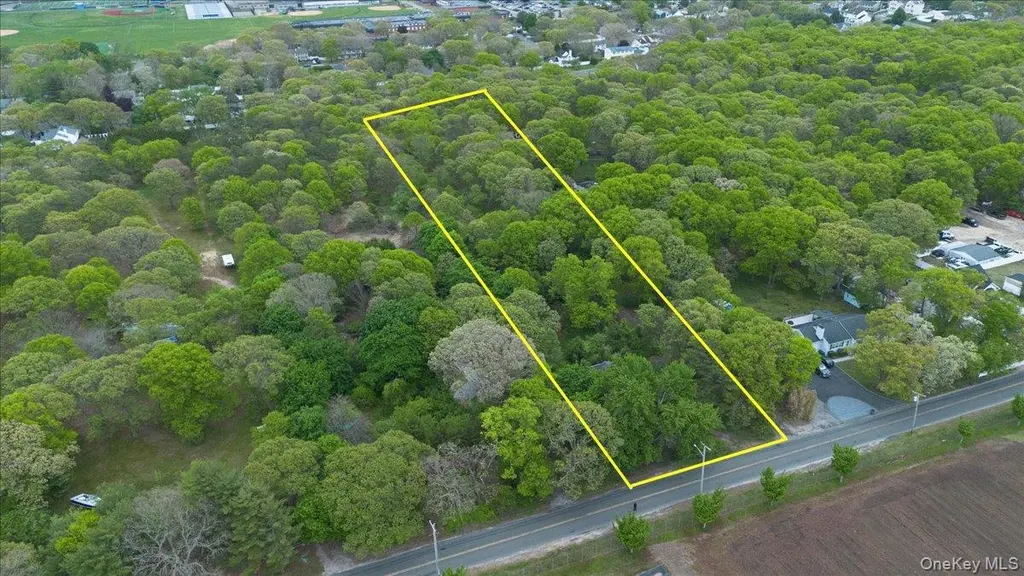
Calling all investors, builders, and visionaries — opportunities like this don't come around often. Two expansive lots, each approximately 2.5 acres, are available together for a combined footprint of roughly 5 acres. The condemned structure on site has already done the thinking for you — bring your plans and build something extraordinary. Financing limited to cash, hard money, or private money. Prospective buyers must execute a Hold Harmless Addendum before scheduling a site visit. The canvas is ready. What will you build? See Attached Current Survey.
Key facts
- Two expansive lots
- 2.5 acre lot
- Built 1939
Tags
Property features AI
Exterior
- Parking: Driveway
- Utilities: Cesspool sewer; Cable available; Electricity available
- Home design: Single family residence; Living area reported from public records
- Construction: Frame construction
- Exterior features: Level lot; Additional parcel(s) included; Not waterfront
Interior
- Bathrooms: 2 full bathrooms
- Heating & cooling: Baseboard heating; Other heating; No central air
- Interior features: Other interior features; Basement with walk-out access; 7 total rooms
Neighborhood map
What this means for you Summary
Snapshot
- This is a 3-bed/2.0-bath single-family listed at $400k.
Deal economics
- At list price, monthly cash flow is $943 ($11k/yr) — positive.
- The deal already cash-flows at list — no discount required.
- Meets the 1% rule at list price ($5k rent vs $400k).
- Recommended offer: $394k (1.5% below list) — sets the bar for market timing.
- Cap rate 9.1% vs local median 3.8% in Centereach — top-decile yield for the area; either an underpriced asset or a hidden risk that comps aren't pricing in. Stress-test before assuming the spread holds.
Location & tenants
- Location reads 72/100 on livability (#362 in NY) — a middle-class / working-renter tenant base. Strengths: employment A+, housing A+, health & safety A+; Watch: amenities F, commute F, cost of living F.
- Middle Country Central School District (suburban): math 60% / reading 56% proficiency, ranked #217 of 590 in NY (top 37%) — acceptable for families but not a draw, mixed tenant base, ~2y average lease.
- Zoned schools: Oxhead Road School (math 37% / reading 42%, grade F, #1,444 of 2,108 statewide, top 71%, 371 students, 38% FRL); Dawnwood Middle School (math 37% / reading 46%, grade F, #394 of 729 statewide, top 55%, 1,074 students, 37% FRL); Centereach High School (math 84% / reading 77%, grade A, #506 of 1,100 statewide, top 46%, 1,475 students, 35% FRL) — zoned schools average 37% FRL vs 22% district-wide (15 pts higher); higher-poverty schools than district average — tighter screening recommended.
- Market conditions: 148 active listings in the ZIP; 6 comparable units currently listed for rent nearby; rentals at typical pace (median 26d on market — plan ~3-4 weeks tenant-placement turnaround); high-income renter base; 1,366 units permitted in Suffolk County in 2024 (216 in 5+ unit buildings).
- This rent runs 44% of the median local income ($135k/yr) — at the standard rent-burdened threshold; future hikes will face affordability resistance.
Forward outlook
- Local home prices are declining (-3.0%/yr); year-one equity from $3k of loan paydown is wiped out by about $12k of value loss. Plan a longer hold.
- Suffolk County population projected to shrink 5% by 2050 — rents likely to lag national; underwrite the cash flow, not the appreciation.
Negotiation context
- It's been on market 21 days — a 2% lower offer ($394k) is reasonable based on typical stale-listing flexibility.
- Current owner paid $110k; list at $400k implies a 264% gain — meaningful room to come down on a strong offer.
Risks & watch-outs
- Watch-outs: built in 1939 — expect roof / HVAC / electrical / plumbing capex.
- Climate carrying-cost: major wind risk, 78% chance of damaging wind over 30y; extreme-heat days projected 7→17/yr by 2055 (HVAC capex compounding) — expect insurance premiums to compound above CPI over the hold.
Questions for the listing agent
- Built in 1939 — when were the roof, HVAC, electrical panel, plumbing, and water heater last replaced?
- Is there a deadline driving the sale (1031 exchange, divorce, estate, relocation)? That informs how much negotiation room exists.
- Schools are B-rated — typically a magnet for longer-tenancy family renters. What's the average tenant stay here, and is there a school-zone premium baked into asking?
- What's the average days-on-market for RENTAL listings here right now (not sales)? A rising rental-DOM trend means longer vacancies and softer asking-rent achievability than the comps imply.
- What's the recent tenant-quality profile in this submarket — average credit score on applications, eviction rate, late-payment / NSF rate, and stable-employment percentage? A property-management company in the area should have these aggregated.
- How much new for-sale + rental construction is in the pipeline within 1–3 miles? Heavy new supply typically softens prices + rents 12–24 months out; constrained supply supports both.
Investment metrics
- 1% rule
- 1.22% ✓
- Cap rate
- 9.12%
- Cash-on-cash
- 10.11%
- DSCR
- 1.45
- GRM
- 6.8
CMA / ARV
- ARV (median comp)
- $716,118
- List price
- $399,900
- Delta
- -44.16%
- Verdict
- UNDERPRICED
- Comps
- 20 within 1.0 mi
Show comp detail 12 sales within ~0.75 mi
| Address | Dist | Beds/Ba | Sqft | Sold | Price | $/sf | Match |
|---|---|---|---|---|---|---|---|
| 11 St. James St | 0.24mi | 3/2.5 | 1,750 (-1%) | 8mo | $710,000 | $406 | 78 |
| 70 Forest Rd | 0.42mi | 3/2.0 | 1,891 (+7%) | 5mo | $755,000 | $399 | 65 |
| 9 Irene Ct | 0.29mi | 4/1.5 (+1) | 1,582 (-10%) | 10mo | $540,000 | $341 | 53 |
| 29 Cedar St | 0.51mi | 4/2.5 (+1) | 1,939 (+10%) | 5mo | $695,000 | $358 | 49 |
| 22 Morning Dr | 0.65mi | 4/2.0 (+1) | 1,700 (-4%) | 12mo | $650,000 | $382 | 48 |
| 150 Hammond Ln | 0.38mi | 4/2.5 (+1) | 2,020 (+14%) | 10mo | $750,000 | $371 | 43 |
| 44 Picket Ln | 0.71mi | 3/1.5 | 1,900 (+8%) | 12mo | $660,000 | $347 | 42 |
| 71 Hunter Ln | 0.71mi | 4/3.0 (+1) | 1,608 (-9%) | 1mo | $686,000 | $427 | 42 |
| 2 Loretta Ct | 0.68mi | 3/3.0 | 1,850 (+5%) | 19mo | $599,900 | $324 | 41 |
| 198 Tree Rd | 0.55mi | 4/2.0 (+1) | 1,890 (+7%) | 21mo | $655,000 | $347 | 41 |
| 5 Sycamore St | 0.64mi | 4/2.0 (+1) | 1,510 (-15%) | 6mo | $555,000 | $368 | 36 |
| 171 Stanley Dr | 0.71mi | 4/2.0 (+1) | 1,512 (-14%) | 4mo | $540,000 | $357 | 35 |
Match score weights: distance 35% · size 25% · config 20% · recency 20%. Top-matched comps best support the ARV.
Projected returns pro-forma
-3.0% appreciation · 3.0% rent growth · sell at horizon
- IRR
- -1.1%
- Equity multiple
- 0.96×
- Total profit
- $-4,551
- Equity at exit
- $59,626
- IRR
- 8.6%
- Equity multiple
- 1.66×
- Total profit
- $74,098
- Equity at exit
- $34,576
Cash invested: $111,972 (down + closing). Projections, not guarantees.
Landlord ↔ Tenant lean methodology
- Overall (STATE)
- 15 Strongly Tenant-Friendly
- State New York
- 15 Strongly Tenant-Friendly · D+10
- County
- — inherits STATE
- City
- — inherits STATE
ZIP-level market 11720
- Active inventory
- 148
- Price-to-rent
- 6.8×
Monthly cashflow live
- Estimated rent
- $4,896 high interval (Pro) →
- Mortgage (P&I)
- −$2,097
- Tax from tax record
- −$661 /mo · $7,930/yr
- Insurance
- −$167
- HOA
- −$0
- Vacancy / Maint / Mgmt
- −$1,028
- Net cashflow
- $943
Break-even live
Sensitivity live
| Price | -10% $1,170 | -5% $1,056 | +0% $943 | +5% $830 | +10% $717 |
|---|---|---|---|---|---|
| Rent | -10% $556 | -5% $750 | +0% $943 | +5% $1,137 | +10% $1,330 |
| Rate | -1.0pp $1,145 | -0.5pp $1,045 | base $943 | +0.5pp $840 | +1.0pp $734 |
UW: 25.0% down · 7.5% · 30yr · 1.5% tax · 5.0% vac · 8.0% maint · 8.0% mgmt
Financing live
Cash to close
- Down payment
- $99,975
- Closing costs
- $11,997
- Reserves months
- —
- Total cash needed
- —
Loan-product check · same deal, 3 products live
Conventional
25% down · 7.5% · 30yr
- Down + closing
- —
- Monthly P&I
- —
- Monthly cashflow
- —
- DSCR
- —
- Eligible?
- —
Personal DTI + credit; lowest rate.
DSCR
20% down · 8.5% · 30yr
- Down + closing
- —
- Monthly P&I
- —
- Monthly cashflow
- —
- DSCR
- —
- Eligible?
- —
No personal income docs; deal must DSCR.
Hard money
10% down · 12.0% · 12mo
- Down + closing
- —
- Monthly P&I
- —
- Monthly cashflow
- —
- DSCR
- —
- Eligible?
- —
Short-term bridge; refi at stabilization.
Rent comps 6 comps
| Address | Beds | Baths | Sqft | Rent | $/sqft | DOM | Units | Dist |
|---|---|---|---|---|---|---|---|---|
| 63 Sunflower Ridge Rd South Setauket, NY | 4.0 | 2.5 | 2479 | $5,300 | $2.14 | 26d | 1 | 0.42mi |
| 103 Sunflower Ridge Rd South Setauket, NY | 3.0 | 4.0 | 2274 | $5,000 | $2.20 | 0d | 1 | 0.53mi |
| 14 Green Pl South Setauket, NY | 4.0 | 2.5 | 2550 | $5,200 | $2.04 | 0d | 1 | 0.84mi |
| 21 Fairway Dr South Setauket, NY | 4.0 | 2.5 | 2388 | $5,000 | $2.09 | 46d | 1 | 0.87mi |
| 61 Gould Rd Centereach, NY | 4.0 | 3.0 | 2592 | $3,850 | $1.49 | 26d | 1 | 0.89mi |
| 64 Neal Path Centereach, NY | 1.0–3.0 | 2.0 | 1252 | $4,270 | $3.41 | 0d | 1 | 1.16mi |
Listing history 8 events
-
2026-06-07statusdays on market $399,900 Pending 21 DOM
-
2026-06-04days on market $399,900 Active 20 DOM
-
2026-06-03days on market $399,900 Active 19 DOM
-
2026-06-02days on market $399,900 Active 18 DOM
-
2026-06-01days on market $399,900 Active 17 DOM
-
2026-05-31days on market $399,900 Active 16 DOM
-
2026-05-15$399,900 Active 571-char remark
-
1992-04-01soldstatus $110,000
ⓘ Source: listings_history table (triggers on properties + properties_extension) + one-shot
backfill from property_details.listing_events for pre-trigger history.
Tax reassessment forecast NY · Partial reset (capped growth)
- Current annual tax
- $7,930 · $661/mo
- Projected year-2 tax
- $7,930 · $661/mo
- Expected delta
- $0/yr ($0/mo · 0.0%)
ⓘ Screening estimate from a state-policy table — verify with the county assessor before closing.
Climate risk First Street
- Flood 1/10 Low FEMA zone X (unshaded) · 0% chance over 30 yrs
- Wildfire 1/10 Low
- Heat 5/10 Major 7 d/yr ≥94°F today · 17 d/yr by 30 yrs out
- Wind 7/10 Severe 78% chance of damaging wind over 30 yrs
- Air quality 4/10 Moderate 4 unhealthy d/yr today · 5 by 30 yrs out
Nearby sold comps map
Loading sold comps map…
Walkable amenities ~0.75 mi
Loading nearby amenities…
Taxation est. · year 1
- Rental income
- $58,752
- − Mortgage interest
- −$22,401
- − Property taxes
- −$7,930
- − Insurance
- −$2,000
- − Repairs & maintenance
- −$4,700
- − Management
- −$4,700
- − Depreciation
- −$11,633
- Taxable income
- $5,388
- Est. tax owed @ 24.0%
- −$1,293
- After-tax cash flow
- $10,026/yr
For passive investors: Depreciation is non-cash, so a rental often shows a tax loss while cash-flowing — sheltering income. Rental losses are passive: they offset passive income freely, and up to $25,000/yr can offset ordinary (W-2) income if you actively participate and your MAGI is under $100k (phasing out to $0 by $150k); unused losses carry forward. On sale, claimed depreciation is recaptured at up to 25%, and gains may owe capital-gains tax (a 1031 exchange can defer both). Figures are a year-1 estimate at your 24.0% rate — not tax advice; consult a CPA.
Schools (NCES district)
- District
- Middle Country Central School District
- NCES district ID
- 3619200
- Math proficiency
- 60% ▼ -1.00%
- Reading proficiency
- 56% ▼ -5.00%
- Median HH income
- $86,140
- Composite
- 52.89/100
- National rank
- #1532
- State rank
- #217 of 590 in NY
Livability — Centereach
- Score
- 72/100
- State rank
- #362
- US rank
- #6174
Category grades
Schools grade is shown separately in the Schools card above.
Census & demographics
- Census place
- Centereach, NY
- County
- Suffolk County · 679,920 people
- City population
- 29,292
- Metro
- New York-Newark-Jersey City, NY-NJ-PA
- Population (ZIP)
- 29,292
- Household income
- $134,898
- Rent vs Own
- Severe rent burden
- 436.0
Population outlook (Suffolk County) Hauer SSP2
- Today (2025)
- 1,505,262 people
- By 2030
- 1,498,318 · -0.5%
- By 2040
- 1,471,101 · -2.3%
- By 2050
- 1,424,848 · -5.3%
- By 2075
- 1,337,157 · -11.2%
- By 2100
- 1,217,720 · -19.1%
Race, ethnicity, and origin ACS 2023
- Neighborhood character
- Predominantly White (69%)
- Race & ethnicity
- White 69% Hispanic / Latino 15% Asian 7% Two or more races 7% Black 6%
- Hispanic origin (detail)
- Mexican 1% Puerto Rican 5%
- Common ancestry
- Romanian 4% Scotch-Irish 2% Lithuanian 2%
- Foreign-born
- 15% · Canada, China, Jamaica
- Languages at home
- 82% English-only · Spanish 8% Other Indo-European 3% Other Asian/Pacific 2%
Political lean MEDSL · Suffolk
- 2024 margin
- Lean R (+10.0) · D 45.0% · R 55.0%
- 2008→2024 swing
- -16.0pp toward R · 2008: 6.0pp · 2024: -10.0pp
- All cycles
- 2024: R+10.0 2020: R+0.0 2016: R+8.2 2012: D+2.9 2008: D+6.0
Not yet ingested
- Civics
- —
Market trends
- HPI YoY
- ▼ -633.07%
- Current HPI
- 347.7369
- Rent YoY
- —
- Metro
- New York-Newark-Jersey City, NY-NJ-PA
- State GDP YoY
- ▲ 2.60%
- F500 in state
- 92
Industry mix (Fortune 500 HQ in NY)
| Industry | F500 HQs | Revenue |
|---|---|---|
| Financial Services | 10 | $950B |
|
||
| Consumer Goods | 9 | $162B |
|
||
| Insurance | 4 | $225B |
|
||
| Telecommunications | 2 | $144B |
|
||
| Pharmaceuticals | 2 | $112B |
|
||
| Media / Entertainment | 2 | $69B |
|
||
Price history
+263.5% since first listed3 events — show timeline
- 2026-06-05 Pending — OneKey® MLS as Distributed by MLS Grid
- 2026-05-15 Listed $399,900 OneKey® MLS as Distributed by MLS Grid
- 1992-04-01 Sold (Public Records) $110,000 Public Records
Property tax history
+1.9%/yrLatest (2025): $7,930 · +0.0% YoY. Source: county tax records.
Cash-flow waterfall
monthlySold comps — $/sqft
last 12 mo · ≤1 miLoading sold comps…