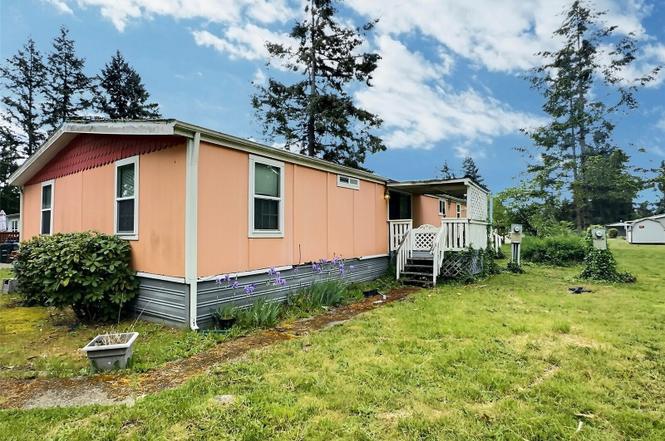
8304 192nd Street Ct E #24 · Graham, WA
Flood risk 1/10 · Minimal
- FEMA flood zone
- X (unshaded)
- Chance of flooding over 30 yrs
- 0.0%
- Est. flood insurance / yr
- $507 – $1,088
Fire risk 1/10 · Minimal
- Est. fire insurance / yr
- $604 – $1,122
Heat risk 3/10 · Minor
- Hot days now (above 87°F)
- 7 days/yr
- Hot days in 30 yrs
- 14 days/yr
Wind risk 1/10 · Minimal
- Chance of severe wind over 30 yrs
- —
Air-quality risk 7/10 · Major
- Unhealthy air days now
- 10 days/yr
- Unhealthy air days in 30 yrs
- 10 days/yr
Risk factors via First Street. Map © Google.
Why this score? — see what drove the B+ grade
The composite is a weighted blend of 9 inputs, each scored 0–100. Each bar is that input's sub-score; the figure is the points it added to the 100-point composite (weight × sub-score).
- Cash flow +30.0/30.0
- ARV discount +15.0/15.0
- 1% rule +10.0/10.0
- DSCR +10.0/10.0
- Schools +4.9/10.0
- Rent growth +3.6/5.0
- Livability +3.2/5.0
- Condition / age +2.5/5.0
- Appreciation +0.0/10.0
$100,000
🖨 Deal sheet (PDF) 📄 Offer letter ✓ Due diligence
Listing remarks
Investor opportunity! Priced well below market value, this home is perfect for adding to your rental portfolio or customizing as a personal residence. Featuring a large living and dining area, the layout offers plenty of space for entertaining or relaxing. The spacious kitchen provides ample storage and prep space, while the generously sized bedrooms ensure comfort for all. Enjoy a large backyard—ideal for gardening, pets, or outdoor gatherings. Additional highlights include a 2-car carport and a brand-new tankless water heater. Don’t miss this value-packed opportunity in Spanaway!
Key facts
- 2-car carport
- Large backyard
- Spacious kitchen
Tags
Property features AI
Finance
- Other: Property condition: Fair
- Financial info: Listing terms: Cash; Land lease amount; Tax information
- HOA & community: Located in Crystal Pointe mobile home park; Park amenities include RV parking and security gate; Park approved for sale; Land lease
Exterior
- Parking: Carport
- Security: Security gate
- Utilities: Public water; Septic sewer; Electric power; Electric water heater (located in hallway)
- Home design: Manufactured double-wide home; One level; Mobile home remains
- Construction: Wood construction; Composition roof; Pillar/post/pier foundation with tie downs; Manufactured after 6/15/1976 (Champion)
- Exterior features: Wood products siding; Paved lot
Interior
- Bedrooms: 3 bedrooms
- Flooring: Carpet
- Bathrooms: 2 full baths; 1 half bath; 2 bathtubs
- Heating & cooling: Forced air heating; No cooling
- Interior features: Water heater; Security gate
Neighborhood map
What this means for you Summary
Snapshot
- This is a 3-bed/3.0-bath manufactured listed at $100k.
Deal economics
- At list price, monthly cash flow is $2k ($22k/yr) — positive.
- The deal already cash-flows at list — no discount required.
- Meets the 1% rule at list price ($3k rent vs $100k).
- Recommended offer: $88k (12.0% below list) — sets the bar for market timing.
- Cap rate 27.8% vs local median 3.6% in Graham — top-decile yield for the area; either an underpriced asset or a hidden risk that comps aren't pricing in. Stress-test before assuming the spread holds.
Location & tenants
- Location reads 64/100 on livability (#373 in WA) — a middle-class / working-renter tenant base. Strengths: employment A+, housing A+; Watch: crime C-, health & safety C-, amenities F.
- Bethel School District (suburban): math 47% / reading 59% proficiency, ranked #103 of 291 in WA (top 35%) — acceptable for families but not a draw, mixed tenant base, ~2y average lease.
- Zoned schools: Elk Plain School of Choice (570 students, 39% FRL); Liberty Middle School (936 students, 55% FRL); Graham Kapowsin High School (2,011 students, 49% FRL).
- Market conditions: Rents rising fast (+4.2%/yr); 388 active listings in the ZIP; 14 comparable units currently listed for rent nearby; rentals at typical pace (median 20d on market — plan ~3-4 weeks tenant-placement turnaround); solid renter incomes; 3,209 units permitted in Pierce County in 2024 (1,269 in 5+ unit buildings).
- This rent runs 35% of the median local income ($107k/yr) — at the standard rent-burdened threshold; future hikes will face affordability resistance.
Forward outlook
- Local home prices are declining (-3.0%/yr); year-one equity from $691 of loan paydown is wiped out by about $3k of value loss. Plan a longer hold.
- Pierce County population projected at +26% by 2050 — long-run rental-demand tailwind backs the buy-and-hold thesis.
- At projected returns (-3.0% appreciation + 4.2% rent growth), your $28k cash investment doubles in ~2 years — after that, you're playing with house money.
Negotiation context
- It's been on market 129 days — a 12% lower offer ($88k) is reasonable based on typical stale-listing flexibility.
Questions for the listing agent
- It's been on market 129 days. Have you received any prior offers? Is the seller open to a 12% concession, seller financing, or rate buy-down credit?
- Why hasn't it sold? Are there any deal-killer items the seller is aware of (foundation, flood, title, zoning, code violations)?
- Is there a deadline driving the sale (1031 exchange, divorce, estate, relocation)? That informs how much negotiation room exists.
- What's the average days-on-market for RENTAL listings here right now (not sales)? A rising rental-DOM trend means longer vacancies and softer asking-rent achievability than the comps imply.
- What's the recent tenant-quality profile in this submarket — average credit score on applications, eviction rate, late-payment / NSF rate, and stable-employment percentage? A property-management company in the area should have these aggregated.
- How much new for-sale + rental construction is in the pipeline within 1–3 miles? Heavy new supply typically softens prices + rents 12–24 months out; constrained supply supports both.
Investment metrics
- 1% rule
- 3.11% ✓
- Cap rate
- 27.79%
- Cash-on-cash
- 76.79%
- DSCR
- 4.42
- GRM
- 2.7
CMA / ARV
- ARV (on-the-fly)
- $181,440
- Comps found
- 12
Show comp detail 12 sales within ~0.75 mi
| Address | Dist | Beds/Ba | Sqft | Sold | Price | $/sf | Match |
|---|---|---|---|---|---|---|---|
| 8215 192nd Street Ct E #34 | 0.05mi | 4/2.0 (+1) | 1,782 (+3%) | 4mo | $190,000 | $107 | 80 |
| 8102 195th St E #95 | 0.17mi | 3/2.0 | 1,778 (+3%) | 5mo | $180,000 | $101 | 79 |
| 8009 195th St E #89 | 0.21mi | 3/2.0 | 1,772 (+2%) | 5mo | $125,000 | $71 | 78 |
| 8004 195th St E #91 | 0.25mi | 3/2.0 | 1,726 (-0%) | 18mo | $149,900 | $87 | 69 |
| 8004 192nd Street Ct E #10 | 0.20mi | 4/2.0 (+1) | 1,782 (+3%) | 11mo | $230,000 | $129 | 67 |
| 8104 194th St E #51 | 0.15mi | 4/2.0 (+1) | 1,778 (+3%) | 15mo | $145,000 | $82 | 66 |
| 8417 195th St E #121 | 0.14mi | 4/2.0 (+1) | 1,782 (+3%) | 16mo | $175,000 | $98 | 66 |
| 8216 195th St E #103 | 0.14mi | 3/2.0 | 1,613 (-7%) | 22mo | $173,950 | $108 | 60 |
| 20306 77th Ave E | 0.74mi | 3/2.5 | 1,716 (-1%) | 18mo | $180,000 | $105 | 48 |
| 7725 203rd Street Ct E #27 | 0.72mi | 4/2.0 (+1) | 1,782 (+3%) | 10mo | $198,000 | $111 | 44 |
| 20315 77th Ave E #31 | 0.70mi | 3/2.0 | 1,847 (+7%) | 17mo | $184,000 | $100 | 38 |
| 7218 191st Street Ct E | 0.67mi | 4/2.0 (+1) | 1,848 (+7%) | 14mo | $480,000 | $260 | 37 |
Match score weights: distance 35% · size 25% · config 20% · recency 20%. Top-matched comps best support the ARV.
Projected returns pro-forma
-3.0% appreciation · 4.24% rent growth · sell at horizon
- IRR
- 78.2%
- Equity multiple
- 4.64×
- Total profit
- $101,871
- Equity at exit
- $14,910
- IRR
- 82.0%
- Equity multiple
- 10.01×
- Total profit
- $252,302
- Equity at exit
- $8,646
Cash invested: $28,000 (down + closing). Projections, not guarantees.
Landlord ↔ Tenant lean methodology
- Overall (STATE)
- 28 Tenant-Leaning
- State Washington
- 28 Tenant-Leaning · D+8
- County
- — inherits STATE
- City
- — inherits STATE
ZIP-level market 98387
- Rents YoY
- 4.2%
- Active inventory
- 388
- Price-to-rent
- 2.7×
Monthly cashflow live
- Estimated rent
- $3,109 high interval (Pro) →
- Mortgage (P&I)
- −$524
- Tax from tax record
- −$98 /mo · $1,178/yr
- Insurance
- −$42
- HOA
- −$0
- Vacancy / Maint / Mgmt
- −$653
- Net cashflow
- $1,792
Break-even live
Sensitivity live
| Price | -10% $1,848 | -5% $1,820 | +0% $1,792 | +5% $1,763 | +10% $1,735 |
|---|---|---|---|---|---|
| Rent | -10% $1,546 | -5% $1,669 | +0% $1,792 | +5% $1,915 | +10% $2,037 |
| Rate | -1.0pp $1,842 | -0.5pp $1,817 | base $1,792 | +0.5pp $1,766 | +1.0pp $1,739 |
UW: 25.0% down · 7.5% · 30yr · 1.5% tax · 5.0% vac · 8.0% maint · 8.0% mgmt
Financing live
Cash to close
- Down payment
- $25,000
- Closing costs
- $3,000
- Reserves months
- —
- Total cash needed
- —
Loan-product check · same deal, 3 products live
Conventional
25% down · 7.5% · 30yr
- Down + closing
- —
- Monthly P&I
- —
- Monthly cashflow
- —
- DSCR
- —
- Eligible?
- —
Personal DTI + credit; lowest rate.
DSCR
20% down · 8.5% · 30yr
- Down + closing
- —
- Monthly P&I
- —
- Monthly cashflow
- —
- DSCR
- —
- Eligible?
- —
No personal income docs; deal must DSCR.
Hard money
10% down · 12.0% · 12mo
- Down + closing
- —
- Monthly P&I
- —
- Monthly cashflow
- —
- DSCR
- —
- Eligible?
- —
Short-term bridge; refi at stabilization.
Rent comps 14 comps
| Address | Beds | Baths | Sqft | Rent | $/sqft | DOM | Units | Dist |
|---|---|---|---|---|---|---|---|---|
| 19605 84th Ave E Spanaway, WA | 3.0 | 2.5 | 1916 | $3,050 | $1.59 | 25d | 1 | 0.20mi |
| 20519 80th Ave E Spanaway, WA | 4.0 | 2.5 | 2031 | $2,925 | $1.44 | 6d | 1 | 0.80mi |
| 20121 70th Ave E Spanaway, WA | 4.0 | 3.0 | 1680 | $2,950 | $1.76 | 0d | 1 | 0.96mi |
| 18317 96th Ave E Puyallup, WA | 4.0 | 2.5 | 2150 | $5,500 | $2.56 | 45d | 1 | 1.00mi |
| 18511 97th Ave E Puyallup, WA | 3.0 | 2.5 | 2104 | $2,895 | $1.38 | 19d | 1 | 1.01mi |
| 17814 75th Ave E Puyallup, WA | 2.0 | 1.5 | 1064 | $2,295 | $2.16 | 22d | 1 | 1.02mi |
| 20624 74th Ave E Spanaway, WA | 4.0 | 2.5 | 2197 | $1,400 | $0.64 | 0d | 1 | 1.07mi |
| 19906 100th Avenue Ct E Graham, WA | 3.0 | 2.0 | 1322 | $2,749 | $2.08 | 18d | 1 | 1.11mi |
| 8345 175th Street Ct E Puyallup, WA | 2.0 | 2.5 | 1588 | $2,300 | $1.45 | 14d | 1 | 1.11mi |
| 17908 72nd Ave E Puyallup, WA | 3.0 | 2.5 | 1719 | $1,400 | $0.81 | 25d | 1 | 1.11mi |
| 7513 177th Street Ct E Puyallup, WA | 1.0–4.0 | 1.0–2.5 | 1243 | $2,940 | $2.37 | 11d | 7 | 1.13mi |
| 7343 177th St E Puyallup, WA | 3.0 | 3.0 | 1962 | $2,795 | $1.42 | 23d | 1 | 1.17mi |
| 10234 194th St E Graham, WA | 2.0 | 1.0–2.5 | 1231 | $2,252 | $1.83 | 0d | 17 | 1.26mi |
| 10110 184th St E Puyallup, WA | 3.0 | 2.5 | 1582 | $2,595 | $1.64 | 45d | 1 | 1.28mi |
Listing history 16 events
-
2026-06-21days on market $100,000 Active 129 DOM
-
2026-06-18days on market $100,000 Active 126 DOM
-
2026-06-17days on market $100,000 Active 125 DOM
-
2026-06-16days on market $100,000 Active 124 DOM
-
2026-06-15days on market $100,000 Active 123 DOM
-
2026-06-13days on market $100,000 Active 121 DOM
-
2026-06-13days on market $100,000 Active 120 DOM
-
2026-06-09days on market $100,000 Active 117 DOM
-
2026-06-08days on market $100,000 Active 116 DOM
-
2026-06-07days on market $100,000 Active 115 DOM
-
2026-06-04days on market $100,000 Active 112 DOM
-
2026-06-03days on market $100,000 Active 111 DOM
-
2026-06-02days on market $100,000 Active 110 DOM
-
2026-06-01days on market $100,000 Active 109 DOM
-
2026-05-31days on market $100,000 Active 108 DOM
-
2026-02-12$100,000 Active
ⓘ Source: listings_history table (triggers on properties + properties_extension) + one-shot
backfill from property_details.listing_events for pre-trigger history.
Tax reassessment forecast WA · Resets to sale price
- Current annual tax
- $1,178 · $98/mo
- Projected year-2 tax
- $1,178 · $98/mo
- Expected delta
- $0/yr ($0/mo · 0.0%)
ⓘ Screening estimate from a state-policy table — verify with the county assessor before closing.
Climate risk First Street
- Flood 1/10 Low FEMA zone X (unshaded) · 0% chance over 30 yrs
- Wildfire 1/10 Low
- Heat 3/10 Moderate 7 d/yr ≥87°F today · 14 d/yr by 30 yrs out
- Wind 1/10 Low
- Air quality 7/10 Severe 10 unhealthy d/yr today · 10 by 30 yrs out
Nearby sold comps map
Loading sold comps map…
Walkable amenities ~0.75 mi
Loading nearby amenities…
Taxation est. · year 1
- Rental income
- $37,307
- − Mortgage interest
- −$5,602
- − Property taxes
- −$1,178
- − Insurance
- −$500
- − Repairs & maintenance
- −$2,985
- − Management
- −$2,985
- − Depreciation
- −$2,909
- Taxable income
- $21,149
- Est. tax owed @ 24.0%
- −$5,076
- After-tax cash flow
- $16,425/yr
For passive investors: Depreciation is non-cash, so a rental often shows a tax loss while cash-flowing — sheltering income. Rental losses are passive: they offset passive income freely, and up to $25,000/yr can offset ordinary (W-2) income if you actively participate and your MAGI is under $100k (phasing out to $0 by $150k); unused losses carry forward. On sale, claimed depreciation is recaptured at up to 25%, and gains may owe capital-gains tax (a 1031 exchange can defer both). Figures are a year-1 estimate at your 24.0% rate — not tax advice; consult a CPA.
Schools (NCES district)
- District
- Bethel School District
- NCES district ID
- 5300480
- Math proficiency
- 47% ▬ 0.00%
- Reading proficiency
- 59% ▲ 2.00%
- Median HH income
- $65,872
- Composite
- 48.66/100
- National rank
- #4568
- State rank
- #103 of 291 in WA
Livability — Graham
- Score
- 64/100
- State rank
- #373
- US rank
- #14219
Category grades
Schools grade is shown separately in the Schools card above.
Census & demographics
- Census place
- Graham, WA
- County
- Pierce County · 788,257 people
- City population
- 32,687
- Metro
- Seattle-Tacoma-Bellevue, WA
- Population (ZIP)
- 50,774
- Household income
- $106,872
- Rent vs Own
- Severe rent burden
- 807.0
Population outlook (Pierce County) Hauer SSP2
- Today (2025)
- 956,648 people
- By 2030
- 1,010,862 · +5.7%
- By 2040
- 1,113,170 · +16.4%
- By 2050
- 1,206,524 · +26.1%
- By 2075
- 1,436,425 · +50.2%
- By 2100
- 1,563,654 · +63.5%
Race, ethnicity, and origin ACS 2023
- Neighborhood character
- Diverse neighborhood (Simpson 0.68)
- Race & ethnicity
- White 53% Two or more races 18% Hispanic / Latino 16% Black 10% Asian 6% Pacific Islander 4%
- Hispanic origin (detail)
- Mexican 10% Puerto Rican 2%
- Common ancestry
- Portuguese 3% Italian 3% Slovak 2%
- Foreign-born
- 11% · Canada, South Korea
- Languages at home
- 82% English-only · Spanish 7% Russian/Polish/Slavic 2% Other Asian/Pacific 2%
Political lean MEDSL · Pierce
- 2024 margin
- D (+10.8) · D 53.9% · R 43.1% · Other 3.0%
- 2008→2024 swing
- -1.4pp toward R · 2008: 12.2pp · 2024: 10.8pp
- All cycles
- 2024: D+10.8 2020: D+11.2 2016: D+7.5 2012: D+11.0 2008: D+12.2
Not yet ingested
- Civics
- —
Market trends
- HPI YoY
- ▼ -208.94%
- Current HPI
- 308.0462
- Rent YoY
- ▲ 4.24%
- Metro
- Seattle-Tacoma-Bellevue, WA
- State GDP YoY
- ▲ 4.65%
- F500 in state
- 22
Industry mix (Fortune 500 HQ in WA)
| Industry | F500 HQs | Revenue |
|---|---|---|
| Retail | 2 | $269B |
|
||
| Technology / Retail | 1 | $638B |
|
||
| Technology | 1 | $245B |
|
||
| Telecommunications | 1 | $38B |
|
||
| Food / Beverage | 1 | $36B |
|
||
| Automotive / Trucks | 1 | $34B |
|
||
Price history
1 event — show timeline
- 2026-02-12 Listed $100,000 NWMLS as Distributed by MLS Grid
Property tax history
+10.3%/yrLatest (2026): $1,178 · +7.8% YoY. Source: county tax records.
Cash-flow waterfall
monthlySold comps — $/sqft
last 12 mo · ≤1 miLoading sold comps…