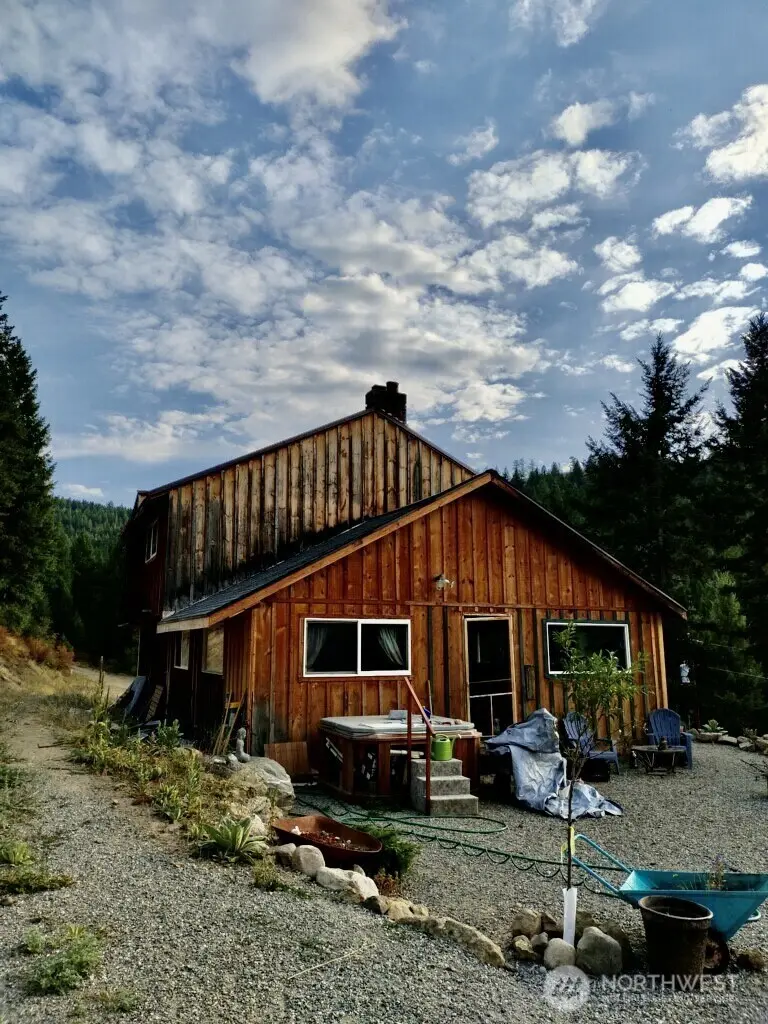
57 Slippery Hill Ln · Curlew Lake, WA
Flood risk 1/10 · Minimal
- FEMA flood zone
- X (unshaded)
- Chance of flooding over 30 yrs
- 0.0%
- Est. flood insurance / yr
- $507 – $1,088
Fire risk 9/10 · Severe
- Est. fire insurance / yr
- $604 – $1,122
Heat risk 1/10 · Minimal
- Hot days now (above 89°F)
- 7 days/yr
- Hot days in 30 yrs
- 15 days/yr
Wind risk 1/10 · Minimal
- Chance of severe wind over 30 yrs
- —
Air-quality risk 9/10 · Severe
- Unhealthy air days now
- 17 days/yr
- Unhealthy air days in 30 yrs
- 22 days/yr
Risk factors via First Street. Map © Google.
Why this score? — see what drove the D grade
The composite is a weighted blend of 9 inputs, each scored 0–100. Each bar is that input's sub-score; the figure is the points it added to the 100-point composite (weight × sub-score).
- Cash flow +11.5/30.0
- ARV discount +7.5/15.0
- Appreciation +6.7/10.0
- Schools +4.0/10.0
- DSCR +3.4/10.0
- Livability +2.9/5.0
- Rent growth +2.5/5.0
- Condition / age +2.5/5.0
- 1% rule +2.2/10.0
$189,000
🖨 Deal sheet (PDF) 📄 Offer letter ✓ Due diligence
Listing remarks MLS
2 1/2 story home w/ propane and electric lights. Some trim and wall work needed. TLC and you'll have a nice home on a lottle over 7acres. Bank owned. Submit offers. Call L. A. for combo.
Key facts
- Newer roof
- Newer siding
- 7.65 acre lot
Tags
Neighborhood map
What this means for you Summary
Snapshot
- This is a 3-bed/1.0-bath single-family listed at $189k.
Deal economics
- At list price, monthly cash flow is $-62 ($-749/yr) — negative.
- To cash-flow at today's rent, offer at most $178k (5.8% below list).
- To meet the 1% rule (rent ≥ 1% of price), the offer needs to be $137k (27.5% below list).
- Recommended offer: $137k (27.5% below list) — sets the bar for 1% rule.
Location & tenants
- Location reads 58/100 on livability (#512 in WA) — a working-class tenant base; expect higher turnover. Strengths: housing A+, employment B+; Watch: crime C-, cost of living C-, amenities F.
- Republic School District (rural): math 40% / reading 50% proficiency, ranked #193 of 291 in WA (top 66%) — families likely to look elsewhere, expect single-tenant / working-renter base with shorter leases.
- Zoned schools: Republic Elementary School (170 students, 76% FRL); Republic Junior High (55 students, 76% FRL); Republic Senior High School (107 students, 68% FRL) — zoned schools average 74% FRL vs 50% district-wide (24 pts higher); higher-poverty schools than district average — tighter screening recommended.
- Market conditions: 76 active listings in the ZIP; 25 units permitted in Ferry County in 2024 (0 in 5+ unit buildings).
Forward outlook
- In year one you build about $8k of equity ($1k loan paydown + $7k appreciation (3.5% local appreciation)).
- Ferry County population projected at -14% by 2050 — secular population decline; favor cash flow + early exit over multi-decade hold.
- At projected returns (3.5% appreciation + 3.0% rent growth), your $53k cash investment doubles in ~6 years — after that, you're playing with house money.
- By year 5, paydown + projected appreciation supports a ~$34k cash-out refi (75% LTV) — recoverable capital for the next deal without selling this one.
Negotiation context
- It's been on market 137 days — a 12% lower offer ($166k) is reasonable based on typical stale-listing flexibility.
- 3 sale attempts since 24y ago; this cycle's ask has dropped $10k (5%) from the opening price — seller is motivated, your offer sets the floor, not the list.
- Current owner paid $28k; list at $189k implies a 563% gain — meaningful room to come down on a strong offer.
Risks & watch-outs
- Climate carrying-cost: severe wildfire risk — expect insurance premiums to compound above CPI over the hold.
Questions for the listing agent
- What do current leases actually rent for vs. the listed asking? Can we see a recent rent roll and the last 12 months of T-12 income?
- It's been on market 137 days. Have you received any prior offers? Is the seller open to a 28% concession, seller financing, or rate buy-down credit?
- Why hasn't it sold? Are there any deal-killer items the seller is aware of (foundation, flood, title, zoning, code violations)?
- Is there a deadline driving the sale (1031 exchange, divorce, estate, relocation)? That informs how much negotiation room exists.
- Schools are F-rated, which usually means shorter tenancies and higher turnover. Who's the typical renter profile here, and what's been the actual vacancy rate?
- The area grade is low — what's the realistic commute time and amenity access for the typical tenant pool here? Any planned neighborhood developments (good or bad) we should know about?
- What's the average days-on-market for RENTAL listings here right now (not sales)? A rising rental-DOM trend means longer vacancies and softer asking-rent achievability than the comps imply.
- What's the recent tenant-quality profile in this submarket — average credit score on applications, eviction rate, late-payment / NSF rate, and stable-employment percentage? A property-management company in the area should have these aggregated.
- How much new for-sale + rental construction is in the pipeline within 1–3 miles? Heavy new supply typically softens prices + rents 12–24 months out; constrained supply supports both.
Investment metrics
- 1% rule
- 0.72% ✗
- Cap rate
- 5.90%
- Cash-on-cash
- -1.41%
- DSCR
- 0.94
- GRM
- 11.5
CMA / ARV
No comps found within radius.
Projected returns pro-forma
3.45% appreciation · 3.0% rent growth · sell at horizon
- IRR
- 7.5%
- Equity multiple
- 1.44×
- Total profit
- $23,226
- Equity at exit
- $89,781
- IRR
- 9.9%
- Equity multiple
- 2.56×
- Total profit
- $82,687
- Equity at exit
- $142,214
Cash invested: $52,920 (down + closing). Projections, not guarantees.
Landlord ↔ Tenant lean methodology
- Overall (STATE)
- 28 Tenant-Leaning
- State Washington
- 28 Tenant-Leaning · D+8
- County
- — inherits STATE
- City
- — inherits STATE
ZIP-level market 99166
- Home prices YoY
- 2.1%
- Active inventory
- 76
- Price-to-rent
- 11.5×
Monthly cashflow live
- Estimated rent
- $1,370 medium interval (Pro) →
- Mortgage (P&I)
- −$991
- Tax from tax record
- −$74 /mo · $894/yr
- Insurance
- −$79
- HOA
- −$0
- Vacancy / Maint / Mgmt
- −$288
- Net cashflow
- $-62
Break-even live
Sensitivity live
| Price | -10% $45 | -5% $-9 | +0% $-62 | +5% $-116 | +10% $-169 |
|---|---|---|---|---|---|
| Rent | -10% $-171 | -5% $-116 | +0% $-62 | +5% $-8 | +10% $46 |
| Rate | -1.0pp $33 | -0.5pp $-14 | base $-62 | +0.5pp $-111 | +1.0pp $-161 |
UW: 25.0% down · 7.5% · 30yr · 1.5% tax · 5.0% vac · 8.0% maint · 8.0% mgmt
Financing live
Cash to close
- Down payment
- $47,250
- Closing costs
- $5,670
- Reserves months
- —
- Total cash needed
- —
Loan-product check · same deal, 3 products live
Conventional
25% down · 7.5% · 30yr
- Down + closing
- —
- Monthly P&I
- —
- Monthly cashflow
- —
- DSCR
- —
- Eligible?
- —
Personal DTI + credit; lowest rate.
DSCR
20% down · 8.5% · 30yr
- Down + closing
- —
- Monthly P&I
- —
- Monthly cashflow
- —
- DSCR
- —
- Eligible?
- —
No personal income docs; deal must DSCR.
Hard money
10% down · 12.0% · 12mo
- Down + closing
- —
- Monthly P&I
- —
- Monthly cashflow
- —
- DSCR
- —
- Eligible?
- —
Short-term bridge; refi at stabilization.
Listing history 25 events
-
2026-06-21days on market $189,000 Active 137 DOM
-
2026-06-21days on market $189,000 Active 136 DOM
-
2026-06-18days on market $189,000 Active 134 DOM
-
2026-06-17days on market $189,000 Active 133 DOM
-
2026-06-16days on market $189,000 Active 132 DOM
-
2026-06-15days on market $189,000 Active 131 DOM
-
2026-06-15days on market $189,000 Active 130 DOM
-
2026-06-13days on market $189,000 Active 129 DOM
-
2026-06-12days on market $189,000 Active 128 DOM
-
2026-06-09days on market $189,000 Active 125 DOM
-
2026-06-08days on market $189,000 Active 124 DOM
-
2026-06-08days on market $189,000 Active 123 DOM
-
2026-06-07days on market $189,000 Active 122 DOM
-
2026-06-03days on market $189,000 Active 119 DOM
-
2026-06-02days on market $189,000 Active 118 DOM
-
2026-06-01days on market $189,000 Active 117 DOM
-
2026-05-31days on market $189,000 Active 116 DOM
-
2026-04-11price $195,000
-
2026-02-04$199,000 Active
-
2025-07-17price $199,999
-
2025-02-28price $225,000
-
2002-10-01soldstatus $28,500 186-char remark
Show marketing remark (186 chars)
2 1/2 story home w/ propane and electric lights. Some trim and wall work needed. TLC and you'll have a nice home on a lottle over 7acres. Bank owned. Submit offers. Call L. A. for combo.
-
2002-09-06historical
-
2002-08-20$28,500 186-char remark
Show marketing remark (186 chars)
2 1/2 story home w/ propane and electric lights. Some trim and wall work needed. TLC and you'll have a nice home on a lottle over 7acres. Bank owned. Submit offers. Call L. A. for combo.
-
2002-03-06$54,900
ⓘ Source: listings_history table (triggers on properties + properties_extension) + one-shot
backfill from property_details.listing_events for pre-trigger history.
Tax reassessment forecast WA · Resets to sale price
- Current annual tax
- $894 · $74/mo
- Projected year-2 tax
- $1,852 · $154/mo
- Expected delta
- +$958/yr (+$80/mo · 107.2%)
ⓘ Screening estimate from a state-policy table — verify with the county assessor before closing.
Climate risk First Street
- Flood 1/10 Low FEMA zone X (unshaded) · 0% chance over 30 yrs
- Wildfire 9/10 Extreme
- Heat 1/10 Low 7 d/yr ≥89°F today · 15 d/yr by 30 yrs out
- Wind 1/10 Low
- Air quality 9/10 Extreme 17 unhealthy d/yr today · 22 by 30 yrs out
Nearby sold comps map
Loading sold comps map…
Walkable amenities ~0.75 mi
Loading nearby amenities…
Taxation est. · year 1
- Rental income
- $16,435
- − Mortgage interest
- −$10,587
- − Property taxes
- −$894
- − Insurance
- −$945
- − Repairs & maintenance
- −$1,315
- − Management
- −$1,315
- − Depreciation
- −$5,498
- Taxable loss
- −$4,118
- Est. tax savings @ 24.0%
- +$988
- After-tax cash flow
- $240/yr
For passive investors: Depreciation is non-cash, so a rental often shows a tax loss while cash-flowing — sheltering income. Rental losses are passive: they offset passive income freely, and up to $25,000/yr can offset ordinary (W-2) income if you actively participate and your MAGI is under $100k (phasing out to $0 by $150k); unused losses carry forward. On sale, claimed depreciation is recaptured at up to 25%, and gains may owe capital-gains tax (a 1031 exchange can defer both). Figures are a year-1 estimate at your 24.0% rate — not tax advice; consult a CPA.
Schools (NCES district)
- District
- Republic School District
- NCES district ID
- 5307260
- Math proficiency
- 40% ▲ 5.00%
- Reading proficiency
- 50% ▬ 0.00%
- Median HH income
- $38,081
- Composite
- 39.7/100
- National rank
- #8019
- State rank
- #193 of 291 in WA
Livability — Curlew Lake
- Score
- 58/100
- State rank
- #512
- US rank
- #21090
Category grades
Schools grade is shown separately in the Schools card above.
Census & demographics
- Population (ZIP)
- 2,879
Population outlook (Ferry County) Hauer SSP2
- Today (2025)
- 7,408 people
- By 2030
- 7,210 · -2.7%
- By 2040
- 6,714 · -9.4%
- By 2050
- 6,331 · -14.5%
- By 2075
- 5,599 · -24.4%
- By 2100
- 5,057 · -31.7%
Race, ethnicity, and origin ACS 2023
- Neighborhood character
- Predominantly White (86%)
- Race & ethnicity
- White 86% Two or more races 8% Hispanic / Latino 4% Native American 2% Pacific Islander 1%
- Common ancestry
- Italian 5% Lithuanian 4% Portuguese 4%
- Foreign-born
- 2% · Canada
- Languages at home
- 95% English-only · Spanish 2% French/Haitian/Cajun 1% Other Asian/Pacific 1%
Political lean MEDSL · Ferry
- 2024 margin
- Solid R (+33.0) · D 32.1% · R 65.1% · Other 2.8%
- 2008→2024 swing
- -20.2pp toward R · 2008: -12.8pp · 2024: -33.0pp
- All cycles
- 2024: R+33.0 2020: R+29.4 2016: R+30.5 2012: R+20.4 2008: R+12.8
Not yet ingested
- Civics
- —
Market trends
- HPI YoY
- ▲ 3.45%
- Current HPI
- 170.5617
- Rent YoY
- —
- Metro
- —
- State GDP YoY
- ▲ 4.65%
- F500 in state
- 22
Industry mix (Fortune 500 HQ in WA)
| Industry | F500 HQs | Revenue |
|---|---|---|
| Retail | 2 | $269B |
|
||
| Technology / Retail | 1 | $638B |
|
||
| Technology | 1 | $245B |
|
||
| Telecommunications | 1 | $38B |
|
||
| Food / Beverage | 1 | $36B |
|
||
| Automotive / Trucks | 1 | $34B |
|
||
Price history
+255.2% since first listed8 events — show timeline
- 2026-04-11 Price Changed $195,000 NWMLS as Distributed by MLS Grid
- 2026-02-04 Listed $199,000 NWMLS as Distributed by MLS Grid
- 2025-07-17 Price Changed $199,999 NEWMLS
- 2025-02-28 Price Changed $225,000 NEWMLS
- 2002-10-01 Sold (MLS) $28,500 NEWMLS
- 2002-09-06 Listing Removed — SPOKANEMLS as Distributed by MLS Grid
- 2002-08-20 Listed $28,500 NEWMLS
- 2002-03-06 Listed $54,900 SPOKANEMLS as Distributed by MLS Grid
Property tax history
+3.2%/yrLatest (2026): $894 · -0.5% YoY. Source: county tax records.
Cash-flow waterfall
monthlySold comps — $/sqft
last 12 mo · ≤1 miLoading sold comps…