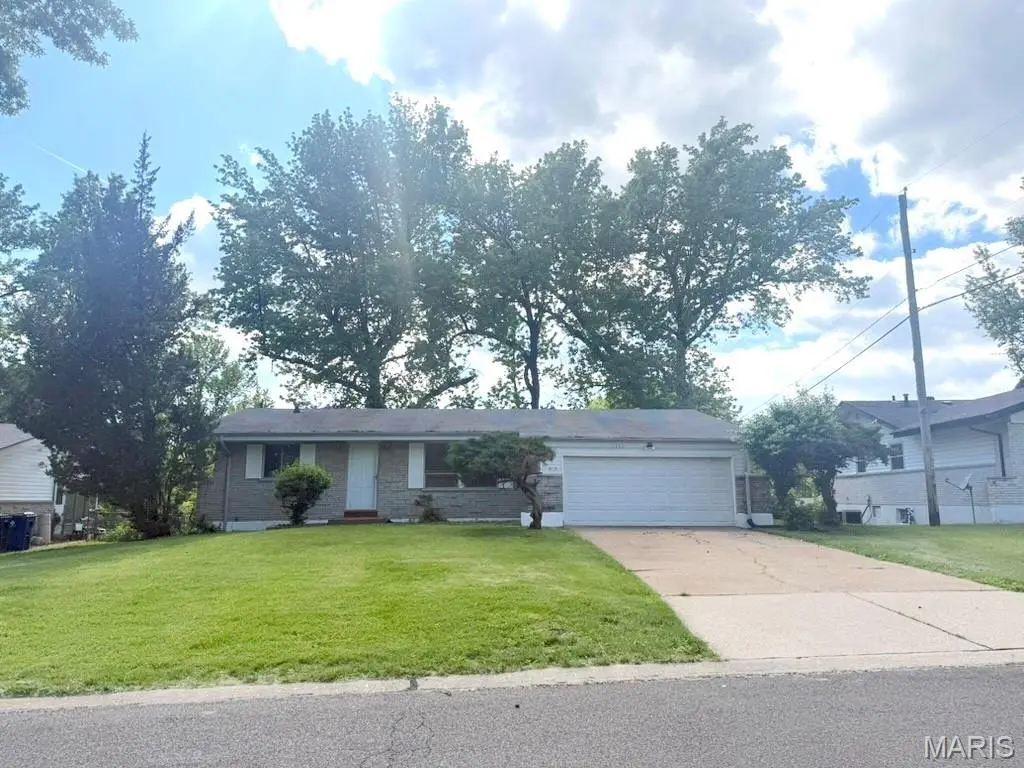
11165 Prentice Dr · Black Jack, MO
Flood risk 1/10 · Minimal
- FEMA flood zone
- X (unshaded)
- Chance of flooding over 30 yrs
- 0.0%
- Est. flood insurance / yr
- $473 – $860
Fire risk 1/10 · Minimal
- Est. fire insurance / yr
- $1,054 – $1,958
Heat risk 5/10 · Moderate
- Hot days now (above 106°F)
- 7 days/yr
- Hot days in 30 yrs
- 21 days/yr
Wind risk 2/10 · Minimal
- Chance of severe wind over 30 yrs
- 1.0%
Air-quality risk 3/10 · Minor
- Unhealthy air days now
- 3 days/yr
- Unhealthy air days in 30 yrs
- 5 days/yr
Risk factors via First Street. Map © Google.
Why this score? — see what drove the C- grade
The composite is a weighted blend of 9 inputs, each scored 0–100. Each bar is that input's sub-score; the figure is the points it added to the 100-point composite (weight × sub-score).
- Cash flow +16.2/30.0
- ARV discount +9.9/15.0
- Appreciation +6.9/10.0
- DSCR +5.0/10.0
- 1% rule +4.1/10.0
- Rent growth +3.7/5.0
- Livability +3.5/5.0
- Condition / age +2.5/5.0
- Schools +1.7/10.0
$162,000
🖨 Deal sheet 📄 Offer letter ✓ Due diligence
Listing remarks
Discover a truly inviting home at 11165 Prentice DR. This single-family residence is ready for you to move in and begin your next chapter, offering a comfortable and stylish living experience. This ranch-style home features three well-proportioned bedrooms, providing ample private space for relaxation and rejuvenation. The property offers convenience and comfort for residents and guests alike. An attached garage provides secure parking and additional storage solutions. This property offers a harmonious blend of classic charm and modern convenience, ready to welcome you home.
Key facts
- 8,319 sq ft lot
- 2 garage spots
- Built 1960
Property features AI
Finance
- HOA & community: Hathaway Manor North HOA with annual fee of $75 (includes snow removal); Association management
Exterior
- Parking: Attached garage; 2 garage spaces; Driveway and off-street parking; Garage faces front
- Utilities: Public water; Public sewer; Electric service by Ameren; Cable available
- Home design: Single-family residence; One level
- Construction: Brick veneer and stone veneer with frame construction; Asphalt roof; Has basement (full, partially finished)
- Exterior features: Back yard; Chain link fence; Some trees nearby; Near public transit
Interior
- Kitchen: Electric range; Self-cleaning oven; Microwave; Dishwasher; Refrigerator; Breakfast room adjacent to kitchen
- Bedrooms: 3 bedrooms on the main level
- Bathrooms: 1 full bathroom; 2 half bathrooms (one on main level, one on lower level)
- Heating & cooling: Forced air heating; Central air conditioning
- Interior features: Partially finished basement with walk-out access; Basement includes full bath and concrete construction with 8+ ft pour; Plumbed for ice maker
- Laundry & utility: Washer and dryer included; Gas water heater
Neighborhood map
What this means for you Summary
Snapshot
- This is a 3-bed/1.5-bath single-family listed at $162k.
Deal economics
- At list price, monthly cash flow is $86 ($1k/yr) — positive.
- The deal already cash-flows at list — no discount required.
- To meet the 1% rule (rent ≥ 1% of price), the offer needs to be $147k (9.1% below list).
- Recommended offer: $147k (9.1% below list) — sets the bar for 1% rule.
Location & tenants
- Location reads 70/100 on livability (#132 in MO) — a middle-class / working-renter tenant base. Strengths: cost of living A+, housing A+; Watch: health & safety C-, crime D+, amenities F.
- Hazelwood (suburban): math 11% / reading 26% proficiency, ranked #306 of 324 in MO (top 94%) — low school quality limits family demand, transient renter base, plan for 1-2y turnover.
- Zoned schools: Keeven Elem. (math 2% / reading 17%, grade F, #1,037 of 1,115 statewide, top 94%, 267 students, 99% FRL); Hazelwood East High (math 5% / reading 21%, grade F, #495 of 521 statewide, top 95%, 1,264 students, 66% FRL) — zoned schools average 82% FRL vs 53% district-wide (29 pts higher); higher-poverty schools than district average — tighter screening recommended.
- Market conditions: Rents rising fast (+5.0%/yr); 372 active listings in the ZIP; 24 comparable units currently listed for rent nearby; rentals at typical pace (median 22d on market — plan ~3-4 weeks tenant-placement turnaround); lower-income renter base — watch delinquency; 920 units permitted in St. Louis County in 2024 (250 in 5+ unit buildings).
- This rent runs 43% of the median local income ($41k/yr) — at the standard rent-burdened threshold; future hikes will face affordability resistance.
Forward outlook
- In year one you build about $7k of equity ($1k loan paydown + $6k appreciation (3.8% local appreciation)).
- At projected returns (3.8% appreciation + 5.0% rent growth), your $45k cash investment doubles in ~5 years — after that, you're playing with house money.
- By year 5, paydown + projected appreciation supports a ~$31k cash-out refi (75% LTV) — recoverable capital for the next deal without selling this one.
Negotiation context
- It's been on market 39 days — a 3% lower offer ($157k) is reasonable based on typical stale-listing flexibility.
- Current owner paid $99k; list at $162k implies a 64% gain — meaningful room to come down on a strong offer.
Risks & watch-outs
- Climate carrying-cost: extreme-heat days projected 7→21/yr by 2055 (HVAC capex compounding) — expect insurance premiums to compound above CPI over the hold.
Questions for the listing agent
- It's been on market 39 days. Have you received any prior offers? Is the seller open to a 9% concession, seller financing, or rate buy-down credit?
- Built in 1960 — when were the roof, HVAC, electrical panel, plumbing, and water heater last replaced?
- What does the HOA fee cover, when was the last increase, and are there any pending special assessments or reserve-fund shortfalls?
- Is there a deadline driving the sale (1031 exchange, divorce, estate, relocation)? That informs how much negotiation room exists.
- Crime grade is D in this area — have there been break-ins, vandalism, or insurance claims at this property in the last 3 years? What carrier currently insures it and at what premium?
- What's the average days-on-market for RENTAL listings here right now (not sales)? A rising rental-DOM trend means longer vacancies and softer asking-rent achievability than the comps imply.
- What's the recent tenant-quality profile in this submarket — average credit score on applications, eviction rate, late-payment / NSF rate, and stable-employment percentage? A property-management company in the area should have these aggregated.
- How much new for-sale + rental construction is in the pipeline within 1–3 miles? Heavy new supply typically softens prices + rents 12–24 months out; constrained supply supports both.
Investment metrics
- 1% rule
- 0.91% ✗
- Cap rate
- 6.93%
- Cash-on-cash
- 2.28%
- DSCR
- 1.10
- GRM
- 9.2
CMA / ARV
- ARV (median comp)
- $171,207
- List price
- $162,000
- Delta
- -5.38%
- Verdict
- FAIR
- Comps
- 20 within 1.0 mi
Show comp detail 12 sales within ~0.75 mi
| Address | Dist | Beds/Ba | Sqft | Sold | Price | $/sf | Match |
|---|---|---|---|---|---|---|---|
| 2515 Linnell Dr | 0.18mi | 2/2.0 (-1) | 1,082 (-0%) | 1mo | $109,900 | $102 | 83 |
| 2628 Hadden Dr | 0.19mi | 3/1.5 | 1,052 (-3%) | 8mo | $189,900 | $181 | 80 |
| 11100 Landseer Dr | 0.20mi | 3/2.0 | 1,116 (+3%) | 6mo | $187,000 | $168 | 78 |
| 4895 Lockwig Trl | 0.28mi | 3/2.0 | 1,092 (+1%) | 10mo | $124,900 | $114 | 76 |
| 2505 Netherton Dr | 0.29mi | 3/1.5 | 1,064 (-2%) | 12mo | $168,000 | $158 | 73 |
| 2633 Hadden Dr | 0.18mi | 3/3.0 | 1,164 (+7%) | 7mo | $120,000 | $103 | 67 |
| 4950 Patricia Ridge Dr | 0.57mi | 3/1.5 | 1,124 (+4%) | 4mo | $177,500 | $158 | 64 |
| 4401 Rhine Dr | 0.73mi | 3/2.0 | 1,080 (-0%) | 7mo | $169,900 | $157 | 58 |
| 11129 Old Halls Ferry Rd | 0.35mi | 3/1.0 | 1,216 (+12%) | 6mo | $75,000 | $62 | 56 |
| 5372 Priorybrook Rd | 0.52mi | 3/2.0 | 1,158 (+7%) | 10mo | $199,900 | $173 | 54 |
| 11625 Latonka Trl | 0.54mi | 3/2.0 | 1,162 (+7%) | 12mo | $179,500 | $154 | 51 |
| 2252 Luxmore Dr | 0.64mi | 3/1.5 | 986 (-9%) | 6mo | $59,000 | $60 | 50 |
Match score weights: distance 35% · size 25% · config 20% · recency 20%. Top-matched comps best support the ARV.
Projected returns pro-forma
3.79% appreciation · 4.97% rent growth · sell at horizon
- IRR
- 12.7%
- Equity multiple
- 1.77×
- Total profit
- $34,842
- Equity at exit
- $80,156
- IRR
- 15.1%
- Equity multiple
- 3.49×
- Total profit
- $112,867
- Equity at exit
- $129,545
Cash invested: $45,360 (down + closing). Projections, not guarantees.
Landlord ↔ Tenant lean methodology
- Overall (STATE)
- 81 Strongly Landlord-Friendly
- State Missouri
- 81 Strongly Landlord-Friendly · R+10
- County
- — inherits STATE
- City
- — inherits STATE
ZIP-level market 63136
- Home prices YoY
- 0.9%
- Rents YoY
- 5.0%
- Active inventory
- 372
- Price-to-rent
- 9.2×
Monthly cashflow live
- Estimated rent
- $1,473 high interval (Pro) →
- Mortgage (P&I)
- −$850
- Tax from tax record
- −$155 /mo · $1,857/yr
- Insurance
- −$68
- HOA
- −$6
- Vacancy / Maint / Mgmt
- −$309
- Net cashflow
- $86
Break-even live
UW: 25.0% down · 7.5% · 30yr · 1.5% tax · 5.0% vac · 8.0% maint · 8.0% mgmt
Financing live
Cash to close
- Down payment
- $40,500
- Closing costs
- $4,860
- Reserves months
- —
- Total cash needed
- —
Loan-product check · same deal, 3 products live
Conventional
25% down · 7.5% · 30yr
- Down + closing
- —
- Monthly P&I
- —
- Monthly cashflow
- —
- DSCR
- —
- Eligible?
- —
Personal DTI + credit; lowest rate.
DSCR
20% down · 8.5% · 30yr
- Down + closing
- —
- Monthly P&I
- —
- Monthly cashflow
- —
- DSCR
- —
- Eligible?
- —
No personal income docs; deal must DSCR.
Hard money
10% down · 12.0% · 12mo
- Down + closing
- —
- Monthly P&I
- —
- Monthly cashflow
- —
- DSCR
- —
- Eligible?
- —
Short-term bridge; refi at stabilization.
Rent comps 24 comps
| Address | Beds | Baths | Sqft | Rent | $/sqft | DOM | Units | Dist |
|---|---|---|---|---|---|---|---|---|
| 2544 Netherton Dr Saint Louis, MO | 3.0 | 2.0 | 1288 | $1,945 | $1.51 | 2d | 1 | 0.25mi |
| 2745 Rottingdean Dr St. Louis, MO | 1.0–2.0 | 1.0 | 825 | $975 | $1.18 | 44d | 1 | 0.41mi |
| 11470 Latonka Trl Florissant, MO | 1.0–2.0 | 1.0 | 843 | $1,050 | $1.25 | 44d | 3 | 0.47mi |
| 2257 Luxmore Dr Saint Louis, MO | 3.0 | 3.0 | 1073 | $1,495 | $1.39 | 24d | 1 | 0.62mi |
| 11635 Hazeloak Dr Black Jack, MO | 3.0 | 2.0 | 1124 | $1,728 | $1.54 | 17d | 1 | 0.64mi |
| 4872 Bristol Rock Rd Black Jack, MO | 4.0 | 2.0 | 1448 | $2,061 | $1.42 | 2d | 1 | 0.79mi |
| 2259 Ainsworth Dr Saint Louis, MO | 4.0 | 2.0 | 1500 | $1,776 | $1.18 | 44d | 1 | 0.81mi |
| 11321 Amboy Ln Saint Louis, MO | 3.0 | 3.0 | 1182 | $1,756 | $1.49 | 2d | 1 | 0.93mi |
| 13061 Lord Dr St. Louis, MO | 2.0 | 1.0 | 900 | $1,040 | $1.16 | 22d | 1 | 1.15mi |
| 10504 Baron Dr Saint Louis, MO | 3.0 | 1.0 | 1000 | $1,300 | $1.30 | 7d | 1 | 1.21mi |
| 10512 Count Dr Saint Louis, MO | 3.0 | 1.0 | 888 | $1,195 | $1.35 | 15d | 1 | 1.22mi |
| 11592 Las Ladera Dr Florissant, MO | 3.0 | 2.0 | 986 | $1,616 | $1.64 | 7d | 1 | 1.22mi |
| 62 Capitol Hill Dr Saint Louis, MO | 3.0 | 2.0 | 1239 | $1,250 | $1.01 | 44d | 1 | 1.26mi |
| 4583 Whisper Lake Dr Black Jack, MO | 1.0–5.0 | 1.0–2.5 | 1225 | $1,156 | $0.94 | 2d | 17 | 1.26mi |
| 10501 Duke Dr Saint Louis, MO | 2.0 | 1.0 | 1140 | $1,090 | $0.96 | 44d | 1 | 1.31mi |
| 10557 Castle Dr Saint Louis, MO | 3.0 | 2.0 | 1023 | $1,300 | $1.27 | 15d | 1 | 1.32mi |
| 10409 Count Dr Saint Louis, MO | 3.0 | 1.0 | 912 | $1,100 | $1.21 | 22d | 1 | 1.35mi |
| 10365 Lord Dr Saint Louis, MO | 3.0 | 1.0 | 864 | $1,075 | $1.24 | 2d | 1 | 1.40mi |
| 10404 Earl Dr Saint Louis, MO | 2.0 | 1.0 | 770 | $1,100 | $1.43 | 4d | 1 | 1.41mi |
| 10322 Monarch Dr Saint Louis, MO | 3.0 | 2.0 | 1073 | $1,728 | $1.61 | 24d | 1 | 1.41mi |
| 10441 Prince Dr Saint Louis, MO | 4.0 | 1.5 | 1380 | $1,380 | $1.00 | 44d | 1 | 1.42mi |
| 10239 Green Valley Dr Saint Louis, MO | 3.0 | 1.0 | 1014 | $1,395 | $1.38 | 24d | 1 | 1.43mi |
| 10421 Prince Dr Saint Louis, MO | 3.0 | 2.0 | 1023 | $1,275 | $1.25 | 24d | 1 | 1.46mi |
| 10304 Bon Oak Dr Saint Louis, MO | 3.0 | 1.5 | 1500 | $1,250 | $0.83 | 44d | 1 | 1.48mi |
HOA detail
- Monthly dues
- $6 · $72/yr
Listing history 22 events
-
2026-06-18days on market $162,000 Active 39 DOM
-
2026-06-17days on market $162,000 Active 38 DOM
-
2026-06-16days on market $162,000 Active 37 DOM
-
2026-06-15days on market $162,000 Active 36 DOM
-
2026-06-13days on market $162,000 Active 34 DOM
-
2026-06-13days on market $162,000 Active 33 DOM
-
2026-06-09days on market $162,000 Active 30 DOM
-
2026-06-08days on market $162,000 Active 29 DOM
-
2026-06-07days on market $162,000 Active 28 DOM
-
2026-06-05days on market $162,000 Active 25 DOM
-
2026-06-03days on market $162,000 Active 24 DOM
-
2026-06-02days on market $162,000 Active 23 DOM
-
2026-06-01days on market $162,000 Active 22 DOM
-
2026-05-31days on market $162,000 Active 21 DOM
-
2026-05-18price $162,000 582-char remark
-
2026-05-10$172,500 Active 582-char remark
-
2004-09-13soldstatus $99,000
-
1999-01-13soldstatus $83,500
-
1999-01-13soldstatus $83,500
-
1997-12-12soldstatus $35,000
-
1997-12-12soldstatus $35,000
-
1994-10-31soldstatus
ⓘ Source: listings_history table (triggers on properties + properties_extension) + one-shot
backfill from property_details.listing_events for pre-trigger history.
Tax reassessment forecast MO · Resets to sale price
- Current annual tax
- $1,857 · $155/mo
- Projected year-2 tax
- $1,857 · $155/mo
- Expected delta
- $0/yr ($0/mo · 0.0%)
ⓘ Screening estimate from a state-policy table — verify with the county assessor before closing.
Climate risk First Street
- Flood 1/10 Low FEMA zone X (unshaded) · 0% chance over 30 yrs
- Wildfire 1/10 Low
- Heat 5/10 Major 7 d/yr ≥106°F today · 21 d/yr by 30 yrs out
- Wind 2/10 Low 100% chance of damaging wind over 30 yrs
- Air quality 3/10 Moderate 3 unhealthy d/yr today · 5 by 30 yrs out
Nearby sold comps map
Loading sold comps map…
Walkable amenities ~0.75 mi
Loading nearby amenities…
Taxation est. · year 1
- Rental income
- $17,679
- − Mortgage interest
- −$9,075
- − Property taxes
- −$1,857
- − Insurance
- −$810
- − Repairs & maintenance
- −$1,414
- − Management
- −$1,414
- − HOA
- −$72
- − Depreciation
- −$4,713
- Taxable loss
- −$1,677
- Est. tax savings @ 24.0%
- +$402
- After-tax cash flow
- $1,435/yr
For passive investors: Depreciation is non-cash, so a rental often shows a tax loss while cash-flowing — sheltering income. Rental losses are passive: they offset passive income freely, and up to $25,000/yr can offset ordinary (W-2) income if you actively participate and your MAGI is under $100k (phasing out to $0 by $150k); unused losses carry forward. On sale, claimed depreciation is recaptured at up to 25%, and gains may owe capital-gains tax (a 1031 exchange can defer both). Figures are a year-1 estimate at your 24.0% rate — not tax advice; consult a CPA.
Schools (NCES district)
- District
- Hazelwood
- NCES district ID
- 2913830
- Math proficiency
- 11% ▼ -13.00%
- Reading proficiency
- 26% ▼ -6.00%
- Median HH income
- $51,621
- Composite
- 16.77/100
- National rank
- #9156
- State rank
- #306 of 324 in MO
Livability — Black Jack
- Score
- 70/100
- State rank
- #132
- US rank
- #7706
Category grades
Schools grade is shown separately in the Schools card above.
Census & demographics
- County
- Saint Louis County · 888,823 people
- City population
- 42,258
- Metro
- St. Louis, MO-IL
- Population (ZIP)
- 40,929
- Household income
- $41,154
- Rent vs Own
- Severe rent burden
- 3085.0
Population outlook (St. Louis County) Hauer SSP2
- Today (2025)
- 1,025,227 people
- By 2030
- 1,028,023 · +0.3%
- By 2040
- 1,020,940 · -0.4%
- By 2050
- 1,007,280 · -1.8%
- By 2075
- 987,277 · -3.7%
- By 2100
- 921,984 · -10.1%
Race, ethnicity, and origin ACS 2023
- Neighborhood character
- Predominantly Black (90%)
- Race & ethnicity
- Black 90% White 5% Two or more races 3%
- Foreign-born
- 1% · Canada
Political lean MEDSL · St. Louis
- 2024 margin
- Strong D (+23.4) · D 60.8% · R 37.4% · Other 1.7%
- 2008→2024 swing
- +3.5pp toward D · 2008: 19.9pp · 2024: 23.4pp
- All cycles
- 2024: D+23.4 2020: D+24.0 2016: D+16.2 2012: D+13.7 2008: D+19.9
Not yet ingested
- Civics
- —
Market trends
- HPI YoY
- ▲ 3.79%
- Current HPI
- 420.28
- Rent YoY
- ▲ 4.97%
- Metro
- St. Louis, MO-IL
- State GDP YoY
- ▲ 1.84%
- F500 in state
- 20
Industry mix (Fortune 500 HQ in MO)
| Industry | F500 HQs | Revenue |
|---|---|---|
| Healthcare | 1 | $163B |
|
||
| Insurance | 1 | $21B |
|
||
| Industrial Technology | 1 | $17B |
|
||
| Retail | 1 | $16B |
|
||
| Industrial Distribution | 1 | $10B |
|
||
| Utilities | 1 | $9B |
|
||
Price history
+362.9% since first listed8 events — show timeline
- 2026-05-18 Price Changed $162,000 MARIS as Distributed by MLS Grid
- 2026-05-10 Listed $172,500 MARIS as Distributed by MLS Grid
- 2004-09-13 Sold (Public Records) $99,000 Public Records
- 1999-01-13 Sold (Public Records) $83,500 Public Records
- 1999-01-13 Sold (Public Records) $83,500 Public Records
- 1997-12-12 Sold (Public Records) $35,000 Public Records
- 1997-12-12 Sold (Public Records) $35,000 Public Records
- 1994-10-31 Sold (Public Records) — Public Records
Property tax history
+1.7%/yrLatest (2022): $1,857 · +5.6% YoY. Source: county tax records.
Cash-flow waterfall
monthlySold comps — $/sqft
last 12 mo · ≤1 miLoading sold comps…