14837 N Park Dr · Utica, MI
Flood risk 7/10 · Major
- FEMA flood zone
- X (unshaded)
- Chance of flooding over 30 yrs
- 0.76%
- Est. flood insurance / yr
- $473 – $860
Fire risk 1/10 · Minimal
- Est. fire insurance / yr
- $784 – $1,456
Heat risk 3/10 · Minor
- Hot days now (above 97°F)
- 7 days/yr
- Hot days in 30 yrs
- 15 days/yr
Wind risk 1/10 · Minimal
- Chance of severe wind over 30 yrs
- —
Air-quality risk 3/10 · Minor
- Unhealthy air days now
- 3 days/yr
- Unhealthy air days in 30 yrs
- 3 days/yr
Risk factors via First Street. Map © Google.
Why this score? — see what drove the D- grade
The composite is a weighted blend of 9 inputs, each scored 0–100. Each bar is that input's sub-score; the figure is the points it added to the 100-point composite (weight × sub-score).
- Cash flow +11.9/30.0
- ARV discount +7.5/15.0
- 1% rule +4.1/10.0
- Schools +4.1/10.0
- Livability +3.9/5.0
- DSCR +3.5/10.0
- Rent growth +2.5/5.0
- Condition / age +2.2/5.0
- Appreciation +0.0/10.0
$440,000
🖨 Deal sheet 📄 Offer letter ✓ Due diligence
Listing remarks MLS
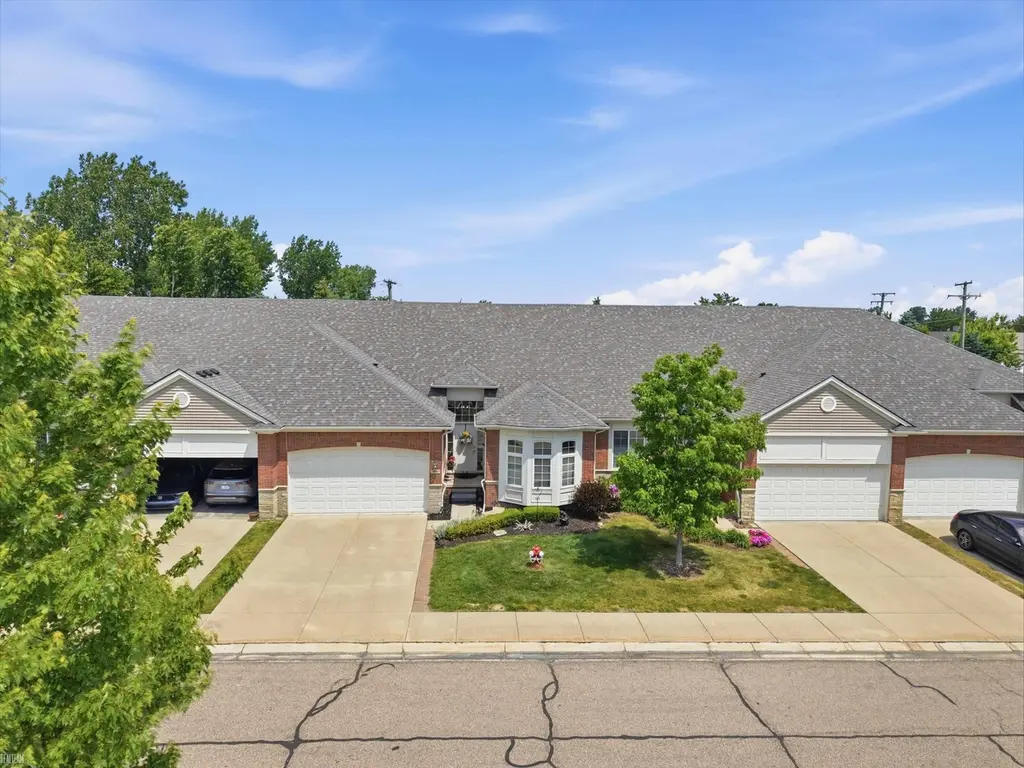
* * OPEN HOUSE 6/13 FROM 12PM-2PM. * * Enjoy the perfect blend of comfort, convenience, and style in this spacious 3 bedroom, 3 bath condo in Shelby Township! Built in 2014, this home combines modern conveniences with low-maintenance condo living. The main level features two bedrooms, including a spacious primary suite, along with two full bathrooms for added convenience. The open-concept living area provides an inviting atmosphere for gathering with family and friends. Upstairs, you'll find a private third bedroom and full bathroom, making it an ideal retreat for guests, extended family, or a home office setup. The finished basement expands the living space and is perfect for entertaining, featuring a bar area and plenty of room for hosting game days, movie nights, or family gatherings. The basement also features a bedroom. Conveniently located near shopping, dining, parks, and major roadways, this condo offers the perfect combination of space, comfort, and convenience.
Key facts
- Finished basement
- Bar area
- Two full bathrooms
Tags
Property features AI
Finance
- Other: Pets allowed: contact association
- Financial info: Financial details beyond HOA not provided
- HOA & community: Homeowners association with a $230 monthly fee; HOA covers grounds maintenance, structure maintenance, trash, and water
Exterior
- Parking: Attached, covered garage; Two garage spaces; Paved and assigned parking
- Security: Security details not provided
- Utilities: Public water; Public sewer
- Home design: Condominium; Two levels; Residential property
- Construction: Brick construction
- Exterior features: Deck; Porch; Paved road access; No pool
Interior
- Kitchen: Bar fridge; Dishwasher; Microwave; Oven; Range; Refrigerator
- Bedrooms: Bedrooms not specifically listed
- Flooring: Flooring details not provided
- Bathrooms: Three full bathrooms
- Heating & cooling: Forced air heating (natural gas); Central air conditioning; Ceiling fans
- Interior features: Eat-in kitchen; Wet bar; Walk-in closets; Finished basement with concrete construction; Fireplace in the living room; Seven total rooms
- Laundry & utility: Washer; Dryer
Neighborhood map
What this means for you Summary
Snapshot
- This is a 3-bed/3.0-bath condo listed at $440k. Condition is rated fair.
Deal economics
- At list price, monthly cash flow is $-166 ($-2k/yr) — negative.
- To cash-flow at today's rent, offer at most $416k (5.5% below list).
- To meet the 1% rule (rent ≥ 1% of price), the offer needs to be $400k (9.1% below list).
- Recommended offer: $400k (9.1% below list) — sets the bar for 1% rule.
- Cap rate 6.0% vs local median 3.6% in Utica — top-decile yield for the area; either an underpriced asset or a hidden risk that comps aren't pricing in. Stress-test before assuming the spread holds.
Location & tenants
- Location reads 78/100 on livability (#106 in MI, #2,586 nationally) — a middle-class / working-renter tenant base. Strengths: commute A+, cost of living A+, housing A+; Watch: crime D+, health & safety D+, employment D.
- Utica Community Schools (suburban): math 38% / reading 53% proficiency, ranked #126 of 540 in MI (top 23%) — families likely to look elsewhere, expect single-tenant / working-renter base with shorter leases.
- Market conditions: 230 active listings in the ZIP; 1 comparable units currently listed for rent nearby; 1,321 units permitted in Macomb County in 2024 (86 in 5+ unit buildings).
Forward outlook
- Local home prices are declining (-3.0%/yr); year-one equity from $3k of loan paydown is wiped out by about $13k of value loss. Plan a longer hold.
- Macomb County population projected at +9% by 2050 — modest demand growth; plan on rents tracking national, not racing it.
Negotiation context
- Only 5 days on market — expect competitive offers; lowballing is unlikely to land.
- 2 sale attempts with the ask held roughly flat each time — persistent listings suggest the price (not the market) is what's stuck; bring a comps-based counter.
Risks & watch-outs
- Watch-outs: flood insurance adds $56/mo.
- Climate carrying-cost: major flood risk — expect insurance premiums to compound above CPI over the hold.
Questions for the listing agent
- What do current leases actually rent for vs. the listed asking? Can we see a recent rent roll and the last 12 months of T-12 income?
- Have any recent inspections been done? Can we get a copy of the seller's disclosures and any deferred-maintenance estimates?
- What's the actual annual flood-insurance premium (NFIP or private), and is the property in a SFHA with mandatory coverage?
- What does the HOA fee cover, when was the last increase, and are there any pending special assessments or reserve-fund shortfalls?
- Any open or pending special assessments — roof, HVAC, plumbing, elevator, façade? What's the per-unit balance and payoff schedule, and is the seller paying it off at close or rolling it to the buyer?
- Is there a deadline driving the sale (1031 exchange, divorce, estate, relocation)? That informs how much negotiation room exists.
- Crime grade is D in this area — have there been break-ins, vandalism, or insurance claims at this property in the last 3 years? What carrier currently insures it and at what premium?
- The area grade is low — what's the realistic commute time and amenity access for the typical tenant pool here? Any planned neighborhood developments (good or bad) we should know about?
- What's the average days-on-market for RENTAL listings here right now (not sales)? A rising rental-DOM trend means longer vacancies and softer asking-rent achievability than the comps imply.
- What's the recent tenant-quality profile in this submarket — average credit score on applications, eviction rate, late-payment / NSF rate, and stable-employment percentage? A property-management company in the area should have these aggregated.
- How much new apartment / multifamily construction is in the pipeline within 1–3 miles? Heavy new supply (>2% of stock underway) typically softens rents 12–24 months out; light construction supports rent growth.
Investment metrics
- 1% rule
- 0.91% ✗
- Cap rate
- 5.99%
- Cash-on-cash
- -1.08%
- DSCR
- 0.95
- GRM
- 9.2
CMA / ARV
No comps found within radius.
Projected returns pro-forma
-3.0% appreciation · 3.0% rent growth · sell at horizon
- IRR
- -18.9%
- Equity multiple
- 0.34×
- Total profit
- $-81,654
- Equity at exit
- $65,605
- IRR
- -11.3%
- Equity multiple
- 0.32×
- Total profit
- $-83,782
- Equity at exit
- $38,043
Cash invested: $123,200 (down + closing). Projections, not guarantees.
Landlord ↔ Tenant lean methodology
- Overall (STATE)
- 62 Landlord-Friendly
- State Michigan
- 62 Landlord-Friendly · EVEN
- County
- — inherits STATE
- City
- — inherits STATE
ZIP-level market 48315
- Active inventory
- 230
- Price-to-rent
- 9.2×
Monthly cashflow live
- Estimated rent
- $4,000 medium interval (Pro) →
- Mortgage (P&I)
- −$2,307
- Tax est. 1.5%
- −$550 /mo · $6,600/yr
- Insurance
- −$183
- Flood insurance flood zone
- −$56 /mo · $666/yr
- HOA
- −$230
- Vacancy / Maint / Mgmt
- −$840
- Net cashflow
- $-166
Break-even live
UW: 25.0% down · 7.5% · 30yr · 1.5% tax · 5.0% vac · 8.0% maint · 8.0% mgmt
Financing live
Cash to close
- Down payment
- $110,000
- Closing costs
- $13,200
- Reserves months
- —
- Total cash needed
- —
Loan-product check · same deal, 3 products live
Conventional
25% down · 7.5% · 30yr
- Down + closing
- —
- Monthly P&I
- —
- Monthly cashflow
- —
- DSCR
- —
- Eligible?
- —
Personal DTI + credit; lowest rate.
DSCR
20% down · 8.5% · 30yr
- Down + closing
- —
- Monthly P&I
- —
- Monthly cashflow
- —
- DSCR
- —
- Eligible?
- —
No personal income docs; deal must DSCR.
Hard money
10% down · 12.0% · 12mo
- Down + closing
- —
- Monthly P&I
- —
- Monthly cashflow
- —
- DSCR
- —
- Eligible?
- —
Short-term bridge; refi at stabilization.
Rent comps 1 comps
| Address | Beds | Baths | Sqft | Rent | $/sqft | DOM | Units | Dist |
|---|---|---|---|---|---|---|---|---|
| 13697 Silent Woods Dr Shelby Township, MI | 3.0 | 4.5 | 4463 | $4,000 | $0.90 | 24d | 1 | 0.90mi |
HOA detail condo
- Monthly dues
- $230 · $2,760/yr
- Assessments
- None detected in remarks — confirm with the listing agent.
Listing history 5 events
-
2026-06-15status $440,000 Pending 5 DOM
-
2026-06-15days on market $440,000 Active 5 DOM
-
2026-06-13days on market $440,000 Active 3 DOM
-
2026-06-13remarks 699-char remark
-
2026-06-13$440,000 Active 2 DOM
ⓘ Source: listings_history table (triggers on properties + properties_extension) + one-shot
backfill from property_details.listing_events for pre-trigger history.
Climate risk First Street
- Flood 7/10 Severe FEMA zone X (unshaded) · 76% chance over 30 yrs
- Wildfire 1/10 Low
- Heat 3/10 Moderate 7 d/yr ≥97°F today · 15 d/yr by 30 yrs out
- Wind 1/10 Low
- Air quality 3/10 Moderate 3 unhealthy d/yr today · 3 by 30 yrs out
Nearby sold comps map
Loading sold comps map…
Walkable amenities ~0.75 mi
Loading nearby amenities…
Taxation est. · year 1
- Rental income
- $48,000
- − Mortgage interest
- −$24,647
- − Property taxes
- −$6,600
- − Insurance
- −$2,866
- − Repairs & maintenance
- −$3,840
- − Management
- −$3,840
- − HOA
- −$2,760
- − Depreciation
- −$12,800
- Taxable loss
- −$9,353
- Est. tax savings @ 24.0%
- +$2,245
- After-tax cash flow
- $249/yr
For passive investors: Depreciation is non-cash, so a rental often shows a tax loss while cash-flowing — sheltering income. Rental losses are passive: they offset passive income freely, and up to $25,000/yr can offset ordinary (W-2) income if you actively participate and your MAGI is under $100k (phasing out to $0 by $150k); unused losses carry forward. On sale, claimed depreciation is recaptured at up to 25%, and gains may owe capital-gains tax (a 1031 exchange can defer both). Figures are a year-1 estimate at your 24.0% rate — not tax advice; consult a CPA.
Condition & rehab AI · 2 photos
The home is in fair condition with good roof and exterior. It needs minor exterior painting and trimming to enhance its curb appeal and value.
Value-add opportunities
- Resale Paint exterior — Enhances curb appeal and home value
- Rental Trim bushes — Improves landscaping and enhances curb appeal
Renovation cost estimate screening
Value-add ROI direction
- Resale Paint exterior — Enhances curb appeal and home value ↑
- Rental Trim bushes — Improves landscaping and enhances curb appeal ↑
ⓘ Cost ranges are severity-bucket heuristics (US national rule-of-thumb). Get contractor quotes + a written scope before underwriting a rehab budget.
Schools (NCES district)
- District
- Utica Community Schools
- NCES district ID
- 2634470
- Math proficiency
- 38% ▼ -13.00%
- Reading proficiency
- 53% ▼ -7.00%
- Median HH income
- $65,953
- Composite
- 40.52/100
- National rank
- #3709
- State rank
- #126 of 540 in MI
Livability — Utica
- Score
- 78/100
- State rank
- #106
- US rank
- #2586
Category grades
Schools grade is shown separately in the Schools card above.
Census & demographics
- Population (ZIP)
- 28,428
Population outlook (Macomb County) Hauer SSP2
- Today (2025)
- 925,296 people
- By 2030
- 948,226 · +2.5%
- By 2040
- 983,961 · +6.3%
- By 2050
- 1,010,200 · +9.2%
- By 2075
- 1,076,222 · +16.3%
- By 2100
- 1,077,065 · +16.4%
Race, ethnicity, and origin ACS 2023
- Neighborhood character
- Predominantly White (86%)
- Race & ethnicity
- White 86% Two or more races 4% Asian 4% Hispanic / Latino 3% Black 3%
- Common ancestry
- Romanian 11% Lithuanian 4% Italian 2%
- Foreign-born
- 14% · Canada, South Korea, China
- Languages at home
- 81% English-only · Other Indo-European 9% Arabic 4% Spanish 2%
Political lean MEDSL · Macomb
- 2024 margin
- R (+13.7) · D 42.2% · R 55.9% · Other 1.9%
- 2008→2024 swing
- -22.3pp toward R · 2008: 8.6pp · 2024: -13.7pp
- All cycles
- 2024: R+13.7 2020: R+8.1 2016: R+11.6 2012: D+4.0 2008: D+8.6
Not yet ingested
- Civics
- —
Market trends
- HPI YoY
- ▼ -173.36%
- Current HPI
- 194.9368
- Rent YoY
- —
- Metro
- —
- State GDP YoY
- ▲ 1.37%
- F500 in state
- 28
Industry mix (Fortune 500 HQ in MI)
| Industry | F500 HQs | Revenue |
|---|---|---|
| Automotive Parts | 3 | $48B |
|
||
| Automotive | 2 | $372B |
|
||
| Chemicals | 1 | $45B |
|
||
| Automotive Retail | 1 | $29B |
|
||
| Healthcare / Medical Devices | 1 | $23B |
|
||
| Automotive Technology | 1 | $20B |
|
||
Price history
+0.0% since first listed2 events — show timeline
- 2026-06-10 Listed $440,000 REALCOMP
- 2026-06-10 Listed $440,000 MiRealSource-MiMLS
Cash-flow waterfall
monthlySold comps — $/sqft
last 12 mo · ≤1 miLoading sold comps…