1735 Welch Rd · Jeffersonville, KY
Flood risk 1/10 · Minimal
- FEMA flood zone
- X (unshaded)
- Chance of flooding over 30 yrs
- 0.0%
- Est. flood insurance / yr
- $507 – $1,088
Fire risk 7/10 · Major
- Est. fire insurance / yr
- $839 – $1,559
Heat risk 4/10 · Minor
- Hot days now (above 102°F)
- 7 days/yr
- Hot days in 30 yrs
- 19 days/yr
Wind risk 4/10 · Minor
- Chance of severe wind over 30 yrs
- 7.0%
Air-quality risk 1/10 · Minimal
- Unhealthy air days now
- 0 days/yr
- Unhealthy air days in 30 yrs
- 0 days/yr
Risk factors via First Street. Map © Google.
Why this score? — see what drove the B+ grade
The composite is a weighted blend of 9 inputs, each scored 0–100. Each bar is that input's sub-score; the figure is the points it added to the 100-point composite (weight × sub-score).
- Cash flow +30.0/30.0
- DSCR +10.0/10.0
- 1% rule +9.6/10.0
- Appreciation +8.3/10.0
- ARV discount +7.5/15.0
- Livability +3.1/5.0
- Schools +2.8/10.0
- Rent growth +2.5/5.0
- Condition / age +2.5/5.0
$100,000
🖨 Deal sheet 📄 Offer letter ✓ Due diligence
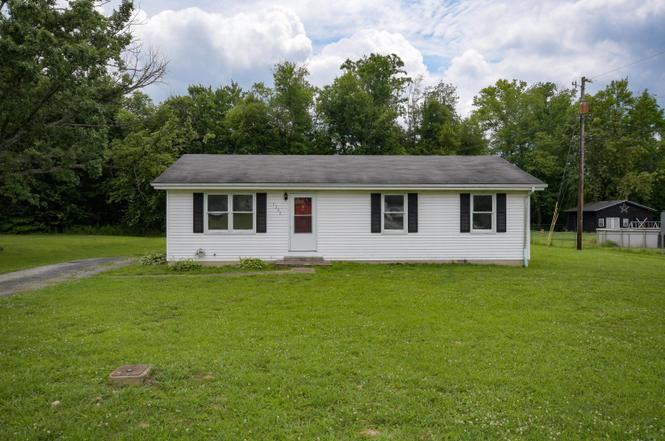
Listing remarks
* * ABSOLUTE AUCTION * * Johnnie C Tabor Estate Beginning 6/20/2026 on DJSAUCTIONSUSA.com and ending with a live onsite simulcast at 12:00 noon on Saturday 7/11/2026 @ 770 Bedford Rd Jeffersonville Ky 40337 Welcome home to this charming and move-in ready ranch nestled on an expansive lot in the heart of Jeffersonville. Offering 3 bedrooms and 1 bathroom and the perfect blend of country living with convenient access to town, this well-maintained home features bright, inviting spaces and a spacious yard with endless possibilities. Step inside to discover durable updated flooring flowing throughout much of the home, creating a warm and cohesive feel. The large living room is filled with nat
Key facts
- Expansive lot
- Oversized yard
- Large living room
Tags
Property features AI
Finance
- Other: Lot about 1.78 acres (public records)
Exterior
- Utilities: Public water; Septic tank
- Home design: House; One story
- Construction: Vinyl siding; Block foundation; Composition/shingle roof; Built area approximately 1,092
- Exterior features: Shed(s); Few trees on the lot
Interior
- Kitchen: Range
- Bedrooms: 7 total rooms (bedrooms not itemized)
- Flooring: Laminate
- Bathrooms: 1 full bathroom
- Heating & cooling: Heat pump heating; Central air conditioning
- Interior features: Insulated windows; Range
- Laundry & utility: Washer hookup; Electric dryer hookup
Neighborhood map
What this means for you Summary
Snapshot
- This is a 3-bed/1.0-bath other listed at $100k.
Deal economics
- At list price, monthly cash flow is $542 ($7k/yr) — positive.
- The deal already cash-flows at list — no discount required.
- Meets the 1% rule at list price ($1k rent vs $100k).
- Cap rate 12.8% vs local median 3.3% in Jeffersonville — top-decile yield for the area; either an underpriced asset or a hidden risk that comps aren't pricing in. Stress-test before assuming the spread holds.
Location & tenants
- Location reads 61/100 on livability (#382 in KY) — a middle-class / working-renter tenant base. Strengths: crime A+, cost of living A+, housing B; Watch: health & safety D+, amenities F, commute F.
- Montgomery County (rural): math 24% / reading 44% proficiency, ranked #76 of 165 in KY (top 46%) — families likely to look elsewhere, expect single-tenant / working-renter base with shorter leases.
- Zoned schools: Camargo Elementary School (math 19% / reading 40%, grade F, #393 of 676 statewide, top 63%, 576 students, 64% FRL); Montgomery County High School (math 29% / reading 39%, grade F, #89 of 254 statewide, top 36%, 1,279 students, 47% FRL) — zoned schools at 56% FRL track the district average.
- Market conditions: 43 active listings in the ZIP; 56 units permitted in Montgomery County in 2024 (0 in 5+ unit buildings).
Forward outlook
- In year one you build about $7k of equity ($691 loan paydown + $7k appreciation (6.7% local appreciation)).
- Montgomery County population projected at +11% by 2050 — modest demand growth; plan on rents tracking national, not racing it.
- At projected returns (6.7% appreciation + 3.0% rent growth), your $28k cash investment doubles in ~2 years — after that, you're playing with house money.
- By year 5, paydown + projected appreciation supports a ~$33k cash-out refi (75% LTV) — recoverable capital for the next deal without selling this one.
Negotiation context
- Only 3 days on market — expect competitive offers; lowballing is unlikely to land.
Risks & watch-outs
- Climate carrying-cost: major wildfire risk — expect insurance premiums to compound above CPI over the hold.
Questions for the listing agent
- Is there a deadline driving the sale (1031 exchange, divorce, estate, relocation)? That informs how much negotiation room exists.
- Schools are F-rated, which usually means shorter tenancies and higher turnover. Who's the typical renter profile here, and what's been the actual vacancy rate?
- What's the average days-on-market for RENTAL listings here right now (not sales)? A rising rental-DOM trend means longer vacancies and softer asking-rent achievability than the comps imply.
- What's the recent tenant-quality profile in this submarket — average credit score on applications, eviction rate, late-payment / NSF rate, and stable-employment percentage? A property-management company in the area should have these aggregated.
- How much new for-sale + rental construction is in the pipeline within 1–3 miles? Heavy new supply typically softens prices + rents 12–24 months out; constrained supply supports both.
Investment metrics
- 1% rule
- 1.46% ✓
- Cap rate
- 12.79%
- Cash-on-cash
- 23.22%
- DSCR
- 2.03
- GRM
- 5.7
CMA / ARV
No comps found within radius.
Projected returns pro-forma
6.7% appreciation · 3.0% rent growth · sell at horizon
- IRR
- 36.1%
- Equity multiple
- 3.41×
- Total profit
- $67,535
- Equity at exit
- $67,316
- IRR
- 33.0%
- Equity multiple
- 7.09×
- Total profit
- $170,650
- Equity at exit
- $126,115
Cash invested: $28,000 (down + closing). Projections, not guarantees.
Landlord ↔ Tenant lean methodology
- Overall (STATE)
- 83 Strongly Landlord-Friendly
- State Kentucky
- 83 Strongly Landlord-Friendly · R+16
- County
- — inherits STATE
- City
- — inherits STATE
ZIP-level market 40337
- Home prices YoY
- 2.9%
- Active inventory
- 43
- Price-to-rent
- 5.7×
Monthly cashflow live
- Estimated rent
- $1,456 medium interval (Pro) →
- Mortgage (P&I)
- −$524
- Tax from tax record
- −$43 /mo · $510/yr
- Insurance
- −$42
- HOA
- −$0
- Vacancy / Maint / Mgmt
- −$306
- Net cashflow
- $542
Break-even live
UW: 25.0% down · 7.5% · 30yr · 1.5% tax · 5.0% vac · 8.0% maint · 8.0% mgmt
Financing live
Cash to close
- Down payment
- $25,000
- Closing costs
- $3,000
- Reserves months
- —
- Total cash needed
- —
Loan-product check · same deal, 3 products live
Conventional
25% down · 7.5% · 30yr
- Down + closing
- —
- Monthly P&I
- —
- Monthly cashflow
- —
- DSCR
- —
- Eligible?
- —
Personal DTI + credit; lowest rate.
DSCR
20% down · 8.5% · 30yr
- Down + closing
- —
- Monthly P&I
- —
- Monthly cashflow
- —
- DSCR
- —
- Eligible?
- —
No personal income docs; deal must DSCR.
Hard money
10% down · 12.0% · 12mo
- Down + closing
- —
- Monthly P&I
- —
- Monthly cashflow
- —
- DSCR
- —
- Eligible?
- —
Short-term bridge; refi at stabilization.
Listing history 4 events
-
2026-06-18days on market $100,000 Active 3 DOM
-
2026-06-17days on market $100,000 Active 2 DOM
-
2026-06-16remarks 699-char remark
-
2026-06-16$100,000 Active 1 DOM
ⓘ Source: listings_history table (triggers on properties + properties_extension) + one-shot
backfill from property_details.listing_events for pre-trigger history.
Tax reassessment forecast KY · Resets to sale price
- Current annual tax
- $510 · $43/mo
- Projected year-2 tax
- $860 · $72/mo
- Expected delta
- +$350/yr (+$29/mo · 68.6%)
ⓘ Screening estimate from a state-policy table — verify with the county assessor before closing.
Climate risk First Street
- Flood 1/10 Low FEMA zone X (unshaded) · 0% chance over 30 yrs
- Wildfire 7/10 Severe
- Heat 4/10 Moderate 7 d/yr ≥102°F today · 19 d/yr by 30 yrs out
- Wind 4/10 Moderate 7% chance of damaging wind over 30 yrs
- Air quality 1/10 Low 0 unhealthy d/yr today · 0 by 30 yrs out
Nearby sold comps map
Loading sold comps map…
Walkable amenities ~0.75 mi
Loading nearby amenities…
Taxation est. · year 1
- Rental income
- $17,474
- − Mortgage interest
- −$5,602
- − Property taxes
- −$510
- − Insurance
- −$500
- − Repairs & maintenance
- −$1,398
- − Management
- −$1,398
- − Depreciation
- −$2,909
- Taxable income
- $5,157
- Est. tax owed @ 24.0%
- −$1,238
- After-tax cash flow
- $5,264/yr
For passive investors: Depreciation is non-cash, so a rental often shows a tax loss while cash-flowing — sheltering income. Rental losses are passive: they offset passive income freely, and up to $25,000/yr can offset ordinary (W-2) income if you actively participate and your MAGI is under $100k (phasing out to $0 by $150k); unused losses carry forward. On sale, claimed depreciation is recaptured at up to 25%, and gains may owe capital-gains tax (a 1031 exchange can defer both). Figures are a year-1 estimate at your 24.0% rate — not tax advice; consult a CPA.
Schools (NCES district)
- District
- Montgomery County
- NCES district ID
- 2104250
- Math proficiency
- 24% ▼ -21.00%
- Reading proficiency
- 44% ▼ -14.00%
- Median HH income
- $38,262
- Composite
- 28.32/100
- National rank
- #6782
- State rank
- #76 of 165 in KY
Livability — Jeffersonville
- Score
- 61/100
- State rank
- #382
- US rank
- #18158
Category grades
Schools grade is shown separately in the Schools card above.
Census & demographics
- Census place
- Jeffersonville, KY
- Population (ZIP)
- 5,461
Population outlook (Montgomery County) Hauer SSP2
- Today (2025)
- 29,814 people
- By 2030
- 30,705 · +3.0%
- By 2040
- 32,189 · +8.0%
- By 2050
- 33,131 · +11.1%
- By 2075
- 33,991 · +14.0%
- By 2100
- 32,097 · +7.7%
Race, ethnicity, and origin ACS 2023
- Neighborhood character
- Predominantly White (97%)
- Race & ethnicity
- White 97% Two or more races 2% Hispanic / Latino 1%
- Common ancestry
- Slovak 3% Lithuanian 2% Italian 1%
- Foreign-born
- 1%
- Languages at home
- 98% English-only · Spanish 1% German/W. Germanic 1%
Political lean MEDSL · Montgomery
- 2024 margin
- Solid R (+46.6) · D 26.0% · R 72.6% · Other 1.5%
- 2008→2024 swing
- -30.0pp toward R · 2008: -16.6pp · 2024: -46.6pp
- All cycles
- 2024: R+46.6 2020: R+41.8 2016: R+41.1 2012: R+26.3 2008: R+16.6
Not yet ingested
- Civics
- —
Market trends
- HPI YoY
- ▲ 6.70%
- Current HPI
- 241.3612
- Rent YoY
- —
- Metro
- —
- State GDP YoY
- ▲ 1.81%
- F500 in state
- 4
Industry mix (Fortune 500 HQ in KY)
| Industry | F500 HQs | Revenue |
|---|---|---|
| Healthcare | 1 | $118B |
|
||
| Food / Beverage | 1 | $7B |
|
||
Price history
1 event — show timeline
- 2026-06-10 Listed $100,000 ImagineMLS
Cash-flow waterfall
monthlySold comps — $/sqft
last 12 mo · ≤1 miLoading sold comps…