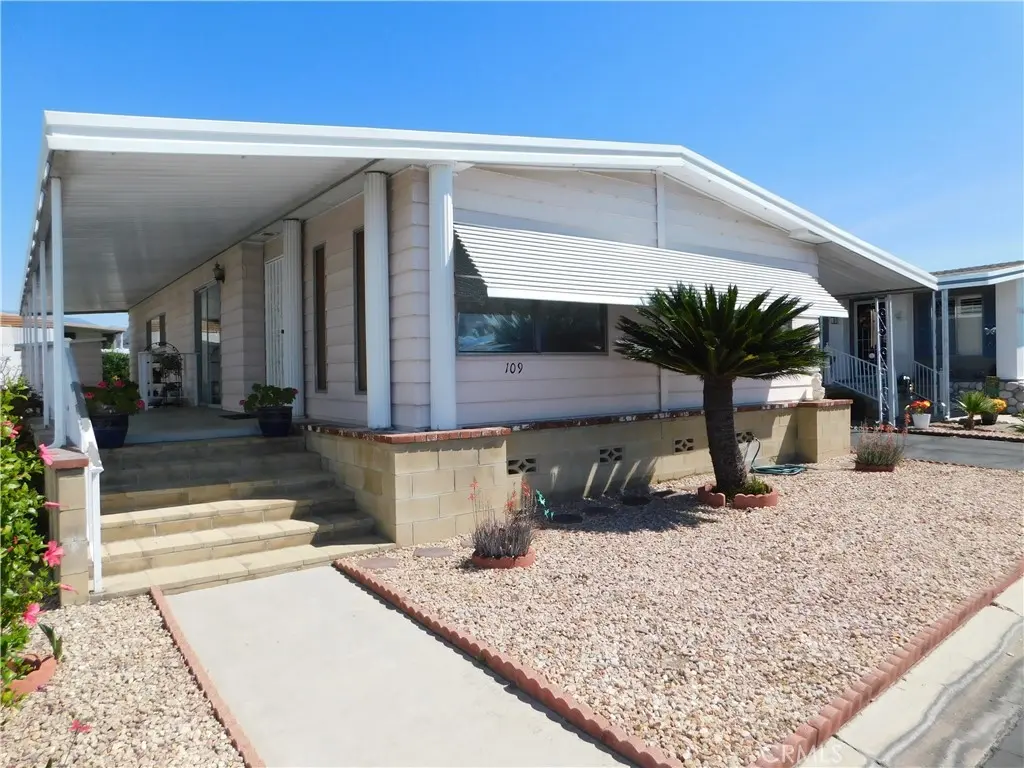
1251 E Lugonia Ave #109 · Redlands, CA
Flood risk 1/10 · Minimal
- FEMA flood zone
- X (unshaded)
- Chance of flooding over 30 yrs
- 0.0%
- Est. flood insurance / yr
- $507 – $1,088
Fire risk 7/10 · Major
- Est. fire insurance / yr
- $659 – $1,223
Heat risk 8/10 · Major
- Hot days now (above 101°F)
- 7 days/yr
- Hot days in 30 yrs
- 19 days/yr
Wind risk 1/10 · Minimal
- Chance of severe wind over 30 yrs
- —
Air-quality risk 10/10 · Severe
- Unhealthy air days now
- 29 days/yr
- Unhealthy air days in 30 yrs
- 35 days/yr
Risk factors via First Street. Map © Google.
Why this score? — see what drove the B+ grade
The composite is a weighted blend of 9 inputs, each scored 0–100. Each bar is that input's sub-score; the figure is the points it added to the 100-point composite (weight × sub-score).
- Cash flow +30.0/30.0
- ARV discount +15.0/15.0
- 1% rule +10.0/10.0
- DSCR +10.0/10.0
- Schools +4.7/10.0
- Livability +3.8/5.0
- Rent growth +3.4/5.0
- Condition / age +2.2/5.0
- Appreciation +0.0/10.0
$129,900
🖨 Deal sheet (PDF) 📄 Offer letter ✓ Due diligence
Listing remarks MLS
~Located in Redlands highly desirable 55+ community of Lugonia Fountains!~Space rent of $737!~This home boasts curb appeal and endless opportunities for comfortable living!~Perfect sized family room with sliding glass door opening to the inviting, covered concrete front porch!~Galley kitchen with plenty of cabinet/storage space and breakfast bar!~Fridge included!~Laundry area conveniently located off of carport entrance…stackable washer/dryer included!~Bright dining area with chandelier and built-in China hutch!~Spacious living room with coat closet and seamlessly connected to dining room and open to family room!~Primary bedroom is king size with ceiling fan and HUGE walk-in closet!~Vanity is suitably placed in between walk-in closet and bathroom!~Primary bathroom has tub/shower and new toilet installed in 2021!~Second bedroom is queen size, with ceiling fan and walk-in closet with custom built-ins!~Separate linen/storage closet!~Second bathroom has a new toilet installed in 2021 and walk-in shower with enclosure!~Second bathroom has access from second bedroom AND family room!~Central heating and air providing comfort all year round!~Water filtration system by Halo Water Systems included!~Low maintenance and private backyard!~TWO storage sheds!~2-3 vehicle carport!~Call for a tour today, you will definitely be impressed!~
Key facts
- Galley kitchen
- Laundry area
- Built-in china hutch
Tags
Neighborhood map
What this means for you Summary
Snapshot
- This is a 2-bed/2.0-bath manufactured listed at $130k. Condition is rated fair.
Deal economics
- At list price, monthly cash flow is $1k ($13k/yr) — positive.
- The deal already cash-flows at list — no discount required.
- Meets the 1% rule at list price ($3k rent vs $130k).
- Recommended offer: $118k (9.0% below list) — sets the bar for market timing.
- Cap rate 16.5% vs local median 2.8% in Redlands — top-decile yield for the area; either an underpriced asset or a hidden risk that comps aren't pricing in. Stress-test before assuming the spread holds.
Location & tenants
- Location reads 75/100 on livability (#118 in CA, #4,193 nationally) — a middle-class / working-renter tenant base. Strengths: amenities A+, commute A+, employment A+; Watch: crime C-, health & safety D, cost of living F.
- Redlands Unified (urban): math 44% / reading 57% proficiency, ranked #390 of 1,400 in CA (top 28%) — acceptable for families but not a draw, mixed tenant base, ~2y average lease.
- Zoned schools: Judson & Brown Elementary (476 students, 56% FRL); Clement Middle (1,038 students, 75% FRL); Redlands East Valley High (1,853 students, 67% FRL) — zoned schools average 66% FRL vs 48% district-wide (18 pts higher); higher-poverty schools than district average — tighter screening recommended.
- Market conditions: Rents rising (+3.7%/yr); 106 active listings in the ZIP; 27 comparable units currently listed for rent nearby; rentals at typical pace (median 27d on market — plan ~3-4 weeks tenant-placement turnaround); 44% of comp listings sitting > 30 days — soft ceiling on asking rent; solid renter incomes; 5,458 units permitted in San Bernardino County in 2024 (1,500 in 5+ unit buildings).
Forward outlook
- Local home prices are declining (-3.0%/yr); year-one equity from $898 of loan paydown is wiped out by about $4k of value loss. Plan a longer hold.
- San Bernardino County population projected at +15% by 2050 — modest demand growth; plan on rents tracking national, not racing it.
- At projected returns (-3.0% appreciation + 3.7% rent growth), your $36k cash investment doubles in ~4 years — after that, you're playing with house money.
Negotiation context
- It's been on market 95 days — a 9% lower offer ($118k) is reasonable based on typical stale-listing flexibility.
Risks & watch-outs
- Climate carrying-cost: major wildfire risk; extreme-heat days projected 7→19/yr by 2055 (HVAC capex compounding) — expect insurance premiums to compound above CPI over the hold.
Questions for the listing agent
- It's been on market 95 days. Have you received any prior offers? Is the seller open to a 9% concession, seller financing, or rate buy-down credit?
- Have any recent inspections been done? Can we get a copy of the seller's disclosures and any deferred-maintenance estimates?
- Built in 1974 — when were the roof, HVAC, electrical panel, plumbing, and water heater last replaced?
- Why hasn't it sold? Are there any deal-killer items the seller is aware of (foundation, flood, title, zoning, code violations)?
- Is there a deadline driving the sale (1031 exchange, divorce, estate, relocation)? That informs how much negotiation room exists.
- Schools are B-rated — typically a magnet for longer-tenancy family renters. What's the average tenant stay here, and is there a school-zone premium baked into asking?
- What's the average days-on-market for RENTAL listings here right now (not sales)? A rising rental-DOM trend means longer vacancies and softer asking-rent achievability than the comps imply.
- What's the recent tenant-quality profile in this submarket — average credit score on applications, eviction rate, late-payment / NSF rate, and stable-employment percentage? A property-management company in the area should have these aggregated.
- How much new for-sale + rental construction is in the pipeline within 1–3 miles? Heavy new supply typically softens prices + rents 12–24 months out; constrained supply supports both.
Investment metrics
- 1% rule
- 1.95% ✓
- Cap rate
- 16.51%
- Cash-on-cash
- 36.50%
- DSCR
- 2.62
- GRM
- 4.3
CMA / ARV
- ARV (median comp)
- $210,000
- List price
- $129,900
- Delta
- -38.14%
- Verdict
- UNDERPRICED
- Comps
- 19 within 1.0 mi
Show comp detail 12 sales within ~0.75 mi
| Address | Dist | Beds/Ba | Sqft | Sold | Price | $/sf | Match |
|---|---|---|---|---|---|---|---|
| 1251 E Lugonia Ave #48 | 0.00mi | 2/2.0 | 1,344 (+4%) | 4mo | $210,000 | $156 | 91 |
| 1251 E Lugonia | 0.00mi | 2/2.0 | 1,344 (+4%) | 5mo | $179,000 | $133 | 90 |
| 1251 E Lugonia Ave #75 | 0.11mi | 2/2.0 | 1,248 (-4%) | 1mo | $128,000 | $103 | 88 |
| 1251 E Lugonia Ave #98 | 0.00mi | 2/2.0 | 1,344 (+4%) | 8mo | $149,900 | $112 | 87 |
| 1331 Century St | 0.16mi | 2/2.0 | 1,368 (+6%) | 0mo | $269,500 | $197 | 83 |
| 1251 Lugonia #54 | 0.00mi | 2/2.0 | 1,440 (+11%) | 5mo | $167,500 | $116 | 77 |
| 1251 E Lugonia Ave #18 | 0.11mi | 2/2.0 | 1,440 (+11%) | 1mo | $155,000 | $108 | 76 |
| 1251 E Lugonia Ave #81 | 0.00mi | 2/2.0 | 1,458 (+12%) | 7mo | $225,000 | $154 | 73 |
| 1251 E Lugonia #27 | 0.00mi | 3/2.0 (+1) | 1,456 (+12%) | 2mo | $234,600 | $161 | 72 |
| 1423 Century | 0.17mi | 2/2.0 | 1,440 (+11%) | 3mo | $299,000 | $208 | 71 |
| 1413 Village | 0.12mi | 3/2.0 (+1) | 1,440 (+11%) | 2mo | $315,000 | $219 | 69 |
| 1405 Medallion St | 0.20mi | 2/2.0 | 1,440 (+11%) | 8mo | $310,000 | $215 | 66 |
Match score weights: distance 35% · size 25% · config 20% · recency 20%. Top-matched comps best support the ARV.
Projected returns pro-forma
-3.0% appreciation · 3.73% rent growth · sell at horizon
- IRR
- 33.1%
- Equity multiple
- 2.41×
- Total profit
- $51,319
- Equity at exit
- $19,369
- IRR
- 40.5%
- Equity multiple
- 4.94×
- Total profit
- $143,378
- Equity at exit
- $11,231
Cash invested: $36,372 (down + closing). Projections, not guarantees.
Landlord ↔ Tenant lean methodology
- Overall (STATE)
- 18 Strongly Tenant-Friendly
- State California
- 18 Strongly Tenant-Friendly · D+13
- County
- — inherits STATE
- City
- — inherits STATE
ZIP-level market 92374
- Rents YoY
- 3.7%
- Active inventory
- 106
- Price-to-rent
- 4.3×
Monthly cashflow live
- Estimated rent
- $2,537 high interval (Pro) →
- Mortgage (P&I)
- −$681
- Tax est. 1.5%
- −$162 /mo · $1,948/yr
- Insurance
- −$54
- HOA
- −$0
- Vacancy / Maint / Mgmt
- −$533
- Net cashflow
- $1,106
Break-even live
Sensitivity live
| Price | -10% $1,196 | -5% $1,151 | +0% $1,106 | +5% $1,061 | +10% $1,016 |
|---|---|---|---|---|---|
| Rent | -10% $906 | -5% $1,006 | +0% $1,106 | +5% $1,206 | +10% $1,307 |
| Rate | -1.0pp $1,172 | -0.5pp $1,139 | base $1,106 | +0.5pp $1,073 | +1.0pp $1,038 |
UW: 25.0% down · 7.5% · 30yr · 1.5% tax · 5.0% vac · 8.0% maint · 8.0% mgmt
Financing live
Cash to close
- Down payment
- $32,475
- Closing costs
- $3,897
- Reserves months
- —
- Total cash needed
- —
Loan-product check · same deal, 3 products live
Conventional
25% down · 7.5% · 30yr
- Down + closing
- —
- Monthly P&I
- —
- Monthly cashflow
- —
- DSCR
- —
- Eligible?
- —
Personal DTI + credit; lowest rate.
DSCR
20% down · 8.5% · 30yr
- Down + closing
- —
- Monthly P&I
- —
- Monthly cashflow
- —
- DSCR
- —
- Eligible?
- —
No personal income docs; deal must DSCR.
Hard money
10% down · 12.0% · 12mo
- Down + closing
- —
- Monthly P&I
- —
- Monthly cashflow
- —
- DSCR
- —
- Eligible?
- —
Short-term bridge; refi at stabilization.
Rent comps 27 comps
| Address | Beds | Baths | Sqft | Rent | $/sqft | DOM | Units | Dist |
|---|---|---|---|---|---|---|---|---|
| 1229 Edwards St #38 Redlands, CA | 2.0 | 2.0 | 1040 | $2,250 | $2.16 | 46d | 1 | 0.27mi |
| 1250 N University St Redlands, CA | 2.0 | 2.0 | 1140 | $2,649 | $2.32 | 1d | 1 | 0.33mi |
| 1255 N University St Redlands, CA | 2.0 | 1.5 | 935 | $2,340 | $2.50 | 46d | 1 | 0.41mi |
| 1335 Campus Ave Redlands, CA | 3.0 | 2.0 | 1200 | $2,750 | $2.29 | 46d | 1 | 0.53mi |
| 948 Barbra Ln Redlands, CA | 3.0 | 2.0 | 1367 | $2,695 | $1.97 | 1d | 1 | 0.56mi |
| 1017 Campus Ave Redlands, CA | 3.0 | 1.0 | 1016 | $2,495 | $2.46 | 46d | 1 | 0.59mi |
| 755 Judson St Redlands, CA | 2.0 | 2.0 | 1004 | $2,350 | $2.34 | 1d | 1 | 0.76mi |
| 1218 Oxford Dr Unit C Redlands, CA | 2.0 | 2.0 | 900 | $1,850 | $2.06 | 46d | 1 | 0.81mi |
| 521 Courier Ave Unit C Redlands, CA | 2.0 | 2.0 | 1000 | $2,000 | $2.00 | 46d | 1 | 0.84mi |
| 10 Cortez St Unit 2 Redlands, CA | 3.0 | 2.0 | 1200 | $2,900 | $2.42 | 26d | 1 | 0.94mi |
| 10 Cortez St Unit 2 Redlands, CA | 3.0 | 2.0 | 1200 | $2,900 | $2.42 | 17d | 1 | 0.94mi |
| 801 Belinda Ln Redlands, CA | 3.0 | 2.0 | 1040 | $2,895 | $2.78 | 1d | 1 | 0.97mi |
| 333 N University St Redlands, CA | 2.0 | 2.0 | 1050 | $2,275 | $2.17 | 26d | 1 | 0.99mi |
| 1209 E Central Ave Redlands, CA | 3.0 | 1.5 | 1100 | $2,200 | $2.00 | 14d | 1 | 1.00mi |
| 135 Cook St Unit 3 Redlands, CA | 2.0 | 1.5 | 1056 | $2,300 | $2.18 | 46d | 1 | 1.06mi |
| 1255 E Citrus Ave Redlands, CA | 2.0 | 1.0–2.0 | 1125 | $2,615 | $2.32 | 1d | 10 | 1.08mi |
| 1209 Sixth St Redlands, CA | 3.0 | 3.0 | 1500 | $3,200 | $2.13 | 24d | 1 | 1.10mi |
| 508 The Terrace Redlands, CA | 2.0 | 1.0 | 1100 | $1,695 | $1.54 | 1d | 1 | 1.10mi |
| 416 The Terrace Redlands, CA | 1.0–2.0 | 1.5 | 860 | $2,195 | $2.55 | 46d | 2 | 1.12mi |
| 1018 Sixth St Redlands, CA | 3.0 | 2.0 | 1500 | $3,200 | $2.13 | 4d | 1 | 1.12mi |
| 1808 Cave St Redlands, CA | 3.0 | 2.5 | 1569 | $3,200 | $2.04 | 46d | 1 | 1.19mi |
| 1555 Orange St Unit 1007 Redlands, CA | 3.0 | 2.5 | 1314 | $2,850 | $2.17 | 7d | 1 | 1.22mi |
| 529 E Central Ave Redlands, CA | 3.0 | 2.0 | 925 | $2,750 | $2.97 | 46d | 1 | 1.29mi |
| 263 Greenbriar Ct Redlands, CA | 3.0 | 2.0 | 1256 | $3,395 | $2.70 | 1d | 1 | 1.40mi |
| 22 S Dearborn St Redlands, CA | 3.0 | 2.5 | 1437 | $2,900 | $2.02 | 46d | 1 | 1.43mi |
| 1312 Live Oak Ct Unit 1 Redlands, CA | 3.0 | 2.0 | 1120 | $2,895 | $2.58 | 46d | 1 | 1.46mi |
| 1359 Jasper Ave Mentone, CA | 3.0 | 2.0 | 1100 | $2,995 | $2.72 | 1d | 1 | 1.46mi |
Listing history 18 events
-
2026-06-21days on market $129,900 Active 95 DOM
-
2026-06-18days on market $129,900 Active 92 DOM
-
2026-06-17days on market $129,900 Active 91 DOM
-
2026-06-16days on market $129,900 Active 90 DOM
-
2026-06-15days on market $129,900 Active 89 DOM
-
2026-06-13days on market $129,900 Active 87 DOM
-
2026-06-13pricedays on market $129,900 Active 86 DOM
-
2026-06-09days on market $139,900 Active 83 DOM
-
2026-06-08days on market $139,900 Active 82 DOM
-
2026-06-07days on market $139,900 Active 81 DOM
-
2026-06-04days on market $139,900 Active 78 DOM
-
2026-06-03days on market $139,900 Active 77 DOM
-
2026-06-02days on market $139,900 Active 76 DOM
-
2026-06-01days on market $139,900 Active 75 DOM
-
2026-05-31days on market $139,900 Active 74 DOM
-
2026-05-19price $139,900 1350-char remark
Show marketing remark (1350 chars)
~Located in Redlands highly desirable 55+ community of Lugonia Fountains!~Space rent of $737!~This home boasts curb appeal and endless opportunities for comfortable living!~Perfect sized family room with sliding glass door opening to the inviting, covered concrete front porch!~Galley kitchen with plenty of cabinet/storage space and breakfast bar!~Fridge included!~Laundry area conveniently located off of carport entrance…stackable washer/dryer included!~Bright dining area with chandelier and built-in China hutch!~Spacious living room with coat closet and seamlessly connected to dining room and open to family room!~Primary bedroom is king size with ceiling fan and HUGE walk-in closet!~Vanity is suitably placed in between walk-in closet and bathroom!~Primary bathroom has tub/shower and new toilet installed in 2021!~Second bedroom is queen size, with ceiling fan and walk-in closet with custom built-ins!~Separate linen/storage closet!~Second bathroom has a new toilet installed in 2021 and walk-in shower with enclosure!~Second bathroom has access from second bedroom AND family room!~Central heating and air providing comfort all year round!~Water filtration system by Halo Water Systems included!~Low maintenance and private backyard!~TWO storage sheds!~2-3 vehicle carport!~Call for a tour today, you will definitely be impressed!~
-
2026-04-09price $144,900 1350-char remark
Show marketing remark (1350 chars)
~Located in Redlands highly desirable 55+ community of Lugonia Fountains!~Space rent of $737!~This home boasts curb appeal and endless opportunities for comfortable living!~Perfect sized family room with sliding glass door opening to the inviting, covered concrete front porch!~Galley kitchen with plenty of cabinet/storage space and breakfast bar!~Fridge included!~Laundry area conveniently located off of carport entrance…stackable washer/dryer included!~Bright dining area with chandelier and built-in China hutch!~Spacious living room with coat closet and seamlessly connected to dining room and open to family room!~Primary bedroom is king size with ceiling fan and HUGE walk-in closet!~Vanity is suitably placed in between walk-in closet and bathroom!~Primary bathroom has tub/shower and new toilet installed in 2021!~Second bedroom is queen size, with ceiling fan and walk-in closet with custom built-ins!~Separate linen/storage closet!~Second bathroom has a new toilet installed in 2021 and walk-in shower with enclosure!~Second bathroom has access from second bedroom AND family room!~Central heating and air providing comfort all year round!~Water filtration system by Halo Water Systems included!~Low maintenance and private backyard!~TWO storage sheds!~2-3 vehicle carport!~Call for a tour today, you will definitely be impressed!~
-
2026-03-18$149,900 Active 1350-char remark
Show marketing remark (1350 chars)
~Located in Redlands highly desirable 55+ community of Lugonia Fountains!~Space rent of $737!~This home boasts curb appeal and endless opportunities for comfortable living!~Perfect sized family room with sliding glass door opening to the inviting, covered concrete front porch!~Galley kitchen with plenty of cabinet/storage space and breakfast bar!~Fridge included!~Laundry area conveniently located off of carport entrance…stackable washer/dryer included!~Bright dining area with chandelier and built-in China hutch!~Spacious living room with coat closet and seamlessly connected to dining room and open to family room!~Primary bedroom is king size with ceiling fan and HUGE walk-in closet!~Vanity is suitably placed in between walk-in closet and bathroom!~Primary bathroom has tub/shower and new toilet installed in 2021!~Second bedroom is queen size, with ceiling fan and walk-in closet with custom built-ins!~Separate linen/storage closet!~Second bathroom has a new toilet installed in 2021 and walk-in shower with enclosure!~Second bathroom has access from second bedroom AND family room!~Central heating and air providing comfort all year round!~Water filtration system by Halo Water Systems included!~Low maintenance and private backyard!~TWO storage sheds!~2-3 vehicle carport!~Call for a tour today, you will definitely be impressed!~
ⓘ Source: listings_history table (triggers on properties + properties_extension) + one-shot
backfill from property_details.listing_events for pre-trigger history.
Climate risk First Street
- Flood 1/10 Low FEMA zone X (unshaded) · 0% chance over 30 yrs
- Wildfire 7/10 Severe
- Heat 8/10 Severe 7 d/yr ≥101°F today · 19 d/yr by 30 yrs out
- Wind 1/10 Low
- Air quality 10/10 Extreme 29 unhealthy d/yr today · 35 by 30 yrs out
Nearby sold comps map
Loading sold comps map…
Walkable amenities ~0.75 mi
Loading nearby amenities…
Taxation est. · year 1
- Rental income
- $30,439
- − Mortgage interest
- −$7,276
- − Property taxes
- −$1,948
- − Insurance
- −$650
- − Repairs & maintenance
- −$2,435
- − Management
- −$2,435
- − Depreciation
- −$3,779
- Taxable income
- $11,915
- Est. tax owed @ 24.0%
- −$2,860
- After-tax cash flow
- $10,414/yr
For passive investors: Depreciation is non-cash, so a rental often shows a tax loss while cash-flowing — sheltering income. Rental losses are passive: they offset passive income freely, and up to $25,000/yr can offset ordinary (W-2) income if you actively participate and your MAGI is under $100k (phasing out to $0 by $150k); unused losses carry forward. On sale, claimed depreciation is recaptured at up to 25%, and gains may owe capital-gains tax (a 1031 exchange can defer both). Figures are a year-1 estimate at your 24.0% rate — not tax advice; consult a CPA.
Condition & rehab AI · 12 photos
This manufactured home requires moderate renovations to improve its condition and increase its value. Key updates include painting interior walls, replacing carpeting, updating kitchen cabinets, and replacing bathroom fixtures.
Repairs flagged
- Minor kitchen cabinets — slight wear
- Minor bathroom fixtures — dated design
- Minor interior paint — dated colors
Value-add opportunities
- Both paint interior walls — enhances curb appeal and interior aesthetics
- Both replace carpeting — improves comfort and reduces maintenance
- Both update kitchen cabinets — modernizes space and increases value
- Both update bathroom fixtures — modernizes space and increases value
Renovation cost estimate screening
| Repair item | Severity | Est. cost |
|---|---|---|
| kitchen cabinets · slight wear | Minor | $500–3,000 |
| bathroom fixtures · dated design | Minor | $500–3,000 |
| interior paint · dated colors | Minor | $500–3,000 |
| Total estimated repair cost · 3 items | $1,500–9,000 |
Value-add ROI direction
- Both paint interior walls — enhances curb appeal and interior aesthetics ↑
- Both replace carpeting — improves comfort and reduces maintenance ↑
- Both update kitchen cabinets — modernizes space and increases value ↑
- Both update bathroom fixtures — modernizes space and increases value ↑
ⓘ Cost ranges are severity-bucket heuristics (US national rule-of-thumb). Get contractor quotes + a written scope before underwriting a rehab budget.
Schools (NCES district)
- District
- Redlands Unified
- NCES district ID
- 0632070
- Math proficiency
- 44% ▼ -1.00%
- Reading proficiency
- 57% ▼ -2.00%
- Median HH income
- $67,959
- Composite
- 46.88/100
- National rank
- #5185
- State rank
- #390 of 1400 in CA
Livability — Redlands
- Score
- 75/100
- State rank
- #118
- US rank
- #4193
Category grades
Schools grade is shown separately in the Schools card above.
Census & demographics
- Census place
- Redlands, CA
- County
- San Bernardino County · 2,030,291 people
- City population
- 80,519
- Metro
- Riverside-San Bernardino-Ontario, CA
- Population (ZIP)
- 45,262
- Household income
- $102,813
- Rent vs Own
- Severe rent burden
- 1176.0
Population outlook (San Bernardino County) Hauer SSP2
- Today (2025)
- 2,300,329 people
- By 2030
- 2,378,907 · +3.4%
- By 2040
- 2,523,137 · +9.7%
- By 2050
- 2,642,388 · +14.9%
- By 2075
- 2,880,769 · +25.2%
- By 2100
- 2,909,436 · +26.5%
Race, ethnicity, and origin ACS 2023
- Neighborhood character
- Diverse neighborhood (Simpson 0.67)
- Race & ethnicity
- Hispanic / Latino 43% White 37% Two or more races 19% Asian 8% Black 6% Pacific Islander 1%
- Hispanic origin (detail)
- Mexican 37%
- Common ancestry
- Italian 2% Lithuanian 2% Slovak 1%
- Foreign-born
- 18% · Canada, China, Vietnam
- Languages at home
- 67% English-only · Spanish 24% Other Indo-European 2% Other Asian/Pacific 2%
Political lean MEDSL · San Bernardino
- 2024 margin
- Toss-up / Even · D 47.5% · R 49.7% · Other 2.8%
- 2008→2024 swing
- -8.5pp toward R · 2008: 6.3pp · 2024: -2.1pp
- All cycles
- 2024: R+2.1 2020: D+10.7 2016: D+9.8 2012: D+5.4 2008: D+6.3
Not yet ingested
- Civics
- —
Market trends
- HPI YoY
- ▼ -425.72%
- Current HPI
- 367.6123
- Rent YoY
- ▲ 3.73%
- Metro
- Riverside-San Bernardino-Ontario, CA
- State GDP YoY
- ▲ 3.21%
- F500 in state
- 116
Industry mix (Fortune 500 HQ in CA)
| Industry | F500 HQs | Revenue |
|---|---|---|
| Technology | 27 | $1,492B |
|
||
| Financial Services | 3 | $174B |
|
||
| Retail | 3 | $44B |
|
||
| Insurance | 3 | $26B |
|
||
| Media / Entertainment | 2 | $115B |
|
||
| Pharmaceuticals / Biotech | 2 | $62B |
|
||
Price history
-6.7% since first listed3 events — show timeline
- 2026-05-19 Price Changed $139,900 CRMLS
- 2026-04-09 Price Changed $144,900 CRMLS
- 2026-03-18 Listed $149,900 CRMLS
Cash-flow waterfall
monthlySold comps — $/sqft
last 12 mo · ≤1 miLoading sold comps…