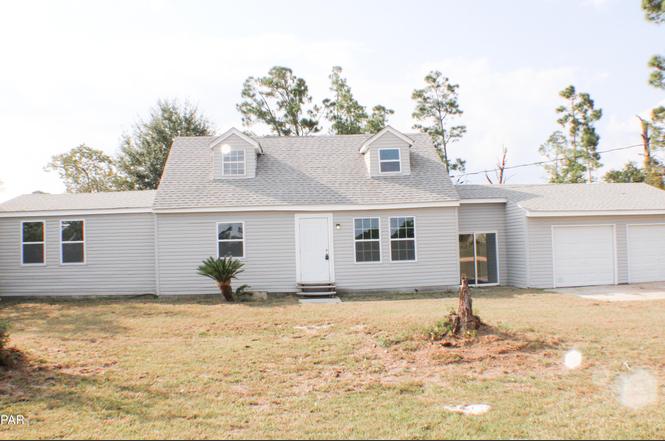
8561 Fremont Rd · Panama City, FL
Flood risk 1/10 · Minimal
- FEMA flood zone
- A
- Chance of flooding over 30 yrs
- 0.0%
- Est. flood insurance / yr
- $1,009 – $1,996
Fire risk 7/10 · Major
- Est. fire insurance / yr
- $947 – $1,759
Heat risk 9/10 · Severe
- Hot days now (above 105°F)
- 7 days/yr
- Hot days in 30 yrs
- 21 days/yr
Wind risk 9/10 · Severe
- Chance of severe wind over 30 yrs
- 99.0%
Air-quality risk 2/10 · Minimal
- Unhealthy air days now
- 1 days/yr
- Unhealthy air days in 30 yrs
- 1 days/yr
Risk factors via First Street. Map © Google.
Why this score? — see what drove the C- grade
The composite is a weighted blend of 9 inputs, each scored 0–100. Each bar is that input's sub-score; the figure is the points it added to the 100-point composite (weight × sub-score).
- Cash flow +15.0/30.0
- Appreciation +10.0/10.0
- ARV discount +7.5/15.0
- DSCR +4.6/10.0
- Schools +4.3/10.0
- Livability +3.6/5.0
- 1% rule +3.2/10.0
- Rent growth +2.5/5.0
- Condition / age +2.5/5.0
$235,000
🖨 Deal sheet 📄 Offer letter ✓ Due diligence
Listing remarks MLS
THIS IS A FORECLOSURE BEING SOLD AS IS, NEEDS WORK. PRICED TO SELL
Key facts
- 0.76 acre lot
- 2 garage spots
- Built 1978
Property features AI
Finance
- HOA & community: Short-term rentals allowed
Exterior
- Parking: 2-car garage
- Home design: Single-story layout (all listed rooms on the first level)
- Exterior features: Lot dimensions approximately 167 x 287 x 180 x 202
Interior
- Kitchen: Kitchen on the first level (approx. 14 x 13)
- Bedrooms: Four bedrooms on the first level (including primary bedroom)
- Bathrooms: Three full bathrooms
- Interior features: Total of 6 rooms
Neighborhood map
What this means for you Summary
Snapshot
- This is a 3-bed/2.0-bath single-family listed at $235k.
Deal economics
- At list price, monthly cash flow is $-50 ($-602/yr) — negative.
- To cash-flow at today's rent, offer at most $226k (3.8% below list).
- To meet the 1% rule (rent ≥ 1% of price), the offer needs to be $193k (17.9% below list).
- Recommended offer: $193k (17.9% below list) — sets the bar for 1% rule.
- Cap rate 6.7% vs local median 4.7% in Panama City — top-decile yield for the area; either an underpriced asset or a hidden risk that comps aren't pricing in. Stress-test before assuming the spread holds.
Location & tenants
- Location reads 72/100 on livability (#350 in FL) — a middle-class / working-renter tenant base. Strengths: cost of living A+, housing A+, health & safety A+; Watch: crime F, amenities F, commute F.
- Bay (suburban): math 51% / reading 51% proficiency, ranked #29 of 73 in FL (top 40%) — acceptable for families but not a draw, mixed tenant base, ~2y average lease.
- Market conditions: 112 active listings in the ZIP; 2,473 units permitted in Bay County in 2024 (559 in 5+ unit buildings).
Forward outlook
- In year one you build about $25k of equity ($2k loan paydown + $24k appreciation (10.0% local appreciation)).
- Bay County population projected at +24% by 2050 — long-run rental-demand tailwind backs the buy-and-hold thesis.
- At projected returns (10.0% appreciation + 3.0% rent growth), your $66k cash investment doubles in ~3 years — after that, you're playing with house money.
- By year 2, paydown + projected appreciation supports a ~$40k cash-out refi (75% LTV) — recoverable capital for the next deal without selling this one.
Negotiation context
- It's been on market 164 days — a 12% lower offer ($207k) is reasonable based on typical stale-listing flexibility.
- 6 sale attempts since 22y ago; this cycle's ask has dropped $50k (18%) from the opening price — seller is motivated, your offer sets the floor, not the list.
- Current owner paid $57k; list at $235k implies a 312% gain — meaningful room to come down on a strong offer.
Risks & watch-outs
- Watch-outs: flood insurance adds $125/mo.
- Climate carrying-cost: in FEMA flood zone A (mandatory federal flood insurance); severe wind risk, 99% chance of damaging wind over 30y; major wildfire risk; extreme-heat days projected 7→21/yr by 2055 (HVAC capex compounding) — expect insurance premiums to compound above CPI over the hold.
Questions for the listing agent
- What do current leases actually rent for vs. the listed asking? Can we see a recent rent roll and the last 12 months of T-12 income?
- It's been on market 164 days. Have you received any prior offers? Is the seller open to a 18% concession, seller financing, or rate buy-down credit?
- Built in 1978 — when were the roof, HVAC, electrical panel, plumbing, and water heater last replaced?
- What's the actual annual flood-insurance premium (NFIP or private), and is the property in a SFHA with mandatory coverage?
- Why hasn't it sold? Are there any deal-killer items the seller is aware of (foundation, flood, title, zoning, code violations)?
- Is there a deadline driving the sale (1031 exchange, divorce, estate, relocation)? That informs how much negotiation room exists.
- Schools are B-rated — typically a magnet for longer-tenancy family renters. What's the average tenant stay here, and is there a school-zone premium baked into asking?
- Crime grade is F in this area — have there been break-ins, vandalism, or insurance claims at this property in the last 3 years? What carrier currently insures it and at what premium?
- What's the average days-on-market for RENTAL listings here right now (not sales)? A rising rental-DOM trend means longer vacancies and softer asking-rent achievability than the comps imply.
- What's the recent tenant-quality profile in this submarket — average credit score on applications, eviction rate, late-payment / NSF rate, and stable-employment percentage? A property-management company in the area should have these aggregated.
- How much new for-sale + rental construction is in the pipeline within 1–3 miles? Heavy new supply typically softens prices + rents 12–24 months out; constrained supply supports both.
Investment metrics
- 1% rule
- 0.82% ✗
- Cap rate
- 6.68%
- Cash-on-cash
- 1.37%
- DSCR
- 1.06
- GRM
- 10.2
CMA / ARV
No comps found within radius.
Projected returns pro-forma
10.0% appreciation · 3.0% rent growth · sell at horizon
- IRR
- 23.6%
- Equity multiple
- 2.90×
- Total profit
- $124,792
- Equity at exit
- $211,707
- IRR
- 21.0%
- Equity multiple
- 6.62×
- Total profit
- $370,001
- Equity at exit
- $456,553
Cash invested: $65,800 (down + closing). Projections, not guarantees.
Landlord ↔ Tenant lean methodology
- Overall (STATE)
- 87 Strongly Landlord-Friendly
- State Florida
- 87 Strongly Landlord-Friendly · R+3
- County
- — inherits STATE
- City
- — inherits STATE
ZIP-level market 32466
- Home prices YoY
- 4.4%
- Active inventory
- 112
- Price-to-rent
- 10.2×
Monthly cashflow live
- Estimated rent
- $1,929 medium interval (Pro) →
- Mortgage (P&I)
- −$1,232
- Tax from tax record
- −$119 /mo · $1,423/yr
- Insurance
- −$98
- Flood insurance flood zone
- −$125 /mo · $1,502/yr
- HOA
- −$0
- Vacancy / Maint / Mgmt
- −$405
- Net cashflow
- $-50
Break-even live
UW: 25.0% down · 7.5% · 30yr · 1.5% tax · 5.0% vac · 8.0% maint · 8.0% mgmt
Financing live
Cash to close
- Down payment
- $58,750
- Closing costs
- $7,050
- Reserves months
- —
- Total cash needed
- —
Loan-product check · same deal, 3 products live
Conventional
25% down · 7.5% · 30yr
- Down + closing
- —
- Monthly P&I
- —
- Monthly cashflow
- —
- DSCR
- —
- Eligible?
- —
Personal DTI + credit; lowest rate.
DSCR
20% down · 8.5% · 30yr
- Down + closing
- —
- Monthly P&I
- —
- Monthly cashflow
- —
- DSCR
- —
- Eligible?
- —
No personal income docs; deal must DSCR.
Hard money
10% down · 12.0% · 12mo
- Down + closing
- —
- Monthly P&I
- —
- Monthly cashflow
- —
- DSCR
- —
- Eligible?
- —
Short-term bridge; refi at stabilization.
Listing history 50 events
-
2026-06-19days on market $235,000 Active 164 DOM
-
2026-06-18days on market $235,000 Active 163 DOM
-
2026-06-17days on market $235,000 Active 162 DOM
-
2026-06-16days on market $235,000 Active 161 DOM
-
2026-06-15days on market $235,000 Active 160 DOM
-
2026-06-14days on market $235,000 Active 158 DOM
-
2026-06-13pricedays on market $235,000 Active 157 DOM
-
2026-06-10days on market $237,000 Active 155 DOM
-
2026-06-09days on market $237,000 Active 154 DOM
-
2026-06-08days on market $237,000 Active 153 DOM
-
2026-06-07days on market $237,000 Active 152 DOM
-
2026-06-05days on market $237,000 Active 149 DOM
-
2026-06-03days on market $237,000 Active 148 DOM
-
2026-06-02days on market $237,000 Active 147 DOM
-
2026-06-01days on market $237,000 Active 146 DOM
-
2026-05-31days on market $237,000 Active 145 DOM
-
2026-05-30days on market $237,000 Active 144 DOM
-
2026-05-23status Active
-
2026-02-09status Pending
-
2026-01-27price $237,000
-
2025-12-17price $239,000
-
2025-12-02price $257,000
-
2025-10-30price $265,000
-
2025-10-27price $280,000
-
2025-10-13price $283,000
-
2025-09-25$285,000 Active
-
2024-04-27historical
-
2024-04-15price $67,000
-
2024-03-26price $69,000
-
2024-03-21price $71,000
-
2024-03-15price $73,000
-
2024-03-06price $75,000
-
2024-02-21price $78,000
-
2024-02-16price $80,000
-
2024-02-08price $83,000
-
2024-01-26price $86,000
-
2024-01-23price $90,000
-
2024-01-17price $93,000
-
2024-01-08price $98,000
-
2024-01-04price $100,000
-
2023-12-19price $105,000
-
2023-11-29price $110,000
-
2023-11-20price $120,000
-
2023-11-15price $130,000
-
2023-11-10price $140,000
-
2023-11-03price $150,000
-
2023-11-01price $160,000
-
2023-10-27$175,000 Active
-
2023-10-27soldstatus $57,000
-
2009-09-15soldstatus $42,500 66-char remark
Show marketing remark (66 chars)
THIS IS A FORECLOSURE BEING SOLD AS IS, NEEDS WORK. PRICED TO SELL
ⓘ Source: listings_history table (triggers on properties + properties_extension) + one-shot
backfill from property_details.listing_events for pre-trigger history.
Tax reassessment forecast FL · Resets to sale price
- Current annual tax
- $1,423 · $119/mo
- Projected year-2 tax
- $1,950 · $163/mo
- Expected delta
- +$527/yr (+$44/mo · 37.1%)
ⓘ Screening estimate from a state-policy table — verify with the county assessor before closing.
Climate risk First Street
- Flood 1/10 Low FEMA zone A · 0% chance over 30 yrs
- Wildfire 7/10 Severe
- Heat 9/10 Extreme 7 d/yr ≥105°F today · 21 d/yr by 30 yrs out
- Wind 9/10 Extreme 99% chance of damaging wind over 30 yrs
- Air quality 2/10 Low 1 unhealthy d/yr today · 1 by 30 yrs out
Nearby sold comps map
Loading sold comps map…
Walkable amenities ~0.75 mi
Loading nearby amenities…
Taxation est. · year 1
- Rental income
- $23,148
- − Mortgage interest
- −$13,164
- − Property taxes
- −$1,423
- − Insurance
- −$2,678
- − Repairs & maintenance
- −$1,852
- − Management
- −$1,852
- − Depreciation
- −$6,836
- Taxable loss
- −$4,656
- Est. tax savings @ 24.0%
- +$1,117
- After-tax cash flow
- $516/yr
For passive investors: Depreciation is non-cash, so a rental often shows a tax loss while cash-flowing — sheltering income. Rental losses are passive: they offset passive income freely, and up to $25,000/yr can offset ordinary (W-2) income if you actively participate and your MAGI is under $100k (phasing out to $0 by $150k); unused losses carry forward. On sale, claimed depreciation is recaptured at up to 25%, and gains may owe capital-gains tax (a 1031 exchange can defer both). Figures are a year-1 estimate at your 24.0% rate — not tax advice; consult a CPA.
Schools (NCES district)
- District
- Bay
- NCES district ID
- 1200090
- Math proficiency
- 51% ▼ -8.00%
- Reading proficiency
- 51% ▼ -7.00%
- Median HH income
- $47,740
- Composite
- 43.41/100
- National rank
- #3014
- State rank
- #29 of 73 in FL
Livability — Panama City
- Score
- 72/100
- State rank
- #350
- US rank
- #5823
Category grades
Schools grade is shown separately in the Schools card above.
Census & demographics
- City population
- 91,445
- Population (ZIP)
- 5,837
Population outlook (Bay County) Hauer SSP2
- Today (2025)
- 206,264 people
- By 2030
- 217,740 · +5.6%
- By 2040
- 238,738 · +15.7%
- By 2050
- 255,545 · +23.9%
- By 2075
- 288,295 · +39.8%
- By 2100
- 288,638 · +39.9%
Race, ethnicity, and origin ACS 2023
- Neighborhood character
- Predominantly White (89%)
- Race & ethnicity
- White 89% Two or more races 7% Black 3% Hispanic / Latino 2%
- Common ancestry
- Lithuanian 4% Portuguese 3% Serbian 2%
- Foreign-born
- 2% · Canada
Political lean MEDSL · Bay
- 2024 margin
- Solid R (+47.4) · D 25.8% · R 73.1% · Other 1.1%
- 2008→2024 swing
- -6.6pp toward R · 2008: -40.7pp · 2024: -47.4pp
- All cycles
- 2024: R+47.4 2020: R+43.5 2016: R+46.3 2012: R+43.6 2008: R+40.7
Not yet ingested
- Civics
- —
Market trends
- HPI YoY
- ▲ 11.68%
- Current HPI
- 274.7988
- Rent YoY
- —
- Metro
- —
- State GDP YoY
- ▲ 3.28%
- F500 in state
- 36
Industry mix (Fortune 500 HQ in FL)
| Industry | F500 HQs | Revenue |
|---|---|---|
| Industrial Technology | 2 | $29B |
|
||
| Insurance | 2 | $17B |
|
||
| Retail | 1 | $60B |
|
||
| Technology Distribution | 1 | $58B |
|
||
| Homebuilding | 1 | $35B |
|
||
| Technology Manufacturing | 1 | $35B |
|
||
Price history
+432.6% since first listed42 events — show timeline
- 2026-05-23 Relisted — CPARMLS
- 2026-02-09 Pending — CPARMLS
- 2026-01-27 Price Changed $237,000 CPARMLS
- 2025-12-17 Price Changed $239,000 CPARMLS
- 2025-12-02 Price Changed $257,000 CPARMLS
- 2025-10-30 Price Changed $265,000 CPARMLS
- 2025-10-27 Price Changed $280,000 CPARMLS
- 2025-10-13 Price Changed $283,000 CPARMLS
- 2025-09-25 Listed $285,000 CPARMLS
- 2024-04-27 Listing Removed — CPARMLS
- 2024-04-15 Price Changed $67,000 CPARMLS
- 2024-03-26 Price Changed $69,000 CPARMLS
- 2024-03-21 Price Changed $71,000 CPARMLS
- 2024-03-15 Price Changed $73,000 CPARMLS
- 2024-03-06 Price Changed $75,000 CPARMLS
- 2024-02-21 Price Changed $78,000 CPARMLS
- 2024-02-16 Price Changed $80,000 CPARMLS
- 2024-02-08 Price Changed $83,000 CPARMLS
- 2024-01-26 Price Changed $86,000 CPARMLS
- 2024-01-23 Price Changed $90,000 CPARMLS
- 2024-01-17 Price Changed $93,000 CPARMLS
- 2024-01-08 Price Changed $98,000 CPARMLS
- 2024-01-04 Price Changed $100,000 CPARMLS
- 2023-12-19 Price Changed $105,000 CPARMLS
- 2023-11-29 Price Changed $110,000 CPARMLS
- 2023-11-20 Price Changed $120,000 CPARMLS
- 2023-11-15 Price Changed $130,000 CPARMLS
- 2023-11-10 Price Changed $140,000 CPARMLS
- 2023-11-03 Price Changed $150,000 CPARMLS
- 2023-11-01 Price Changed $160,000 CPARMLS
- 2023-10-27 Sold (Public Records) $57,000 Public Records
- 2023-10-27 Listed $175,000 CPARMLS
- 2009-09-15 Sold (MLS) $42,500 CPARMLS
- 2009-04-20 Listed $47,500 CPARMLS
- 2006-11-08 Sold (Public Records) $149,900 Public Records
- 2006-11-08 Sold (MLS) $149,900 CPARMLS
- 2006-06-07 Listed $149,900 CPARMLS
- 2005-04-29 Sold (MLS) $129,900 CPARMLS
- 2004-10-30 Listed $129,900 CPARMLS
- 2002-04-18 Sold (Public Records) $75,000 Public Records
- 1996-03-01 Sold (Public Records) $70,000 Public Records
- 1989-12-01 Sold (Public Records) $44,500 Public Records
Property tax history
+6.6%/yrLatest (2025): $1,423 · +5.8% YoY. Source: county tax records.
Cash-flow waterfall
monthlySold comps — $/sqft
last 12 mo · ≤1 miLoading sold comps…