105 Tulip Ln · Brownsville, KY
Flood risk 1/10 · Minimal
- FEMA flood zone
- X (unshaded)
- Chance of flooding over 30 yrs
- 0.0%
- Est. flood insurance / yr
- $507 – $1,088
Fire risk 3/10 · Minor
- Est. fire insurance / yr
- $839 – $1,559
Heat risk 4/10 · Minor
- Hot days now (above 106°F)
- 7 days/yr
- Hot days in 30 yrs
- 18 days/yr
Wind risk 2/10 · Minimal
- Chance of severe wind over 30 yrs
- 3.0%
Air-quality risk 2/10 · Minimal
- Unhealthy air days now
- 1 days/yr
- Unhealthy air days in 30 yrs
- 2 days/yr
Risk factors via First Street. Map © Google.
Why this score? — see what drove the C- grade
The composite is a weighted blend of 9 inputs, each scored 0–100. Each bar is that input's sub-score; the figure is the points it added to the 100-point composite (weight × sub-score).
- Cash flow +17.2/30.0
- ARV discount +7.5/15.0
- Appreciation +6.0/10.0
- DSCR +5.4/10.0
- 1% rule +4.8/10.0
- Livability +3.3/5.0
- Schools +3.1/10.0
- Rent growth +2.5/5.0
- Condition / age +2.5/5.0
$100,000
🖨 Deal sheet 📄 Offer letter ✓ Due diligence
Listing remarks
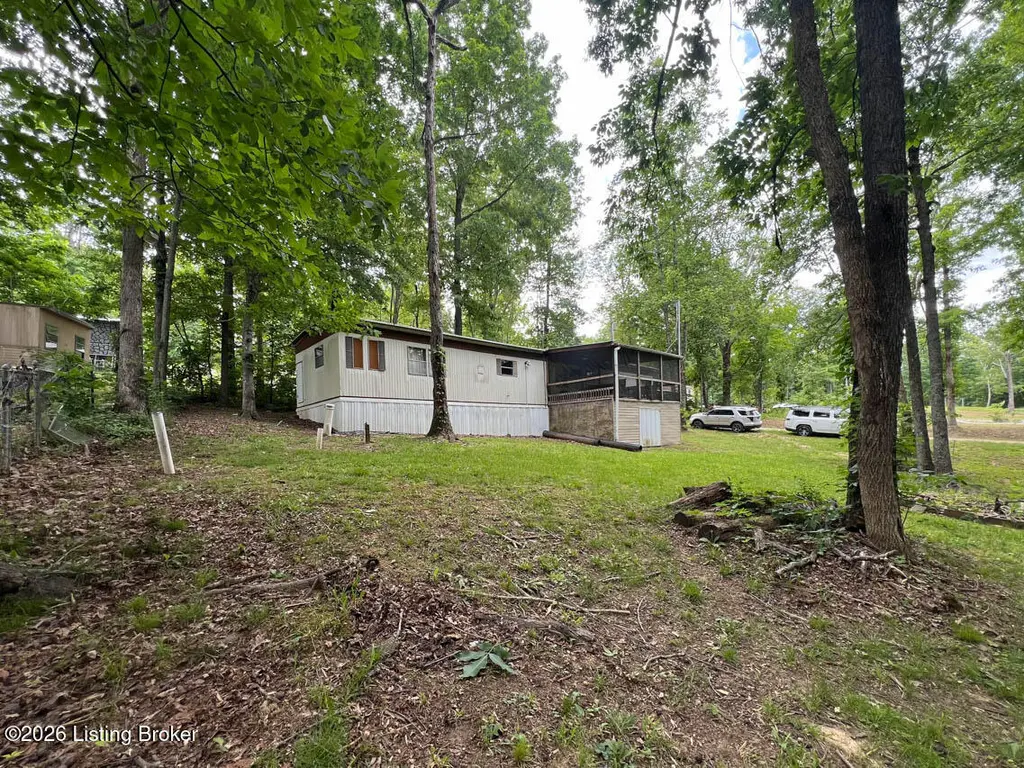
Located in the desirable Cave Hollow Bay area of beautiful Nolin Lake, this charming 3-bedroom, 2 full bath home offers the perfect blend of comfort, relaxation, and lake living. Just minutes from two convenient boat ramps, you'll enjoy quick access to boating, fishing, swimming, and unforgettable days on the water. Inside, the home features a warm and inviting atmosphere designed for gathering with family and friends after long lake days. The spacious screened-in porch overlooks a peaceful campsite setting and creates the ideal place to enjoy your morning coffee, evening meals, or simply relax while taking in the quiet surroundings and fresh Kentucky air. Whether you're searching for a wee
Key facts
- Cave hollow bay area
- Quiet surroundings
- 0.75 acre lot
Tags
Property features AI
Finance
- HOA & community: Community association with a $100/month fee
Exterior
- Parking: No parking provided
- Utilities: Electricity connected; Central air
- Home design: Residential single-story home; Built in 1976; Entry level: first floor
- Construction: Aluminum siding; Metal roof; Built in 1976
- Exterior features: 0.75-acre lot; Subdivision: CAVE HOLLOW BAY; Dock
Interior
- Kitchen: Kitchen on the first floor; Dining area adjacent to the kitchen
- Bedrooms: 3 bedrooms (all on the first floor); Primary bedroom on the first floor
- Bathrooms: 2 full bathrooms
- Heating & cooling: Electric heating; Central air conditioning
- Interior features: 6 total rooms; 5 closets; No basement; Living room; Dining area; Primary bedroom
- Laundry & utility: First-floor laundry
Neighborhood map
What this means for you Summary
Snapshot
- This is a 3-bed/2.0-bath manufactured listed at $100k.
Deal economics
- At list price, monthly cash flow is $71 ($858/yr) — positive.
- The deal already cash-flows at list — no discount required.
- To meet the 1% rule (rent ≥ 1% of price), the offer needs to be $98k (2.5% below list).
- Recommended offer: $98k (2.5% below list) — sets the bar for 1% rule.
- Cap rate 7.2% vs local median 2.3% in Brownsville — top-decile yield for the area; either an underpriced asset or a hidden risk that comps aren't pricing in. Stress-test before assuming the spread holds.
Location & tenants
- Location reads 66/100 on livability (#234 in KY) — a middle-class / working-renter tenant base. Strengths: crime A+, cost of living A+, housing A+; Watch: schools D, amenities F, commute F.
- Edmonson County (rural): math 31% / reading 43% proficiency, ranked #53 of 165 in KY (top 32%) — families likely to look elsewhere, expect single-tenant / working-renter base with shorter leases.
- Market conditions: 40 active listings in the ZIP.
Forward outlook
- In year one you build about $3k of equity ($691 loan paydown + $2k appreciation (2.1% local appreciation)).
- Edmonson County population projected at -16% by 2050 — secular population decline; favor cash flow + early exit over multi-decade hold.
- At projected returns (2.1% appreciation + 3.0% rent growth), your $28k cash investment doubles in ~7 years — after that, you're playing with house money.
Negotiation context
- It's been on market 28 days — a 2% lower offer ($98k) is reasonable based on typical stale-listing flexibility.
Questions for the listing agent
- Built in 1976 — when were the roof, HVAC, electrical panel, plumbing, and water heater last replaced?
- What does the HOA fee cover, when was the last increase, and are there any pending special assessments or reserve-fund shortfalls?
- Is there a deadline driving the sale (1031 exchange, divorce, estate, relocation)? That informs how much negotiation room exists.
- Schools are D-rated, which usually means shorter tenancies and higher turnover. Who's the typical renter profile here, and what's been the actual vacancy rate?
- What's the average days-on-market for RENTAL listings here right now (not sales)? A rising rental-DOM trend means longer vacancies and softer asking-rent achievability than the comps imply.
- What's the recent tenant-quality profile in this submarket — average credit score on applications, eviction rate, late-payment / NSF rate, and stable-employment percentage? A property-management company in the area should have these aggregated.
- How much new for-sale + rental construction is in the pipeline within 1–3 miles? Heavy new supply typically softens prices + rents 12–24 months out; constrained supply supports both.
Investment metrics
- 1% rule
- 0.98% ✗
- Cap rate
- 7.15%
- Cash-on-cash
- 3.06%
- DSCR
- 1.14
- GRM
- 8.5
CMA / ARV
No comps found within radius.
Projected returns pro-forma
2.06% appreciation · 3.0% rent growth · sell at horizon
- IRR
- 7.7%
- Equity multiple
- 1.42×
- Total profit
- $11,741
- Equity at exit
- $39,777
- IRR
- 11.0%
- Equity multiple
- 2.49×
- Total profit
- $41,768
- Equity at exit
- $57,537
Cash invested: $28,000 (down + closing). Projections, not guarantees.
Landlord ↔ Tenant lean methodology
- Overall (STATE)
- 83 Strongly Landlord-Friendly
- State Kentucky
- 83 Strongly Landlord-Friendly · R+16
- County
- — inherits STATE
- City
- — inherits STATE
ZIP-level market 42259
- Home prices YoY
- 1.8%
- Active inventory
- 40
- Price-to-rent
- 8.5×
Monthly cashflow live
- Estimated rent
- $975 medium interval (Pro) →
- Mortgage (P&I)
- −$524
- Tax est. 1.5%
- −$125 /mo · $1,500/yr
- Insurance
- −$42
- HOA
- −$8
- Vacancy / Maint / Mgmt
- −$205
- Net cashflow
- $71
Break-even live
UW: 25.0% down · 7.5% · 30yr · 1.5% tax · 5.0% vac · 8.0% maint · 8.0% mgmt
Financing live
Cash to close
- Down payment
- $25,000
- Closing costs
- $3,000
- Reserves months
- —
- Total cash needed
- —
Loan-product check · same deal, 3 products live
Conventional
25% down · 7.5% · 30yr
- Down + closing
- —
- Monthly P&I
- —
- Monthly cashflow
- —
- DSCR
- —
- Eligible?
- —
Personal DTI + credit; lowest rate.
DSCR
20% down · 8.5% · 30yr
- Down + closing
- —
- Monthly P&I
- —
- Monthly cashflow
- —
- DSCR
- —
- Eligible?
- —
No personal income docs; deal must DSCR.
Hard money
10% down · 12.0% · 12mo
- Down + closing
- —
- Monthly P&I
- —
- Monthly cashflow
- —
- DSCR
- —
- Eligible?
- —
Short-term bridge; refi at stabilization.
HOA detail
- Monthly dues
- $8 · $96/yr
- Likely covers
- water
Listing history 18 events
-
2026-06-19days on market $100,000 Active 28 DOM
-
2026-06-18days on market $100,000 Active 27 DOM
-
2026-06-17days on market $100,000 Active 26 DOM
-
2026-06-16days on market $100,000 Active 25 DOM
-
2026-06-15days on market $100,000 Active 24 DOM
-
2026-06-14days on market $100,000 Active 22 DOM
-
2026-06-13days on market $100,000 Active 21 DOM
-
2026-06-10days on market $100,000 Active 19 DOM
-
2026-06-09days on market $100,000 Active 18 DOM
-
2026-06-08days on market $100,000 Active 17 DOM
-
2026-06-07days on market $100,000 Active 16 DOM
-
2026-06-05days on market $100,000 Active 13 DOM
-
2026-06-03days on market $100,000 Active 12 DOM
-
2026-06-02days on market $100,000 Active 11 DOM
-
2026-06-01days on market $100,000 Active 10 DOM
-
2026-05-31days on market $100,000 Active 9 DOM
-
2026-05-30days on market $100,000 Active 8 DOM
-
2026-05-22$100,000 Active
ⓘ Source: listings_history table (triggers on properties + properties_extension) + one-shot
backfill from property_details.listing_events for pre-trigger history.
Climate risk First Street
- Flood 1/10 Low FEMA zone X (unshaded) · 0% chance over 30 yrs
- Wildfire 3/10 Moderate
- Heat 4/10 Moderate 7 d/yr ≥106°F today · 18 d/yr by 30 yrs out
- Wind 2/10 Low 3% chance of damaging wind over 30 yrs
- Air quality 2/10 Low 1 unhealthy d/yr today · 2 by 30 yrs out
Nearby sold comps map
Loading sold comps map…
Walkable amenities ~0.75 mi
Loading nearby amenities…
Taxation est. · year 1
- Rental income
- $11,704
- − Mortgage interest
- −$5,602
- − Property taxes
- −$1,500
- − Insurance
- −$500
- − Repairs & maintenance
- −$936
- − Management
- −$936
- − HOA
- −$96
- − Depreciation
- −$2,909
- Taxable loss
- −$775
- Est. tax savings @ 24.0%
- +$186
- After-tax cash flow
- $1,044/yr
For passive investors: Depreciation is non-cash, so a rental often shows a tax loss while cash-flowing — sheltering income. Rental losses are passive: they offset passive income freely, and up to $25,000/yr can offset ordinary (W-2) income if you actively participate and your MAGI is under $100k (phasing out to $0 by $150k); unused losses carry forward. On sale, claimed depreciation is recaptured at up to 25%, and gains may owe capital-gains tax (a 1031 exchange can defer both). Figures are a year-1 estimate at your 24.0% rate — not tax advice; consult a CPA.
Schools (NCES district)
- District
- Edmonson County
- NCES district ID
- 2101620
- Math proficiency
- 31% ▼ -26.00%
- Reading proficiency
- 43% ▼ -18.00%
- Median HH income
- $38,615
- Composite
- 30.88/100
- National rank
- #6119
- State rank
- #53 of 165 in KY
Livability — Brownsville
- Score
- 66/100
- State rank
- #234
- US rank
- #11426
Category grades
Schools grade is shown separately in the Schools card above.
Census & demographics
- Population (ZIP)
- 1,111
Population outlook (Edmonson County) Hauer SSP2
- Today (2025)
- 12,032 people
- By 2030
- 11,768 · -2.2%
- By 2040
- 11,038 · -8.3%
- By 2050
- 10,147 · -15.7%
- By 2075
- 8,085 · -32.8%
- By 2100
- 6,540 · -45.6%
Race, ethnicity, and origin ACS 2023
- Neighborhood character
- Predominantly White (95%)
- Race & ethnicity
- White 95% Black 3% Two or more races 1%
- Common ancestry
- Slovak 4% Serbian 1%
- Foreign-born
- 2% · Canada
- Languages at home
- 95% English-only · Spanish 3% German/W. Germanic 1%
Political lean MEDSL · Edmonson
- 2024 margin
- Solid R (+62.9) · D 17.9% · R 80.8% · Other 1.3%
- 2008→2024 swing
- -26.7pp toward R · 2008: -36.2pp · 2024: -62.9pp
- All cycles
- 2024: R+62.9 2020: R+58.7 2016: R+60.2 2012: R+39.8 2008: R+36.2
Not yet ingested
- Civics
- —
Market trends
- HPI YoY
- ▲ 2.06%
- Current HPI
- 116.3767
- Rent YoY
- —
- Metro
- —
- State GDP YoY
- ▲ 1.81%
- F500 in state
- 4
Industry mix (Fortune 500 HQ in KY)
| Industry | F500 HQs | Revenue |
|---|---|---|
| Healthcare | 1 | $118B |
|
||
| Food / Beverage | 1 | $7B |
|
||
Price history
1 event — show timeline
- 2026-05-22 Listed $100,000 Metro Search MLS
Property tax history
+4.5%/yrLatest (2025): $173 · +9.8% YoY. Source: county tax records.
Cash-flow waterfall
monthlySold comps — $/sqft
last 12 mo · ≤1 miLoading sold comps…