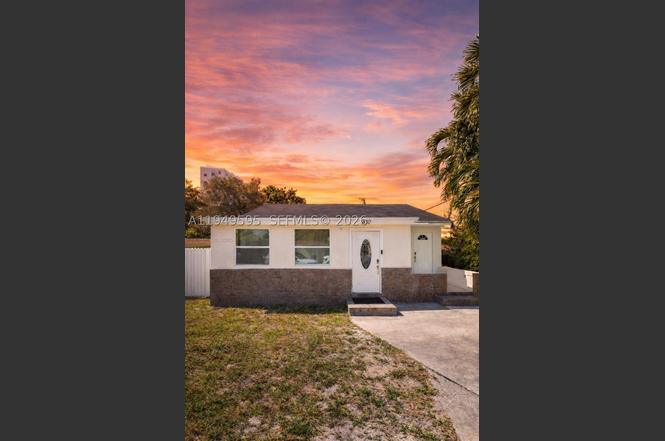
810 NW 21st Ct · Miami, FL
Flood risk 7/10 · Major
- FEMA flood zone
- X (unshaded)
- Chance of flooding over 30 yrs
- 0.74%
- Est. flood insurance / yr
- $507 – $1,088
Fire risk 1/10 · Minimal
- Est. fire insurance / yr
- $947 – $1,759
Heat risk 10/10 · Severe
- Hot days now (above 104°F)
- 7 days/yr
- Hot days in 30 yrs
- 25 days/yr
Wind risk 10/10 · Severe
- Chance of severe wind over 30 yrs
- 99.0%
Air-quality risk 2/10 · Minimal
- Unhealthy air days now
- 1 days/yr
- Unhealthy air days in 30 yrs
- 1 days/yr
Risk factors via First Street. Map © Google.
Why this score? — see what drove the D grade
The composite is a weighted blend of 9 inputs, each scored 0–100. Each bar is that input's sub-score; the figure is the points it added to the 100-point composite (weight × sub-score).
- Cash flow +13.0/30.0
- ARV discount +10.5/15.0
- Schools +4.2/10.0
- DSCR +3.9/10.0
- Livability +3.9/5.0
- 1% rule +3.6/10.0
- Condition / age +2.5/5.0
- Rent growth +2.2/5.0
- Appreciation +0.0/10.0
$564,999
🖨 Deal sheet (PDF) 📄 Offer letter ✓ Due diligence
Listing remarks
Discover this beautifully charming single-family home that perfectly blends modern comfort with timeless character. The spacious living areas invite relaxation, while the serene backyard offers the ideal setting for gatherings or quiet moments at home. Located just minutes from the vibrant culture, dining, and entertainment of Little Havana, this property delivers both convenience and lifestyle. A prime Miami location for those seeking comfort, charm, and accessibility. Schedule your private tour today and experience the potential of calling this place home.
Key facts
- Prime miami location
- Serene backyard
- 5,000 sq ft lot
Tags
Property features AI
Finance
- Financial info: Pets allowed (no restrictions)
Exterior
- Parking: Circular driveway; Detached carport; Detached garage; On-street parking
- Utilities: Public water
- Home design: Single-story; Faces east; Effective year built noted
- Construction: Block, frame and stucco construction; Shingle roof; 1 story
- Exterior features: Fence; Open patio; Patio; Porch; Apartment (other structure)
Interior
- Kitchen: Dishwasher; Electric range; Microwave; Icemaker; Refrigerator
- Bedrooms: Studio
- Flooring: Marble
- Bathrooms: 2 full bathrooms
- Heating & cooling: Central heating; Central air
- Interior features: Breakfast bar; Breakfast area; Kitchen/dining combo; Living/dining room; First floor entry; Bedroom on main level; Unfurnished
- Laundry & utility: Washer hookup; Dryer hookup; Washer; Dryer; Electric water heater
Neighborhood map
What this means for you Summary
Snapshot
- This is a 2-bed/1.0-bath single-family listed at $565k.
Deal economics
- At list price, monthly cash flow is $-100 ($-1k/yr) — negative.
- To cash-flow at today's rent, offer at most $547k (3.1% below list).
- To meet the 1% rule (rent ≥ 1% of price), the offer needs to be $489k (13.5% below list).
- Recommended offer: $489k (13.5% below list) — sets the bar for 1% rule.
- Cap rate 6.2% vs local median 1.9% in Miami — top-decile yield for the area; either an underpriced asset or a hidden risk that comps aren't pricing in. Stress-test before assuming the spread holds.
Location & tenants
- Location reads 78/100 on livability (#177 in FL, #2,724 nationally) — a middle-class / working-renter tenant base. Strengths: amenities A+, commute A+, health & safety A+; Watch: employment C-, crime F, cost of living F.
- Miami-Dade (suburban): math 45% / reading 54% proficiency, ranked #40 of 73 in FL (top 55%) — families likely to look elsewhere, expect single-tenant / working-renter base with shorter leases; 64% free/reduced lunch — lower-income household profile, screen leases tightly.
- Zoned schools: Citrus Grove Elementary School (math 27% / reading 35%, grade F, #1,854 of 2,144 statewide, top 87%, 866 students, 65% FRL); Citrus Grove Middle School (math 19% / reading 21%, grade F, #558 of 571 statewide, top 98%, 781 students, 66% FRL); Miami Jackson Senior High School (math 13% / reading 22%, grade F, #575 of 667 statewide, top 86%, 1,305 students, 62% FRL) — zoned schools at 65% FRL track the district average.
- Zoned-school proficiency averages 23% at this address vs 50% district-wide (-27 pts) — the specific schools serving this property underperform the Miami-Dade average; the district grade overstates school quality for this exact location.
- Market conditions: Rents soft (-1.4%/yr); 241 active listings in the ZIP; lower-income renter base — watch delinquency; 10,051 units permitted in Miami-Dade County in 2024 (7,758 in 5+ unit buildings).
Forward outlook
- Local home prices are declining (-3.0%/yr); year-one equity from $4k of loan paydown is wiped out by about $17k of value loss. Plan a longer hold.
- Miami-Dade County population projected at +28% by 2050 — long-run rental-demand tailwind backs the buy-and-hold thesis.
Negotiation context
- It's been on market 149 days — a 12% lower offer ($497k) is reasonable based on typical stale-listing flexibility.
- 10 sale attempts since 4y ago with the ask held roughly flat each time — persistent listings suggest the price (not the market) is what's stuck; bring a comps-based counter.
- Current owner paid $450k; 26% above their basis — modest negotiation headroom, anchor on the comps not their cost.
Risks & watch-outs
- Watch-outs: flood insurance adds $66/mo; built in 1947 — expect roof / HVAC / electrical / plumbing capex.
- Climate carrying-cost: major flood risk; severe wind risk, 99% chance of damaging wind over 30y; extreme-heat days projected 7→25/yr by 2055 (HVAC capex compounding) — expect insurance premiums to compound above CPI over the hold.
Questions for the listing agent
- What do current leases actually rent for vs. the listed asking? Can we see a recent rent roll and the last 12 months of T-12 income?
- It's been on market 149 days. Have you received any prior offers? Is the seller open to a 14% concession, seller financing, or rate buy-down credit?
- Built in 1947 — when were the roof, HVAC, electrical panel, plumbing, and water heater last replaced?
- What's the actual annual flood-insurance premium (NFIP or private), and is the property in a SFHA with mandatory coverage?
- Why hasn't it sold? Are there any deal-killer items the seller is aware of (foundation, flood, title, zoning, code violations)?
- Is there a deadline driving the sale (1031 exchange, divorce, estate, relocation)? That informs how much negotiation room exists.
- Schools are B-rated — typically a magnet for longer-tenancy family renters. What's the average tenant stay here, and is there a school-zone premium baked into asking?
- Crime grade is F in this area — have there been break-ins, vandalism, or insurance claims at this property in the last 3 years? What carrier currently insures it and at what premium?
- The area grade is low — what's the realistic commute time and amenity access for the typical tenant pool here? Any planned neighborhood developments (good or bad) we should know about?
- What's the average days-on-market for RENTAL listings here right now (not sales)? A rising rental-DOM trend means longer vacancies and softer asking-rent achievability than the comps imply.
- What's the recent tenant-quality profile in this submarket — average credit score on applications, eviction rate, late-payment / NSF rate, and stable-employment percentage? A property-management company in the area should have these aggregated.
- How much new for-sale + rental construction is in the pipeline within 1–3 miles? Heavy new supply typically softens prices + rents 12–24 months out; constrained supply supports both.
Investment metrics
- 1% rule
- 0.86% ✗
- Cap rate
- 6.22%
- Cash-on-cash
- -0.25%
- DSCR
- 0.99
- GRM
- 9.6
CMA / ARV
- ARV (on-the-fly)
- $605,901
- Comps found
- 2
Show comp detail 2 sales within ~0.75 mi
| Address | Dist | Beds/Ba | Sqft | Sold | Price | $/sf | Match |
|---|---|---|---|---|---|---|---|
| 1040 NW 28th Ave | 0.67mi | 2/1.0 | 1,444 (-1%) | 5mo | $460,000 | $319 | 63 |
| 871 NW 17th Ct | 0.47mi | 3/2.0 (+1) | 1,558 (+7%) | 4mo | $650,000 | $417 | 54 |
Match score weights: distance 35% · size 25% · config 20% · recency 20%. Top-matched comps best support the ARV.
Projected returns pro-forma
-3.0% appreciation · 0.0% rent growth · sell at horizon
- IRR
- -21.0%
- Equity multiple
- 0.29×
- Total profit
- $-112,133
- Equity at exit
- $84,243
- IRR
- -23.6%
- Equity multiple
- -0.02×
- Total profit
- $-160,740
- Equity at exit
- $48,851
Cash invested: $158,200 (down + closing). Projections, not guarantees.
Landlord ↔ Tenant lean methodology
- Overall (STATE)
- 87 Strongly Landlord-Friendly
- State Florida
- 87 Strongly Landlord-Friendly · R+3
- County
- — inherits STATE
- City
- — inherits STATE
ZIP-level market 33125
- Rents YoY
- -1.4%
- Active inventory
- 241
- Price-to-rent
- 9.6×
Monthly cashflow live
- Estimated rent
- $4,886 medium interval (Pro) →
- Mortgage (P&I)
- −$2,963
- Tax from tax record
- −$695 /mo · $8,338/yr
- Insurance
- −$235
- Flood insurance flood zone
- −$66 /mo · $798/yr
- HOA
- −$0
- Vacancy / Maint / Mgmt
- −$1,026
- Net cashflow
- $-100
Break-even live
Sensitivity live
| Price | -10% $220 | -5% $60 | +0% $-100 | +5% $-260 | +10% $-420 |
|---|---|---|---|---|---|
| Rent | -10% $-486 | -5% $-293 | +0% $-100 | +5% $93 | +10% $286 |
| Rate | -1.0pp $185 | -0.5pp $44 | base $-100 | +0.5pp $-246 | +1.0pp $-395 |
UW: 25.0% down · 7.5% · 30yr · 1.5% tax · 5.0% vac · 8.0% maint · 8.0% mgmt
Financing live
Cash to close
- Down payment
- $141,250
- Closing costs
- $16,950
- Reserves months
- —
- Total cash needed
- —
Loan-product check · same deal, 3 products live
Conventional
25% down · 7.5% · 30yr
- Down + closing
- —
- Monthly P&I
- —
- Monthly cashflow
- —
- DSCR
- —
- Eligible?
- —
Personal DTI + credit; lowest rate.
DSCR
20% down · 8.5% · 30yr
- Down + closing
- —
- Monthly P&I
- —
- Monthly cashflow
- —
- DSCR
- —
- Eligible?
- —
No personal income docs; deal must DSCR.
Hard money
10% down · 12.0% · 12mo
- Down + closing
- —
- Monthly P&I
- —
- Monthly cashflow
- —
- DSCR
- —
- Eligible?
- —
Short-term bridge; refi at stabilization.
Listing history 47 events
-
2026-06-18days on market $564,999 Active 149 DOM
-
2026-06-17days on market $564,999 Active 148 DOM
-
2026-06-16days on market $564,999 Active 147 DOM
-
2026-06-15days on market $564,999 Active 146 DOM
-
2026-06-13days on market $564,999 Active 144 DOM
-
2026-06-09days on market $564,999 Active 140 DOM
-
2026-06-08days on market $564,999 Active 139 DOM
-
2026-06-07days on market $564,999 Active 138 DOM
-
2026-06-04days on market $564,999 Active 135 DOM
-
2026-06-03days on market $564,999 Active 134 DOM
-
2026-06-02days on market $564,999 Active 133 DOM
-
2026-06-01days on market $564,999 Active 132 DOM
-
2026-05-31days on market $564,999 Active 131 DOM
-
2026-02-10price $564,999
-
2026-01-20$565,000 Active
-
2024-11-16historical
-
2024-10-10$525,000 Active
-
2024-10-09historical
-
2024-08-22price $524,999
-
2024-06-06price $538,990
-
2024-05-28price $539,001
-
2024-05-14price $539,000
-
2024-04-26price $546,399
-
2024-04-09$546,610 Active
-
2024-02-26historical
-
2024-02-19price $564,900
-
2024-02-15price $569,900
-
2024-02-09price $579,900
-
2024-02-02$584,900 Active
-
2022-07-25soldstatus $450,000
-
2022-07-19soldstatus $450,000 Closed
-
2022-06-24status Pending
-
2022-06-14$450,000 Active
-
2022-06-12historical
-
2022-06-07price $460,000
-
2022-06-03status Active
-
2022-05-16historical Active Under Contract
-
2022-05-12status Active
-
2022-05-11historical Active Under Contract
-
2022-05-07status Active
-
2022-05-05historical Active Under Contract
-
2022-04-24$475,000 Active
-
2022-03-02soldstatus $285,000
-
2022-02-18soldstatus $285,000 Closed
-
2022-01-16status Pending
-
2022-01-11$295,000 Active
-
1999-03-17soldstatus $65,000
ⓘ Source: listings_history table (triggers on properties + properties_extension) + one-shot
backfill from property_details.listing_events for pre-trigger history.
Tax reassessment forecast FL · Resets to sale price
- Current annual tax
- $8,338 · $695/mo
- Projected year-2 tax
- $8,338 · $695/mo
- Expected delta
- $0/yr ($0/mo · 0.0%)
ⓘ Screening estimate from a state-policy table — verify with the county assessor before closing.
Climate risk First Street
- Flood 7/10 Severe FEMA zone X (unshaded) · 74% chance over 30 yrs
- Wildfire 1/10 Low
- Heat 10/10 Extreme 7 d/yr ≥104°F today · 25 d/yr by 30 yrs out
- Wind 10/10 Extreme 99% chance of damaging wind over 30 yrs
- Air quality 2/10 Low 1 unhealthy d/yr today · 1 by 30 yrs out
Nearby sold comps map
Loading sold comps map…
Walkable amenities ~0.75 mi
Loading nearby amenities…
Taxation est. · year 1
- Rental income
- $58,627
- − Mortgage interest
- −$31,649
- − Property taxes
- −$8,338
- − Insurance
- −$3,622
- − Repairs & maintenance
- −$4,690
- − Management
- −$4,690
- − Depreciation
- −$16,436
- Taxable loss
- −$10,799
- Est. tax savings @ 24.0%
- +$2,592
- After-tax cash flow
- $1,392/yr
For passive investors: Depreciation is non-cash, so a rental often shows a tax loss while cash-flowing — sheltering income. Rental losses are passive: they offset passive income freely, and up to $25,000/yr can offset ordinary (W-2) income if you actively participate and your MAGI is under $100k (phasing out to $0 by $150k); unused losses carry forward. On sale, claimed depreciation is recaptured at up to 25%, and gains may owe capital-gains tax (a 1031 exchange can defer both). Figures are a year-1 estimate at your 24.0% rate — not tax advice; consult a CPA.
Schools (NCES district)
- District
- Miami-Dade
- NCES district ID
- 1200390
- Math proficiency
- 45% ▼ -16.00%
- Reading proficiency
- 54% ▼ -5.00%
- Median HH income
- $43,928
- Composite
- 41.76/100
- National rank
- #3397
- State rank
- #40 of 73 in FL
Livability — Miami
- Score
- 78/100
- State rank
- #177
- US rank
- #2724
Category grades
Schools grade is shown separately in the Schools card above.
Census & demographics
- Census place
- Miami, FL
- County
- Miami-Dade County · 2,697,751 people
- City population
- 827,308
- Metro
- Miami-Fort Lauderdale-Pompano Beach, FL
- Population (ZIP)
- 56,897
- Household income
- $44,979
- Rent vs Own
- Severe rent burden
- 5223.0
Population outlook (Miami-Dade County) Hauer SSP2
- Today (2025)
- 3,126,439 people
- By 2030
- 3,325,765 · +6.4%
- By 2040
- 3,697,561 · +18.3%
- By 2050
- 4,012,134 · +28.3%
- By 2075
- 4,605,612 · +47.3%
- By 2100
- 4,866,598 · +55.7%
Race, ethnicity, and origin ACS 2023
- Neighborhood character
- Predominantly Hispanic (92%)
- Race & ethnicity
- Hispanic / Latino 92% Two or more races 52% White 4% Black 4%
- Hispanic origin (detail)
- Mexican 2% Puerto Rican 3% Cuban 46% Dominican 3% Salvadoran 1%
- Common ancestry
- Hispanic 1%
- Foreign-born
- 68% · Canada, Jamaica, Dominican Republic
- Languages at home
- 9% English-only · Spanish 90%
Political lean MEDSL · Miami-Dade
- 2024 margin
- R (+11.4) · D 43.9% · R 55.4%
- 2008→2024 swing
- -27.6pp toward R · 2008: 16.1pp · 2024: -11.4pp
- All cycles
- 2024: R+11.4 2020: D+7.3 2016: D+29.6 2012: D+23.7 2008: D+16.1
Not yet ingested
- Civics
- —
Market trends
- HPI YoY
- ▼ -402.98%
- Current HPI
- 476.1631
- Rent YoY
- ▼ -1.39%
- Metro
- Miami-Fort Lauderdale-Pompano Beach, FL
- State GDP YoY
- ▲ 3.28%
- F500 in state
- 36
Industry mix (Fortune 500 HQ in FL)
| Industry | F500 HQs | Revenue |
|---|---|---|
| Industrial Technology | 2 | $29B |
|
||
| Insurance | 2 | $17B |
|
||
| Retail | 1 | $60B |
|
||
| Technology Distribution | 1 | $58B |
|
||
| Homebuilding | 1 | $35B |
|
||
| Technology Manufacturing | 1 | $35B |
|
||
Price history
+769.2% since first listed34 events — show timeline
- 2026-02-10 Price Changed $564,999 MARMLS
- 2026-01-20 Listed $565,000 MARMLS
- 2024-11-16 Listing Removed — MARMLS
- 2024-10-10 Listed $525,000 MARMLS
- 2024-10-09 Listing Removed — MARMLS
- 2024-08-22 Price Changed $524,999 MARMLS
- 2024-06-06 Price Changed $538,990 MARMLS
- 2024-05-28 Price Changed $539,001 MARMLS
- 2024-05-14 Price Changed $539,000 MARMLS
- 2024-04-26 Price Changed $546,399 MARMLS
- 2024-04-09 Listed $546,610 MARMLS
- 2024-02-26 Listing Removed — MARMLS
- 2024-02-19 Price Changed $564,900 MARMLS
- 2024-02-15 Price Changed $569,900 MARMLS
- 2024-02-09 Price Changed $579,900 MARMLS
- 2024-02-02 Listed $584,900 MARMLS
- 2022-07-25 Sold (Public Records) $450,000 Public Records
- 2022-07-19 Sold (MLS) $450,000 MARMLS
- 2022-06-24 Pending — MARMLS
- 2022-06-14 Listed $450,000 MARMLS
- 2022-06-12 Listing Removed — MARMLS
- 2022-06-07 Price Changed $460,000 MARMLS
- 2022-06-03 Relisted — MARMLS
- 2022-05-16 Contingent — MARMLS
- 2022-05-12 Relisted — MARMLS
- 2022-05-11 Contingent — MARMLS
- 2022-05-07 Relisted — MARMLS
- 2022-05-05 Contingent — MARMLS
- 2022-04-24 Listed $475,000 MARMLS
- 2022-03-02 Sold (Public Records) $285,000 Public Records
- 2022-02-18 Sold (MLS) $285,000 MARMLS
- 2022-01-16 Pending — MARMLS
- 2022-01-11 Listed $295,000 MARMLS
- 1999-03-17 Sold (Public Records) $65,000 Public Records
Property tax history
+10.7%/yrLatest (2025): $8,338 · +10.8% YoY. Source: county tax records.
Cash-flow waterfall
monthlySold comps — $/sqft
last 12 mo · ≤1 miLoading sold comps…