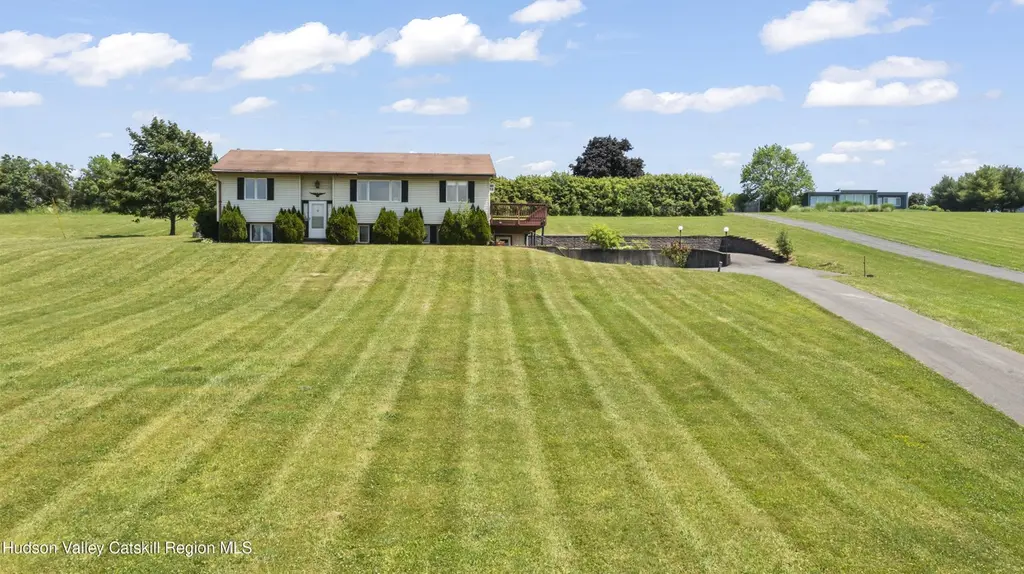
126 Hover Ave · Germantown, NY
Flood risk 1/10 · Minimal
- FEMA flood zone
- X
- Chance of flooding over 30 yrs
- 0.0%
- Est. flood insurance / yr
- $473 – $860
Fire risk 4/10 · Minor
- Est. fire insurance / yr
- $691 – $1,283
Heat risk 4/10 · Minor
- Hot days now (above 98°F)
- 7 days/yr
- Hot days in 30 yrs
- 16 days/yr
Wind risk 4/10 · Minor
- Chance of severe wind over 30 yrs
- 10.0%
Air-quality risk 2/10 · Minimal
- Unhealthy air days now
- 0 days/yr
- Unhealthy air days in 30 yrs
- 1 days/yr
Risk factors via First Street. Map © Google.
Why this score? — see what drove the C- grade
The composite is a weighted blend of 9 inputs, each scored 0–100. Each bar is that input's sub-score; the figure is the points it added to the 100-point composite (weight × sub-score).
- Cash flow +12.6/30.0
- Appreciation +10.0/10.0
- ARV discount +7.5/15.0
- Schools +4.8/10.0
- DSCR +3.8/10.0
- Livability +3.5/5.0
- 1% rule +3.1/10.0
- Rent growth +2.5/5.0
- Condition / age +2.5/5.0
$365,000
🖨 Deal sheet 📄 Offer letter ✓ Due diligence
Listing remarks
Germantown Ranch with beautiful Catskill Mountain views makes for a wonderful opportunity to invest in the improvements needed for this home to become exactly what you want it to be. Custom built in 1983, the structure of the home includes a spacious living room overlooking the view, formal dining room, country kitchen, primary bedroom with half bath, guest bedroom, full bath and laundry area on the upper level. The walk-out lower level includes 2 additional bedrooms and another full bath as well as 3 garage spaces. Central air conditioning. Large wraparound open deck. Driveway access from both levels.
Key facts
- Country kitchen
- Formal dining room
- Guest bedroom
Tags
Property features AI
Exterior
- Parking: Attached garage with 3 spaces; Garage faces side; Paved driveway
- Utilities: Private well water; Septic tank sewer; Electric with circuit breakers
- Home design: Single-family house; One level; Concrete perimeter foundation
- Construction: Asphalt shingle roof
- Exterior features: Wrap-around deck; Property has views; Sloped, gently sloping lot; County road frontage
Interior
- Kitchen: Dishwasher; Range
- Bedrooms: Master bedroom located downstairs
- Flooring: Other
- Bathrooms: Two full bathrooms; One half bathroom
- Heating & cooling: Baseboard heating (electric); Central air conditioning
- Interior features: Primary bedroom on the main level; Partially finished basement with storage space and walk-out access
- Laundry & utility: Laundry room; Washer
Neighborhood map
What this means for you Summary
Snapshot
- This is a 2-bed/1.5-bath single-family listed at $365k.
Deal economics
- At list price, monthly cash flow is $-47 ($-558/yr) — negative.
- To cash-flow at today's rent, offer at most $357k (2.3% below list).
- To meet the 1% rule (rent ≥ 1% of price), the offer needs to be $297k (18.6% below list).
- Recommended offer: $297k (18.6% below list) — sets the bar for 1% rule.
Location & tenants
- Location reads 70/100 on livability (#441 in NY) — a middle-class / working-renter tenant base. Strengths: crime A+, housing A+, employment A; Watch: cost of living D, amenities F, commute F.
- Germantown Central School District (rural): math 54% / reading 51% proficiency, ranked #387 of 755 in NY (top 51%) — acceptable for families but not a draw, mixed tenant base, ~2y average lease.
- Market conditions: 40 active listings in the ZIP; 136 units permitted in Columbia County in 2024 (0 in 5+ unit buildings).
Forward outlook
- In year one you build about $39k of equity ($3k loan paydown + $36k appreciation (10.0% local appreciation)).
- Columbia County population projected at -22% by 2050 — secular population decline; favor cash flow + early exit over multi-decade hold.
- At projected returns (10.0% appreciation + 3.0% rent growth), your $102k cash investment doubles in ~3 years — after that, you're playing with house money.
- By year 2, paydown + projected appreciation supports a ~$63k cash-out refi (75% LTV) — recoverable capital for the next deal without selling this one.
Negotiation context
- Only 7 days on market — expect competitive offers; lowballing is unlikely to land.
Questions for the listing agent
- What do current leases actually rent for vs. the listed asking? Can we see a recent rent roll and the last 12 months of T-12 income?
- Is there a deadline driving the sale (1031 exchange, divorce, estate, relocation)? That informs how much negotiation room exists.
- Schools are B-rated — typically a magnet for longer-tenancy family renters. What's the average tenant stay here, and is there a school-zone premium baked into asking?
- What's the average days-on-market for RENTAL listings here right now (not sales)? A rising rental-DOM trend means longer vacancies and softer asking-rent achievability than the comps imply.
- What's the recent tenant-quality profile in this submarket — average credit score on applications, eviction rate, late-payment / NSF rate, and stable-employment percentage? A property-management company in the area should have these aggregated.
- How much new for-sale + rental construction is in the pipeline within 1–3 miles? Heavy new supply typically softens prices + rents 12–24 months out; constrained supply supports both.
Investment metrics
- 1% rule
- 0.81% ✗
- Cap rate
- 6.14%
- Cash-on-cash
- -0.55%
- DSCR
- 0.98
- GRM
- 10.2
CMA / ARV
- ARV (on-the-fly)
- $1,320,528
- Comps found
- 1
Show comp detail 1 sale within ~0.75 mi
| Address | Dist | Beds/Ba | Sqft | Sold | Price | $/sf | Match |
|---|---|---|---|---|---|---|---|
| 39 Dales Bridge Rd | 0.57mi | 2/2.5 | 1,865 (-5%) | 20mo | $1,252,000 | $671 | 44 |
Match score weights: distance 35% · size 25% · config 20% · recency 20%. Top-matched comps best support the ARV.
Projected returns pro-forma
10.0% appreciation · 3.0% rent growth · sell at horizon
- IRR
- 23.9%
- Equity multiple
- 2.92×
- Total profit
- $195,791
- Equity at exit
- $328,821
- IRR
- 21.2%
- Equity multiple
- 6.66×
- Total profit
- $578,832
- Equity at exit
- $709,115
Cash invested: $102,200 (down + closing). Projections, not guarantees.
Landlord ↔ Tenant lean methodology
- Overall (STATE)
- 15 Strongly Tenant-Friendly
- State New York
- 15 Strongly Tenant-Friendly · D+10
- County
- — inherits STATE
- City
- — inherits STATE
ZIP-level market 12526
- Home prices YoY
- 8.9%
- Active inventory
- 40
- Price-to-rent
- 10.2×
Monthly cashflow live
- Estimated rent
- $2,969 medium interval (Pro) →
- Mortgage (P&I)
- −$1,914
- Tax from tax record
- −$326 /mo · $3,915/yr
- Insurance
- −$152
- HOA
- −$0
- Vacancy / Maint / Mgmt
- −$624
- Net cashflow
- $-47
Break-even live
UW: 25.0% down · 7.5% · 30yr · 1.5% tax · 5.0% vac · 8.0% maint · 8.0% mgmt
Financing live
Cash to close
- Down payment
- $91,250
- Closing costs
- $10,950
- Reserves months
- —
- Total cash needed
- —
Loan-product check · same deal, 3 products live
Conventional
25% down · 7.5% · 30yr
- Down + closing
- —
- Monthly P&I
- —
- Monthly cashflow
- —
- DSCR
- —
- Eligible?
- —
Personal DTI + credit; lowest rate.
DSCR
20% down · 8.5% · 30yr
- Down + closing
- —
- Monthly P&I
- —
- Monthly cashflow
- —
- DSCR
- —
- Eligible?
- —
No personal income docs; deal must DSCR.
Hard money
10% down · 12.0% · 12mo
- Down + closing
- —
- Monthly P&I
- —
- Monthly cashflow
- —
- DSCR
- —
- Eligible?
- —
Short-term bridge; refi at stabilization.
Listing history 7 events
-
2026-06-19days on market $365,000 Active 7 DOM
-
2026-06-18days on market $365,000 Active 6 DOM
-
2026-06-17days on market $365,000 Active 5 DOM
-
2026-06-16days on market $365,000 Active 4 DOM
-
2026-06-15days on market $365,000 Active 3 DOM
-
2026-06-13remarks 610-char remark
-
2026-06-13$365,000 Active 1 DOM
ⓘ Source: listings_history table (triggers on properties + properties_extension) + one-shot
backfill from property_details.listing_events for pre-trigger history.
Tax reassessment forecast NY · Partial reset (capped growth)
- Current annual tax
- $3,915 · $326/mo
- Projected year-2 tax
- $5,042 · $420/mo
- Expected delta
- +$1,127/yr (+$94/mo · 28.8%)
ⓘ Screening estimate from a state-policy table — verify with the county assessor before closing.
Climate risk First Street
- Flood 1/10 Low FEMA zone X · 0% chance over 30 yrs
- Wildfire 4/10 Moderate
- Heat 4/10 Moderate 7 d/yr ≥98°F today · 16 d/yr by 30 yrs out
- Wind 4/10 Moderate 10% chance of damaging wind over 30 yrs
- Air quality 2/10 Low 0 unhealthy d/yr today · 1 by 30 yrs out
Nearby sold comps map
Loading sold comps map…
Walkable amenities ~0.75 mi
Loading nearby amenities…
Taxation est. · year 1
- Rental income
- $35,634
- − Mortgage interest
- −$20,446
- − Property taxes
- −$3,915
- − Insurance
- −$1,825
- − Repairs & maintenance
- −$2,851
- − Management
- −$2,851
- − Depreciation
- −$10,618
- Taxable loss
- −$6,871
- Est. tax savings @ 24.0%
- +$1,649
- After-tax cash flow
- $1,091/yr
For passive investors: Depreciation is non-cash, so a rental often shows a tax loss while cash-flowing — sheltering income. Rental losses are passive: they offset passive income freely, and up to $25,000/yr can offset ordinary (W-2) income if you actively participate and your MAGI is under $100k (phasing out to $0 by $150k); unused losses carry forward. On sale, claimed depreciation is recaptured at up to 25%, and gains may owe capital-gains tax (a 1031 exchange can defer both). Figures are a year-1 estimate at your 24.0% rate — not tax advice; consult a CPA.
Schools (NCES district)
- District
- Germantown Central School District
- NCES district ID
- 3612030
- Math proficiency
- 54% ▲ 1.00%
- Reading proficiency
- 51% ▼ -2.00%
- Median HH income
- $60,242
- Composite
- 47.76/100
- National rank
- #4894
- State rank
- #387 of 755 in NY
Livability — Germantown
- Score
- 70/100
- State rank
- #441
- US rank
- #7728
Category grades
Schools grade is shown separately in the Schools card above.
Census & demographics
- Population (ZIP)
- 3,427
Population outlook (Columbia County) Hauer SSP2
- Today (2025)
- 58,662 people
- By 2030
- 56,557 · -3.6%
- By 2040
- 51,324 · -12.5%
- By 2050
- 45,790 · -21.9%
- By 2075
- 35,232 · -39.9%
- By 2100
- 25,846 · -55.9%
Race, ethnicity, and origin ACS 2023
- Neighborhood character
- Predominantly White (84%)
- Race & ethnicity
- White 84% Two or more races 8% Hispanic / Latino 6% Black 3%
- Hispanic origin (detail)
- Mexican 1% Puerto Rican 3% Cuban 1%
- Common ancestry
- Romanian 5% Lithuanian 4% Iranian 3%
- Foreign-born
- 8% · Canada, South Korea
- Languages at home
- 93% English-only · Spanish 4% Russian/Polish/Slavic 1% German/W. Germanic 1%
Political lean MEDSL · Columbia
- 2024 margin
- D (+14.7) · D 57.4% · R 42.6%
- 2008→2024 swing
- +1.3pp toward D · 2008: 13.4pp · 2024: 14.7pp
- All cycles
- 2024: D+14.7 2020: D+16.7 2016: D+1.4 2012: D+11.7 2008: D+13.4
Not yet ingested
- Civics
- —
Market trends
- HPI YoY
- ▲ 41.93%
- Current HPI
- 511.9627
- Rent YoY
- —
- Metro
- —
- State GDP YoY
- ▲ 2.60%
- F500 in state
- 92
Industry mix (Fortune 500 HQ in NY)
| Industry | F500 HQs | Revenue |
|---|---|---|
| Financial Services | 10 | $950B |
|
||
| Consumer Goods | 9 | $162B |
|
||
| Insurance | 4 | $225B |
|
||
| Telecommunications | 2 | $144B |
|
||
| Pharmaceuticals | 2 | $112B |
|
||
| Media / Entertainment | 2 | $69B |
|
||
Price history
1 event — show timeline
- 2026-06-11 Listed $365,000 HVCRMLS
Property tax history
+14.5%/yrLatest (2025): $3,915 · +4.0% YoY. Source: county tax records.
Cash-flow waterfall
monthlySold comps — $/sqft
last 12 mo · ≤1 miLoading sold comps…