400 E 70th St #1108 · New York, NY
Flood risk 1/10 · Minimal
- FEMA flood zone
- X (unshaded)
- Chance of flooding over 30 yrs
- 0.0%
- Est. flood insurance / yr
- $507 – $1,088
Fire risk 1/10 · Minimal
- Est. fire insurance / yr
- $691 – $1,283
Heat risk 6/10 · Moderate
- Hot days now (above 99°F)
- 7 days/yr
- Hot days in 30 yrs
- 15 days/yr
Wind risk 6/10 · Moderate
- Chance of severe wind over 30 yrs
- 27.0%
Air-quality risk 4/10 · Minor
- Unhealthy air days now
- 5 days/yr
- Unhealthy air days in 30 yrs
- 6 days/yr
Risk factors via First Street. Map © Google.
Why this score? — see what drove the D grade
The composite is a weighted blend of 9 inputs, each scored 0–100. Each bar is that input's sub-score; the figure is the points it added to the 100-point composite (weight × sub-score).
- Appreciation +7.9/10.0
- ARV discount +7.5/15.0
- Cash flow +5.7/30.0
- Schools +5.0/10.0
- Rent growth +4.8/5.0
- Livability +3.8/5.0
- 1% rule +2.9/10.0
- Condition / age +2.5/5.0
- DSCR +0.1/10.0
$675,000
🖨 Deal sheet (PDF) 📄 Offer letter ✓ Due diligence
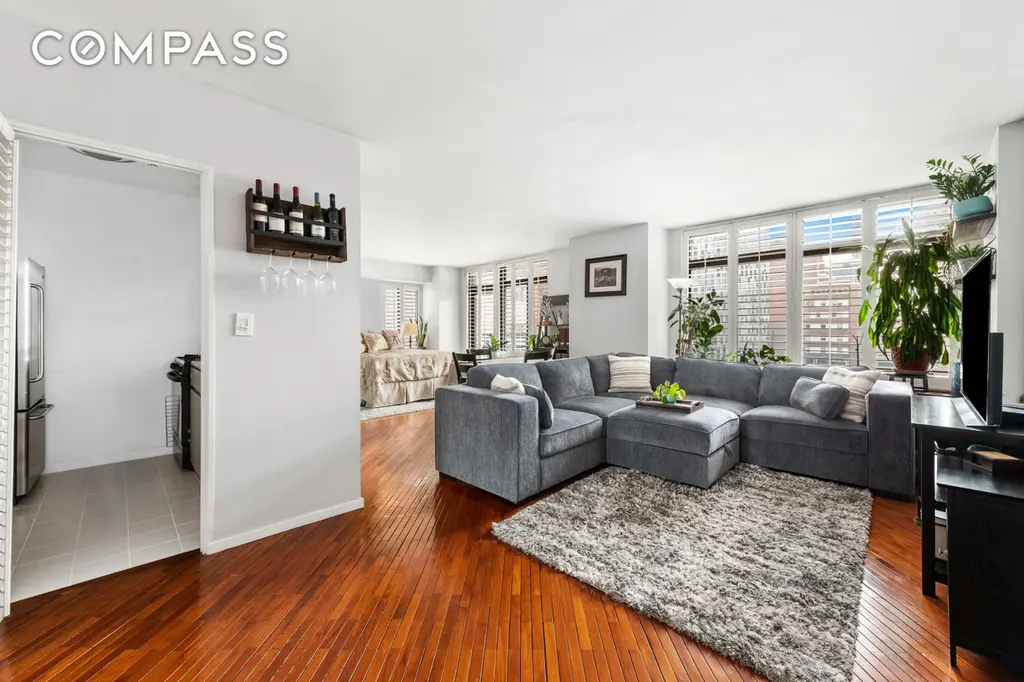
Listing remarks
Live beautifully at The Kingsley. Currently configured as an oversized, open studio, this bright and spacious home offers an easy conversion to a comfortable one-bedroom, along with a private balcony and open south- and east-facing city views. The flexible layout allows for clearly defined areas for living, dining, working from home, and sleeping, while generous closet space adds everyday functionality. The efficient galley kitchen features stainless steel appliances and a convenient pass-through to the living area, making cooking and entertaining feel seamless. A true extension of the home, the private balcony is large enough for outdoor dining, lounging, and container gardening — a
Key facts
- Private balcony
- Flexible layout
- Open city views
Tags
Property features AI
Finance
- Other: Pets are not allowed in the building
- HOA & community: Monthly association fee of $959; Building amenities include bike storage, common lounge, elevators, fitness center and health club; 216 total units in building
Exterior
- Parking: Garage parking available
- Utilities: Cooling available
- Home design: Located in a high-rise building (40 stories); Building name: The Kingsley; Unit entry level: 11
- Construction: High-rise construction
- Exterior features: Private balcony; Private outdoor space over 60 sqft; South exposure; Has view
Interior
- Kitchen: Stainless steel appliances
- Bedrooms: Entry level located on floor 11
- Flooring: Hardwood
- Bathrooms: 1 full bathroom
- Heating & cooling: Cooling present
- Interior features: Unfurnished; Hardwood floors; Stainless steel appliances
- Laundry & utility: Building has multiple laundry locations; Common on-floor laundry; Common area laundry
Neighborhood map
What this means for you Summary
Snapshot
- This is a 1-bed/1.0-bath condo listed at $675k.
Deal economics
- At list price, monthly cash flow is $-1k ($-17k/yr) — negative.
- To cash-flow at today's rent, offer at most $431k (36.2% below list).
- To meet the 1% rule (rent ≥ 1% of price), the offer needs to be $532k (21.2% below list).
- Recommended offer: $431k (36.2% below list) — sets the bar for cash-flow.
- Cap rate 3.8% vs local median 2.6% in New York — top-decile yield for the area; either an underpriced asset or a hidden risk that comps aren't pricing in. Stress-test before assuming the spread holds.
Location & tenants
- Location reads 75/100 on livability (#268 in NY, #4,188 nationally) — a middle-class / working-renter tenant base. Strengths: amenities A+, commute A+, health & safety A; Watch: crime F, cost of living F.
- Zoned schools: Elm Tree Elementary School (math 27% / reading 52%, grade F, #1,444 of 2,108 statewide, top 71%, 806 students, 94% FRL); Mark Twain Is 239 For The Gifted And Talented (math 90% / reading 96%, grade A+, #6 of 729 statewide, top 1%, 1,207 students, 44% FRL); Midwood High School (math 94% / reading 96%, grade A+, #83 of 1,100 statewide, top 8%, 4,062 students, 73% FRL).
- Market conditions: Rents rising fast (+9.1%/yr); 426 active listings in the ZIP; 40 comparable units currently listed for rent nearby; rentals at typical pace (median 18d on market — plan ~3-4 weeks tenant-placement turnaround); high-income renter base; 4,467 units permitted in New York County in 2024 (4,463 in 5+ unit buildings).
- This rent runs 40% of the median local income ($159k/yr) — at the standard rent-burdened threshold; future hikes will face affordability resistance.
Forward outlook
- In year one you build about $43k of equity ($5k loan paydown + $39k appreciation (5.7% local appreciation)).
- New York County population projected at +21% by 2050 — long-run rental-demand tailwind backs the buy-and-hold thesis.
- By year 2, paydown + projected appreciation supports a ~$69k cash-out refi (75% LTV) — recoverable capital for the next deal without selling this one.
Negotiation context
- It's been on market 45 days — a 3% lower offer ($655k) is reasonable based on typical stale-listing flexibility.
- 3 sale attempts since 6y ago with the ask held roughly flat each time — persistent listings suggest the price (not the market) is what's stuck; bring a comps-based counter.
- Current owner paid $188k; list at $675k implies a 258% gain — meaningful room to come down on a strong offer.
Risks & watch-outs
- Climate carrying-cost: major wind risk, 27% chance of damaging wind over 30y; extreme-heat days projected 7→15/yr by 2055 (HVAC capex compounding) — expect insurance premiums to compound above CPI over the hold.
Questions for the listing agent
- What do current leases actually rent for vs. the listed asking? Can we see a recent rent roll and the last 12 months of T-12 income?
- It's been on market 45 days. Have you received any prior offers? Is the seller open to a 36% concession, seller financing, or rate buy-down credit?
- What does the HOA fee cover, when was the last increase, and are there any pending special assessments or reserve-fund shortfalls?
- Any open or pending special assessments — roof, HVAC, plumbing, elevator, façade? What's the per-unit balance and payoff schedule, and is the seller paying it off at close or rolling it to the buyer?
- Is there a deadline driving the sale (1031 exchange, divorce, estate, relocation)? That informs how much negotiation room exists.
- Schools are B-rated — typically a magnet for longer-tenancy family renters. What's the average tenant stay here, and is there a school-zone premium baked into asking?
- Crime grade is F in this area — have there been break-ins, vandalism, or insurance claims at this property in the last 3 years? What carrier currently insures it and at what premium?
- The area grade is low — what's the realistic commute time and amenity access for the typical tenant pool here? Any planned neighborhood developments (good or bad) we should know about?
- What's the average days-on-market for RENTAL listings here right now (not sales)? A rising rental-DOM trend means longer vacancies and softer asking-rent achievability than the comps imply.
- What's the recent tenant-quality profile in this submarket — average credit score on applications, eviction rate, late-payment / NSF rate, and stable-employment percentage? A property-management company in the area should have these aggregated.
- How much new apartment / multifamily construction is in the pipeline within 1–3 miles? Heavy new supply (>2% of stock underway) typically softens rents 12–24 months out; light construction supports rent growth.
Investment metrics
- 1% rule
- 0.79% ✗
- Cap rate
- 3.83%
- Cash-on-cash
- -8.78%
- DSCR
- 0.61
- GRM
- 10.6
CMA / ARV
No comps found within radius.
Projected returns pro-forma
5.71% appreciation · 8.0% rent growth · sell at horizon
- IRR
- 9.6%
- Equity multiple
- 1.66×
- Total profit
- $124,108
- Equity at exit
- $412,147
- IRR
- 12.9%
- Equity multiple
- 3.69×
- Total profit
- $508,296
- Equity at exit
- $737,111
Cash invested: $189,000 (down + closing). Projections, not guarantees.
Landlord ↔ Tenant lean methodology
- Overall (CITY)
- 0 Strongly Tenant-Friendly
- State New York
- 15 Strongly Tenant-Friendly · D+10
- County
- — inherits STATE
- City New York
- 0 Strongly Tenant-Friendly · D+34
ZIP-level market 10021
- Home prices YoY
- 3.7%
- Rents YoY
- 9.1%
- Active inventory
- 426
- Price-to-rent
- 10.6×
Monthly cashflow live
- Estimated rent
- $5,321 high interval (Pro) →
- Mortgage (P&I)
- −$3,540
- Tax from tax record
- −$806 /mo · $9,678/yr
- Insurance
- −$281
- HOA
- −$959
- Vacancy / Maint / Mgmt
- −$1,117
- Net cashflow
- $-1,383
Break-even live
Sensitivity live
| Price | -10% $-1,001 | -5% $-1,192 | +0% $-1,383 | +5% $-1,574 | +10% $-1,765 |
|---|---|---|---|---|---|
| Rent | -10% $-1,803 | -5% $-1,593 | +0% $-1,383 | +5% $-1,173 | +10% $-963 |
| Rate | -1.0pp $-1,043 | -0.5pp $-1,211 | base $-1,383 | +0.5pp $-1,558 | +1.0pp $-1,736 |
UW: 25.0% down · 7.5% · 30yr · 1.5% tax · 5.0% vac · 8.0% maint · 8.0% mgmt
Financing live
Cash to close
- Down payment
- $168,750
- Closing costs
- $20,250
- Reserves months
- —
- Total cash needed
- —
Loan-product check · same deal, 3 products live
Conventional
25% down · 7.5% · 30yr
- Down + closing
- —
- Monthly P&I
- —
- Monthly cashflow
- —
- DSCR
- —
- Eligible?
- —
Personal DTI + credit; lowest rate.
DSCR
20% down · 8.5% · 30yr
- Down + closing
- —
- Monthly P&I
- —
- Monthly cashflow
- —
- DSCR
- —
- Eligible?
- —
No personal income docs; deal must DSCR.
Hard money
10% down · 12.0% · 12mo
- Down + closing
- —
- Monthly P&I
- —
- Monthly cashflow
- —
- DSCR
- —
- Eligible?
- —
Short-term bridge; refi at stabilization.
Rent comps 40 comps
| Address | Beds | Baths | Sqft | Rent | $/sqft | DOM | Units | Dist |
|---|---|---|---|---|---|---|---|---|
| 1290 1st Ave #1499 New York, NY | 2.0 | 1.0 | 671 | $6,100 | $9.09 | 4d | 2 | 0.01mi |
| 403 E 69th St #1518 New York, NY | 1.0–3.0 | 1.0 | 745 | $3,990 | $5.36 | 26d | 3 | 0.01mi |
| 1310 2nd Ave Unit 1224958P New York, NY | 1.0–2.0 | 1.0 | 699 | $5,450 | $7.80 | 3d | 2 | 0.14mi |
| 400 E 66th St Unit 1016404P New York, NY | 1.0–2.0 | 1.0–2.0 | 791 | $10,597 | $13.40 | 5d | 2 | 0.18mi |
| 1373 1st Ave Unit 1952 New York, NY | 2.0 | 2.0 | 650 | $7,260 | $11.17 | 26d | 1 | 0.23mi |
| 515 E 72nd St Unit 17D New York, NY | 1.0 | 1.0 | 687 | $5,500 | $8.01 | 26d | 1 | 0.23mi |
| 220 E 65th St New York, NY | 1.0 | 1.0 | 700 | $5,950 | $8.50 | 3d | 1 | 0.32mi |
| 240e E 75th St Unit 1021876P New York, NY | — | 1.0 | 441 | $5,981 | $13.56 | 9d | 1 | 0.34mi |
| 240e E 75th St Unit 1021873P New York, NY | — | 1.0 | 441 | $5,227 | $11.85 | 6d | 1 | 0.34mi |
| 403 E 62nd St Unit 14C New York, NY | 1.0 | 1.0 | 650 | $4,900 | $7.54 | 23d | 1 | 0.35mi |
| 225 E 63rd St #1675 New York, NY | 1.0 | 1.0 | 627 | $5,230 | $8.34 | 26d | 2 | 0.37mi |
| 231 E 76th St #1530 New York, NY | 1.0 | 1.0 | 650 | $6,470 | $9.95 | 22d | 1 | 0.40mi |
| 308 E 78th St #2024 New York, NY | 1.0–2.0 | 1.0 | 550 | $4,610 | $8.38 | 26d | 2 | 0.44mi |
| 347 E 78th St Unit 1460467P New York, NY | 2.0 | 1.0 | 645 | $7,606 | $11.79 | 26d | 1 | 0.45mi |
| 347 E 78th St Unit 1530420P New York, NY | 2.0 | 1.0 | 645 | $6,270 | $9.72 | 23d | 1 | 0.45mi |
| 315 E 78th St Unit 1021994P New York, NY | 1.0 | 1.0 | 441 | $5,037 | $11.42 | 22d | 1 | 0.46mi |
| 315 E 78th St Unit 1021894P New York, NY | 1.0 | 1.0 | 548 | $5,643 | $10.30 | 23d | 1 | 0.46mi |
| 315 E 78th St Unit 1021885P New York, NY | 1.0 | 1.0 | 516 | $6,242 | $12.10 | 0d | 1 | 0.46mi |
| 315 E 78th St Unit 1021847P New York, NY | 1.0 | 1.0 | 516 | $4,880 | $9.46 | 21d | 1 | 0.46mi |
| 252 E 61st St #638 New York, NY | 1.0 | 1.0 | 666 | $5,530 | $8.30 | 3d | 2 | 0.46mi |
| 149 E 62nd St Unit 1021838P New York, NY | — | 1.0 | 398 | $4,518 | $11.35 | 4d | 1 | 0.50mi |
| 149 E 62nd St Unit 1021871P New York, NY | — | 1.0 | 398 | $5,344 | $13.43 | 9d | 1 | 0.50mi |
| 151 E 62nd St Unit 1021834P New York, NY | 1.0 | 1.0 | 398 | $6,812 | $17.12 | 9d | 1 | 0.50mi |
| 301 E 79th St Unit 28P New York, NY | 1.0 | 1.0 | 700 | $5,500 | $7.86 | 26d | 1 | 0.52mi |
| 420 E 80th St #198 New York, NY | 1.0 | 1.0 | 623 | $4,760 | $7.64 | 20d | 1 | 0.54mi |
| 227 E 59th St #635 New York, NY | 2.0 | 1.0 | 500 | $6,240 | $12.48 | 18d | 2 | 0.55mi |
| 329 E 58th St #807 New York, NY | 2.0 | 1.0 | 650 | $5,860 | $9.02 | 9d | 1 | 0.55mi |
| 400 E 57th St #2106 New York, NY | 2.0 | 1.0–2.0 | 903 | $6,610 | $7.32 | 5d | 3 | 0.63mi |
| 599 E 56th St Unit 1817 New York, NY | 1.0 | 1.0 | 625 | $4,850 | $7.76 | 26d | 1 | 0.68mi |
| 200 E 82nd St #505 New York, NY | 2.0 | 1.0 | 636 | $6,715 | $10.55 | 3d | 3 | 0.69mi |
| 7 E 75th St #1615 New York, NY | 1.0–3.0 | 1.0–2.0 | 656 | $4,850 | $7.39 | 0d | 3 | 0.70mi |
| 888 Main St New York, NY | 3.0 | 1.0–2.0 | 908 | $4,928 | $5.43 | 0d | 8 | 0.71mi |
| 1567 York Ave Unit 1021866P New York, NY | 2.0 | 1.0 | 742 | $5,910 | $7.96 | 23d | 1 | 0.72mi |
| 501 1/2 E 83rd St #1998 New York, NY | 2.0 | 1.0 | 525 | $4,710 | $8.97 | 26d | 2 | 0.72mi |
| 150 E 57th St New York, NY | 5.0 | 1.0–7.5 | 2750 | $10,504 | $3.82 | 3d | 5 | 0.72mi |
| 235 E 55th St Unit 36B New York, NY | 1.0 | 1.0 | 650 | $4,800 | $7.38 | 26d | 1 | 0.73mi |
| 117 E 57th St New York, NY | 1.0 | 1.0 | 732 | $5,975 | $8.16 | 6d | 2 | 0.74mi |
| 952 5th Ave #998 New York, NY | 1.0–2.0 | 1.0 | 800 | $6,460 | $8.07 | 0d | 2 | 0.75mi |
| 420 E 54th St New York, NY | 3.0 | 1.0–2.5 | 1018 | $7,261 | $7.13 | 0d | 12 | 0.79mi |
| 959 1st Ave Unit 6X New York, NY | 1.0 | 1.0 | 739 | $6,000 | $8.12 | 26d | 1 | 0.84mi |
HOA detail condo
- Monthly dues
- $959 · $11,508/yr
- Assessments
- None detected in remarks — confirm with the listing agent.
Listing history 17 events
-
2026-06-18days on market $675,000 Active 45 DOM
-
2026-06-17days on market $675,000 Active 44 DOM
-
2026-06-16days on market $675,000 Active 43 DOM
-
2026-06-15days on market $675,000 Active 42 DOM
-
2026-06-13days on market $675,000 Active 40 DOM
-
2026-06-10days on market $675,000 Active 36 DOM
-
2026-06-08days on market $675,000 Active 35 DOM
-
2026-06-08days on market $675,000 Active 34 DOM
-
2026-06-04days on market $675,000 Active 31 DOM
-
2026-06-03days on market $675,000 Active 30 DOM
-
2026-06-01days on market $675,000 Active 28 DOM
-
2026-05-31days on market $675,000 Active 27 DOM
-
2026-04-28$675,000 Active
-
2020-08-01price $649,000
-
2020-06-02$649,000 Active
-
2020-06-02$610,000
-
1984-03-01soldstatus $188,500
ⓘ Source: listings_history table (triggers on properties + properties_extension) + one-shot
backfill from property_details.listing_events for pre-trigger history.
Tax reassessment forecast NY · Partial reset (capped growth)
- Current annual tax
- $9,678 · $806/mo
- Projected year-2 tax
- $10,543 · $879/mo
- Expected delta
- +$865/yr (+$72/mo · 8.9%)
ⓘ Screening estimate from a state-policy table — verify with the county assessor before closing.
Climate risk First Street
- Flood 1/10 Low FEMA zone X (unshaded) · 0% chance over 30 yrs
- Wildfire 1/10 Low
- Heat 6/10 Major 7 d/yr ≥99°F today · 15 d/yr by 30 yrs out
- Wind 6/10 Major 27% chance of damaging wind over 30 yrs
- Air quality 4/10 Moderate 5 unhealthy d/yr today · 6 by 30 yrs out
Nearby sold comps map
Loading sold comps map…
Walkable amenities ~0.75 mi
Loading nearby amenities…
Taxation est. · year 1
- Rental income
- $63,849
- − Mortgage interest
- −$37,810
- − Property taxes
- −$9,678
- − Insurance
- −$3,375
- − Repairs & maintenance
- −$5,108
- − Management
- −$5,108
- − HOA
- −$11,508
- − Depreciation
- −$19,636
- Taxable loss
- −$28,374
- Est. tax savings @ 24.0%
- +$6,810
- After-tax cash flow
- $-9,787/yr
For passive investors: Depreciation is non-cash, so a rental often shows a tax loss while cash-flowing — sheltering income. Rental losses are passive: they offset passive income freely, and up to $25,000/yr can offset ordinary (W-2) income if you actively participate and your MAGI is under $100k (phasing out to $0 by $150k); unused losses carry forward. On sale, claimed depreciation is recaptured at up to 25%, and gains may owe capital-gains tax (a 1031 exchange can defer both). Figures are a year-1 estimate at your 24.0% rate — not tax advice; consult a CPA.
Schools (NCES district)
No district data.
Livability — New York
- Score
- 75/100
- State rank
- #268
- US rank
- #4188
Category grades
Schools grade is shown separately in the Schools card above.
Census & demographics
- Census place
- New York, NY
- County
- New York County · 1,599,927 people
- City population
- 7,731,280
- Metro
- New York-Newark-Jersey City, NY-NJ-PA
- Population (ZIP)
- 39,868
- Household income
- $158,677
- Rent vs Own
- Severe rent burden
- 2276.0
Population outlook (New York County) Hauer SSP2
- Today (2025)
- 1,825,725 people
- By 2030
- 1,904,611 · +4.3%
- By 2040
- 2,052,719 · +12.4%
- By 2050
- 2,206,601 · +20.9%
- By 2075
- 2,509,427 · +37.4%
- By 2100
- 2,702,933 · +48.0%
Race, ethnicity, and origin ACS 2023
- Neighborhood character
- Predominantly White (80%)
- Race & ethnicity
- White 80% Asian 10% Hispanic / Latino 7% Two or more races 4%
- Hispanic origin (detail)
- Common ancestry
- Scotch-Irish 7% Romanian 6% Lithuanian 5%
- Foreign-born
- 19% · Canada, China, Dominican Republic
- Languages at home
- 74% English-only · Spanish 6% French/Haitian/Cajun 5% Other Indo-European 4%
Political lean MEDSL · New York
- 2024 margin
- Solid D (+64.8) · D 82.4% · R 17.6%
- 2008→2024 swing
- -7.4pp toward R · 2008: 72.2pp · 2024: 64.8pp
- All cycles
- 2024: D+64.8 2020: D+74.5 2016: D+77.2 2012: D+69.6 2008: D+72.2
Not yet ingested
- Civics
- —
Market trends
- HPI YoY
- ▲ 5.71%
- Current HPI
- 158.8838
- Rent YoY
- ▲ 9.10%
- Metro
- New York-Newark-Jersey City, NY-NJ-PA
- State GDP YoY
- ▲ 2.60%
- F500 in state
- 92
Industry mix (Fortune 500 HQ in NY)
| Industry | F500 HQs | Revenue |
|---|---|---|
| Financial Services | 10 | $950B |
|
||
| Consumer Goods | 9 | $162B |
|
||
| Insurance | 4 | $225B |
|
||
| Telecommunications | 2 | $144B |
|
||
| Pharmaceuticals | 2 | $112B |
|
||
| Media / Entertainment | 2 | $69B |
|
||
Price history
+258.1% since first listed5 events — show timeline
- 2026-04-28 Listed $675,000 RLS at REBNY
- 2020-08-01 Price Changed $649,000 RLS at REBNY
- 2020-06-02 Listed $610,000 RLS at REBNY
- 2020-06-02 Listed $649,000 RLS at REBNY
- 1984-03-01 Sold (Public Records) $188,500 Public Records
Property tax history
+1.1%/yrLatest (2025): $9,678 · +1.0% YoY. Source: county tax records.
Cash-flow waterfall
monthlySold comps — $/sqft
last 12 mo · ≤1 miLoading sold comps…