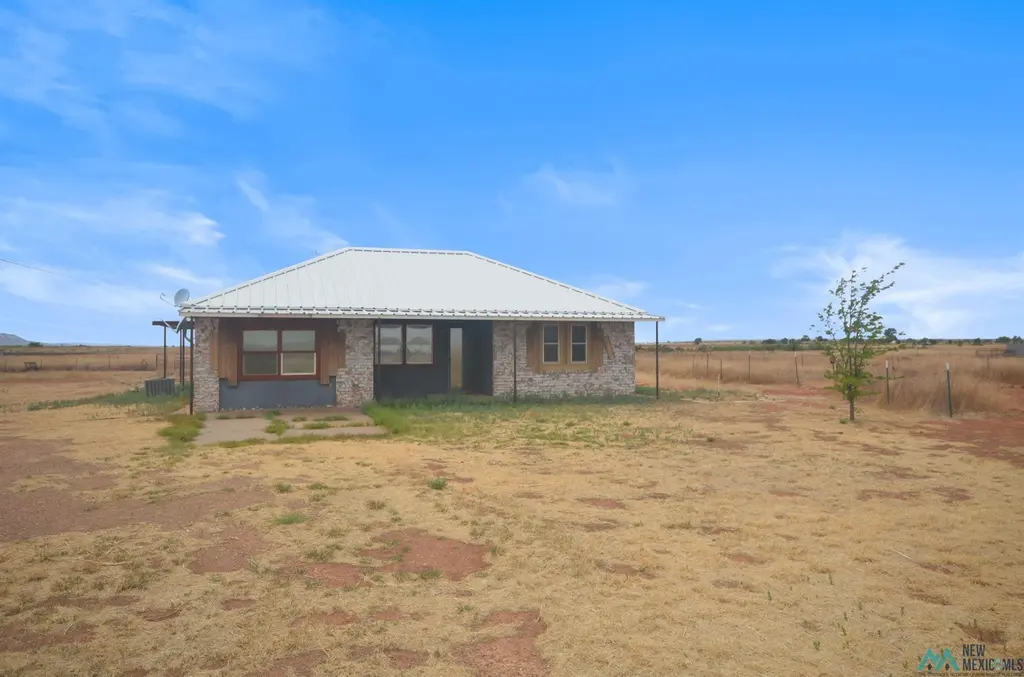
6255 Quay Ag Rd · Tucumcari, NM
Flood risk No data
- FEMA flood zone
- —
- Chance of flooding over 30 yrs
- —
- Est. flood insurance / yr
- —
Fire risk No data
- Est. fire insurance / yr
- —
Heat risk No data
- Hot days now (above threshold)
- —
- Hot days in 30 yrs
- —
Wind risk No data
- Chance of severe wind over 30 yrs
- —
Air-quality risk No data
- Unhealthy air days now
- —
- Unhealthy air days in 30 yrs
- —
Risk factors via First Street. Map © Google.
Why this score? — see what drove the C- grade
The composite is a weighted blend of 9 inputs, each scored 0–100. Each bar is that input's sub-score; the figure is the points it added to the 100-point composite (weight × sub-score).
- Cash flow +19.5/30.0
- ARV discount +7.5/15.0
- DSCR +6.1/10.0
- 1% rule +4.5/10.0
- Appreciation +3.4/10.0
- Livability +2.9/5.0
- Rent growth +2.5/5.0
- Condition / age +2.5/5.0
- Schools +2.4/10.0
$115,000
🖨 Deal sheet 📄 Offer letter ✓ Due diligence
Listing remarks
This ranch-style home with 2 bedrooms and 2 bathrooms sits on 2.99 acres suited for those seeking rural living. The residence combines residential comfort with outdoor potential, making it an option for buyers interested in a horse facility with working land. The interior provides straightforward living spaces across a single-level layout. A wood-burning stove offers an alternative heating source and focal point within the home. Outside, the acreage features a fenced pasture area ideal for equestrian use or livestock management. A garden space allows residents to grow produce or ornamental plantings. The combination of pasture, garden, and residential structures creates a functional rural s
Key facts
- Working land
- Horse facility
- Equestrian use
Tags
Property features AI
Finance
- Other: Horses allowed (corral(s) on site)
Exterior
- Parking: No garage
- Utilities: Well water; Septic tank
- Home design: Residential property; One story
- Construction: Brick and frame construction; Metal roof
- Exterior features: Wire fencing; Corrals; Shed(s); Natural vegetation
Interior
- Kitchen: Dishwasher; Free-standing range
- Flooring: Carpet; Vinyl
- Bathrooms: 2 full bathrooms
- Heating & cooling: Forced air heating; Central air conditioning; Ceiling fans
- Interior features: Ceiling fans; Aluminum window frames; Double-pane windows; Free-standing wood-burning stove fireplace
Neighborhood map
What this means for you Summary
Snapshot
- This is a 3-bed/2.0-bath single-family listed at $115k.
Deal economics
- At list price, monthly cash flow is $129 ($2k/yr) — positive.
- The deal already cash-flows at list — no discount required.
- To meet the 1% rule (rent ≥ 1% of price), the offer needs to be $110k (4.8% below list).
- Recommended offer: $110k (4.8% below list) — sets the bar for 1% rule.
Location & tenants
- Location reads 57/100 on livability (#166 in NM) — a working-class tenant base; expect higher turnover. Strengths: cost of living A+, housing B; Watch: schools F, crime F, amenities F.
- Tucumcari Public Schools (town): math 17% / reading 35% proficiency, ranked #47 of 95 in NM (top 50%) — low school quality limits family demand, transient renter base, plan for 1-2y turnover; 97% free/reduced lunch — lower-income household profile, screen leases tightly.
- Market conditions: 26 active listings in the ZIP.
Forward outlook
- Local home prices are declining (-3.0%/yr); year-one equity from $795 of loan paydown is wiped out by about $3k of value loss. Plan a longer hold.
- Quay County population projected at -35% by 2050 — secular population decline; favor cash flow + early exit over multi-decade hold.
Negotiation context
- It's been on market 29 days — a 2% lower offer ($113k) is reasonable based on typical stale-listing flexibility.
Questions for the listing agent
- Is there a deadline driving the sale (1031 exchange, divorce, estate, relocation)? That informs how much negotiation room exists.
- Schools are F-rated, which usually means shorter tenancies and higher turnover. Who's the typical renter profile here, and what's been the actual vacancy rate?
- Crime grade is F in this area — have there been break-ins, vandalism, or insurance claims at this property in the last 3 years? What carrier currently insures it and at what premium?
- What's the average days-on-market for RENTAL listings here right now (not sales)? A rising rental-DOM trend means longer vacancies and softer asking-rent achievability than the comps imply.
- What's the recent tenant-quality profile in this submarket — average credit score on applications, eviction rate, late-payment / NSF rate, and stable-employment percentage? A property-management company in the area should have these aggregated.
- How much new for-sale + rental construction is in the pipeline within 1–3 miles? Heavy new supply typically softens prices + rents 12–24 months out; constrained supply supports both.
Investment metrics
- 1% rule
- 0.95% ✗
- Cap rate
- 7.64%
- Cash-on-cash
- 4.82%
- DSCR
- 1.21
- GRM
- 8.8
CMA / ARV
No comps found within radius.
Projected returns pro-forma
-3.0% appreciation · 3.0% rent growth · sell at horizon
- IRR
- -8.8%
- Equity multiple
- 0.68×
- Total profit
- $-10,410
- Equity at exit
- $17,147
- IRR
- 0.7%
- Equity multiple
- 1.05×
- Total profit
- $1,472
- Equity at exit
- $9,943
Cash invested: $32,200 (down + closing). Projections, not guarantees.
Landlord ↔ Tenant lean methodology
- Overall (STATE)
- 55 Moderately Landlord-Leaning
- State New Mexico
- 55 Moderately Landlord-Leaning · D+3
- County
- — inherits STATE
- City
- — inherits STATE
ZIP-level market 88401
- Home prices YoY
- -2.7%
- Active inventory
- 26
- Price-to-rent
- 8.8×
Monthly cashflow live
- Estimated rent
- $1,095 medium interval (Pro) →
- Mortgage (P&I)
- −$603
- Tax from tax record
- −$85 /mo · $1,016/yr
- Insurance
- −$48
- HOA
- −$0
- Vacancy / Maint / Mgmt
- −$230
- Net cashflow
- $129
Break-even live
UW: 25.0% down · 7.5% · 30yr · 1.5% tax · 5.0% vac · 8.0% maint · 8.0% mgmt
Financing live
Cash to close
- Down payment
- $28,750
- Closing costs
- $3,450
- Reserves months
- —
- Total cash needed
- —
Loan-product check · same deal, 3 products live
Conventional
25% down · 7.5% · 30yr
- Down + closing
- —
- Monthly P&I
- —
- Monthly cashflow
- —
- DSCR
- —
- Eligible?
- —
Personal DTI + credit; lowest rate.
DSCR
20% down · 8.5% · 30yr
- Down + closing
- —
- Monthly P&I
- —
- Monthly cashflow
- —
- DSCR
- —
- Eligible?
- —
No personal income docs; deal must DSCR.
Hard money
10% down · 12.0% · 12mo
- Down + closing
- —
- Monthly P&I
- —
- Monthly cashflow
- —
- DSCR
- —
- Eligible?
- —
Short-term bridge; refi at stabilization.
Listing history 19 events
-
2026-06-18days on market $115,000 Active 29 DOM
-
2026-06-17days on market $115,000 Active 28 DOM
-
2026-06-16days on market $115,000 Active 27 DOM
-
2026-06-15days on market $115,000 Active 26 DOM
-
2026-06-13days on market $115,000 Active 24 DOM
-
2026-06-12days on market $115,000 Active 23 DOM
-
2026-06-09days on market $115,000 Active 20 DOM
-
2026-06-08days on market $115,000 Active 19 DOM
-
2026-06-07days on market $115,000 Active 18 DOM
-
2026-06-05days on market $115,000 Active 16 DOM
-
2026-06-04days on market $115,000 Active 14 DOM
-
2026-06-02days on market $115,000 Active 13 DOM
-
2026-06-01days on market $115,000 Active 12 DOM
-
2026-05-31days on market $115,000 Active 11 DOM
-
2026-05-20$115,000 Active
-
2025-04-03soldstatus
-
2025-03-31soldstatus
-
2012-08-16soldstatus
-
2008-01-25soldstatus
ⓘ Source: listings_history table (triggers on properties + properties_extension) + one-shot
backfill from property_details.listing_events for pre-trigger history.
Tax reassessment forecast NM · Resets to sale price
- Current annual tax
- $1,016 · $85/mo
- Projected year-2 tax
- $1,016 · $85/mo
- Expected delta
- $0/yr ($0/mo · 0.0%)
ⓘ Screening estimate from a state-policy table — verify with the county assessor before closing.
Nearby sold comps map
Loading sold comps map…
Walkable amenities ~0.75 mi
Loading nearby amenities…
Taxation est. · year 1
- Rental income
- $13,141
- − Mortgage interest
- −$6,442
- − Property taxes
- −$1,016
- − Insurance
- −$575
- − Repairs & maintenance
- −$1,051
- − Management
- −$1,051
- − Depreciation
- −$3,345
- Taxable loss
- −$340
- Est. tax savings @ 24.0%
- +$82
- After-tax cash flow
- $1,635/yr
For passive investors: Depreciation is non-cash, so a rental often shows a tax loss while cash-flowing — sheltering income. Rental losses are passive: they offset passive income freely, and up to $25,000/yr can offset ordinary (W-2) income if you actively participate and your MAGI is under $100k (phasing out to $0 by $150k); unused losses carry forward. On sale, claimed depreciation is recaptured at up to 25%, and gains may owe capital-gains tax (a 1031 exchange can defer both). Figures are a year-1 estimate at your 24.0% rate — not tax advice; consult a CPA.
Schools (NCES district)
- District
- Tucumcari Public Schools
- NCES district ID
- 3502640
- Math proficiency
- 17% —
- Reading proficiency
- 35% —
- Median HH income
- $27,627
- Composite
- 23.71/100
- National rank
- #13236
- State rank
- #47 of 95 in NM
Livability — Tucumcari
- Score
- 57/100
- State rank
- #166
- US rank
- #22140
Category grades
Schools grade is shown separately in the Schools card above.
Census & demographics
- Population (ZIP)
- 6,689
Population outlook (Quay County) Hauer SSP2
- Today (2025)
- 7,255 people
- By 2030
- 6,656 · -8.3%
- By 2040
- 5,560 · -23.4%
- By 2050
- 4,702 · -35.2%
- By 2075
- 3,404 · -53.1%
- By 2100
- 2,593 · -64.3%
Race, ethnicity, and origin ACS 2023
- Neighborhood character
- Diverse neighborhood (Simpson 0.56)
- Race & ethnicity
- Hispanic / Latino 53% White 40% Two or more races 23% Native American 2% Black 1%
- Hispanic origin (detail)
- Mexican 30% Puerto Rican 1%
- Common ancestry
- Iranian 2% Serbian 1% Lithuanian 1%
- Foreign-born
- 1% · Canada
- Languages at home
- 77% English-only · Spanish 23%
Political lean MEDSL · Quay
- 2024 margin
- Solid R (+40.9) · D 28.5% · R 69.4% · Other 2.1%
- 2008→2024 swing
- -20.4pp toward R · 2008: -20.5pp · 2024: -40.9pp
- All cycles
- 2024: R+40.9 2020: R+37.8 2016: R+33.6 2012: R+22.0 2008: R+20.5
Not yet ingested
- Civics
- —
Market trends
- HPI YoY
- ▼ -3.16%
- Current HPI
- 115.4103
- Rent YoY
- —
- Metro
- —
- State GDP YoY
- —
- F500 in state
- 0
Price history
5 events — show timeline
- 2026-05-20 Listed $115,000 NMMLS
- 2025-04-03 Sold (Public Records) — Public Records
- 2025-03-31 Sold (Public Records) — Public Records
- 2012-08-16 Sold (Public Records) — Public Records
- 2008-01-25 Sold (Public Records) — Public Records
Property tax history
+5.6%/yrLatest (2025): $1,016 · +36.5% YoY. Source: county tax records.
Cash-flow waterfall
monthlySold comps — $/sqft
last 12 mo · ≤1 miLoading sold comps…