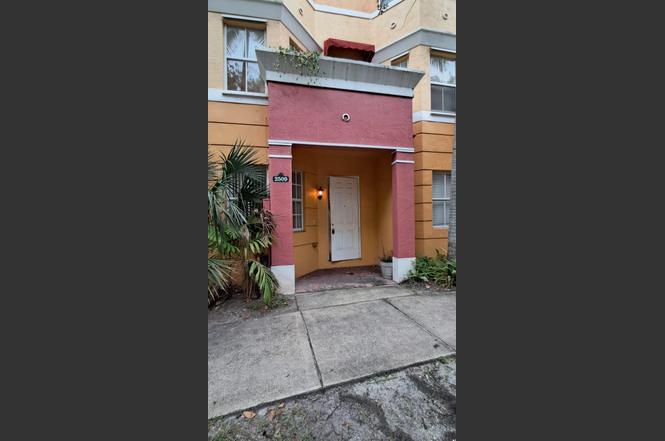
2509 Shoma Dr · Royal Palm Beach, FL
Flood risk 7/10 · Major
- FEMA flood zone
- X (unshaded)
- Chance of flooding over 30 yrs
- 0.99%
- Est. flood insurance / yr
- $507 – $1,088
Fire risk 1/10 · Minimal
- Est. fire insurance / yr
- $947 – $1,759
Heat risk 9/10 · Severe
- Hot days now (above 107°F)
- 7 days/yr
- Hot days in 30 yrs
- 25 days/yr
Wind risk 10/10 · Severe
- Chance of severe wind over 30 yrs
- 99.0%
Air-quality risk 2/10 · Minimal
- Unhealthy air days now
- 0 days/yr
- Unhealthy air days in 30 yrs
- 1 days/yr
Risk factors via First Street. Map © Google.
Why this score? — see what drove the D grade
The composite is a weighted blend of 9 inputs, each scored 0–100. Each bar is that input's sub-score; the figure is the points it added to the 100-point composite (weight × sub-score).
- Cash flow +11.0/30.0
- ARV discount +7.5/15.0
- 1% rule +5.8/10.0
- Schools +4.3/10.0
- Livability +4.0/5.0
- DSCR +3.2/10.0
- Rent growth +3.1/5.0
- Condition / age +2.5/5.0
- Appreciation +0.0/10.0
$299,900
🖨 Deal sheet (PDF) 📄 Offer letter ✓ Due diligence
Listing remarks MLS
Shoma Townhomes At Royal Palm BeachLarge 3/3.5 condo with attached 1 car garage.
Key facts
- $578 HOA
- Garage
- Community pool
Property features AI
Finance
- Other: Pets allowed (pet restrictions possible)
- Financial info: Monthly HOA fee: $578
- HOA & community: HOA with pool; HOA dues paid monthly
Exterior
- Parking: Attached garage with garage door opener (1 covered space / 1 garage space)
- Security: Gated community (no guard)
- Utilities: Cable available
- Home design: Townhouse; Resale property; Faces northeast; Three stories
- Construction: CBS construction
- Exterior features: Not waterfront; No waterfront features listed
Interior
- Kitchen: Dishwasher; Disposal; Refrigerator; Electric water heater
- Bedrooms: One bedroom on the main level
- Flooring: Ceramic tile; Laminate
- Bathrooms: Three full bathrooms; One half bathroom
- Heating & cooling: Central heating (electric); Central air conditioning (electric)
- Interior features: Walk-in closets; Roman tub; Upstairs living area
- Laundry & utility: Unfurnished
Neighborhood map
What this means for you Summary
Snapshot
- This is a 3-bed/3.5-bath condo listed at $300k.
Deal economics
- At list price, monthly cash flow is $-195 ($-2k/yr) — negative.
- To cash-flow at today's rent, offer at most $266k (11.5% below list).
- Meets the 1% rule at list price ($3k rent vs $300k).
- Recommended offer: $264k (12.0% below list) — sets the bar for market timing.
Location & tenants
- Location reads 79/100 on livability (#135 in FL, #2,039 nationally) — a middle-class / working-renter tenant base. Strengths: employment A+, housing A+, health & safety A+; Watch: cost of living C-, amenities F, commute F.
- Palm Beach (suburban): math 46% / reading 53% proficiency, ranked #34 of 73 in FL (top 47%) — families likely to look elsewhere, expect single-tenant / working-renter base with shorter leases.
- Zoned schools: Everglades Elementary (math 70% / reading 74%, grade A-, #288 of 2,144 statewide, top 15%, 888 students, 34% FRL); Emerald Cove Middle School (math 61% / reading 64%, grade B+, #116 of 571 statewide, top 21%, 1,241 students, 36% FRL); Palm Beach Central High School (math 42% / reading 55%, grade D, #198 of 667 statewide, top 30%, 2,980 students, 40% FRL) — zoned schools average 36% FRL vs 52% district-wide (16 pts lower); this property's tenant base skews higher-income than the district average.
- Market conditions: Rents rising (+2.3%/yr); 616 active listings in the ZIP; 40 comparable units currently listed for rent nearby; rentals at typical pace (median 25d on market — plan ~3-4 weeks tenant-placement turnaround); high-income renter base; 3,974 units permitted in Palm Beach County in 2024 (1,012 in 5+ unit buildings).
- This rent runs 35% of the median local income ($112k/yr) — at the standard rent-burdened threshold; future hikes will face affordability resistance.
Forward outlook
- Local home prices are declining (-3.0%/yr); year-one equity from $2k of loan paydown is wiped out by about $9k of value loss. Plan a longer hold.
- Palm Beach County population projected at +30% by 2050 — long-run rental-demand tailwind backs the buy-and-hold thesis.
Negotiation context
- It's been on market 301 days — a 12% lower offer ($264k) is reasonable based on typical stale-listing flexibility.
- 5 sale attempts since 19y ago with the ask held roughly flat each time — persistent listings suggest the price (not the market) is what's stuck; bring a comps-based counter.
- Current owner paid $211k; 42% above their basis — modest negotiation headroom, anchor on the comps not their cost.
Risks & watch-outs
- Watch-outs: flood insurance adds $66/mo.
- Climate carrying-cost: major flood risk; severe wind risk, 99% chance of damaging wind over 30y; extreme-heat days projected 7→25/yr by 2055 (HVAC capex compounding) — expect insurance premiums to compound above CPI over the hold.
Questions for the listing agent
- What do current leases actually rent for vs. the listed asking? Can we see a recent rent roll and the last 12 months of T-12 income?
- It's been on market 301 days. Have you received any prior offers? Is the seller open to a 12% concession, seller financing, or rate buy-down credit?
- What's the actual annual flood-insurance premium (NFIP or private), and is the property in a SFHA with mandatory coverage?
- What does the HOA fee cover, when was the last increase, and are there any pending special assessments or reserve-fund shortfalls?
- Any open or pending special assessments — roof, HVAC, plumbing, elevator, façade? What's the per-unit balance and payoff schedule, and is the seller paying it off at close or rolling it to the buyer?
- Why hasn't it sold? Are there any deal-killer items the seller is aware of (foundation, flood, title, zoning, code violations)?
- Is there a deadline driving the sale (1031 exchange, divorce, estate, relocation)? That informs how much negotiation room exists.
- Schools are B-rated — typically a magnet for longer-tenancy family renters. What's the average tenant stay here, and is there a school-zone premium baked into asking?
- The area grade is low — what's the realistic commute time and amenity access for the typical tenant pool here? Any planned neighborhood developments (good or bad) we should know about?
- What's the average days-on-market for RENTAL listings here right now (not sales)? A rising rental-DOM trend means longer vacancies and softer asking-rent achievability than the comps imply.
- What's the recent tenant-quality profile in this submarket — average credit score on applications, eviction rate, late-payment / NSF rate, and stable-employment percentage? A property-management company in the area should have these aggregated.
- How much new apartment / multifamily construction is in the pipeline within 1–3 miles? Heavy new supply (>2% of stock underway) typically softens rents 12–24 months out; light construction supports rent growth.
Investment metrics
- 1% rule
- 1.08% ✓
- Cap rate
- 5.78%
- Cash-on-cash
- -1.83%
- DSCR
- 0.92
- GRM
- 7.7
CMA / ARV
No comps found within radius.
Projected returns pro-forma
-3.0% appreciation · 2.31% rent growth · sell at horizon
- IRR
- -21.8%
- Equity multiple
- 0.25×
- Total profit
- $-62,761
- Equity at exit
- $44,716
- IRR
- -17.4%
- Equity multiple
- 0.07×
- Total profit
- $-77,752
- Equity at exit
- $25,930
Cash invested: $83,972 (down + closing). Projections, not guarantees.
Landlord ↔ Tenant lean methodology
- Overall (STATE)
- 87 Strongly Landlord-Friendly
- State Florida
- 87 Strongly Landlord-Friendly · R+3
- County
- — inherits STATE
- City
- — inherits STATE
ZIP-level market 33414
- Home prices YoY
- -30.2%
- Rents YoY
- 2.3%
- Active inventory
- 616
- Price-to-rent
- 7.7×
Monthly cashflow live
- Estimated rent
- $3,232 high interval (Pro) →
- Mortgage (P&I)
- −$1,573
- Tax from tax record
- −$406 /mo · $4,872/yr
- Insurance
- −$125
- Flood insurance flood zone
- −$66 /mo · $798/yr
- HOA
- −$578
- Vacancy / Maint / Mgmt
- −$679
- Net cashflow
- $-195
Break-even live
Sensitivity live
| Price | -10% $-25 | -5% $-110 | +0% $-195 | +5% $-280 | +10% $-364 |
|---|---|---|---|---|---|
| Rent | -10% $-450 | -5% $-322 | +0% $-195 | +5% $-67 | +10% $61 |
| Rate | -1.0pp $-44 | -0.5pp $-118 | base $-195 | +0.5pp $-272 | +1.0pp $-351 |
UW: 25.0% down · 7.5% · 30yr · 1.5% tax · 5.0% vac · 8.0% maint · 8.0% mgmt
Financing live
Cash to close
- Down payment
- $74,975
- Closing costs
- $8,997
- Reserves months
- —
- Total cash needed
- —
Loan-product check · same deal, 3 products live
Conventional
25% down · 7.5% · 30yr
- Down + closing
- —
- Monthly P&I
- —
- Monthly cashflow
- —
- DSCR
- —
- Eligible?
- —
Personal DTI + credit; lowest rate.
DSCR
20% down · 8.5% · 30yr
- Down + closing
- —
- Monthly P&I
- —
- Monthly cashflow
- —
- DSCR
- —
- Eligible?
- —
No personal income docs; deal must DSCR.
Hard money
10% down · 12.0% · 12mo
- Down + closing
- —
- Monthly P&I
- —
- Monthly cashflow
- —
- DSCR
- —
- Eligible?
- —
Short-term bridge; refi at stabilization.
Rent comps 40 comps
| Address | Beds | Baths | Sqft | Rent | $/sqft | DOM | Units | Dist |
|---|---|---|---|---|---|---|---|---|
| 3308 Shoma Dr Royal Palm Beach, FL | 4.0 | 3.5 | 1988 | $2,500 | $1.26 | 6d | 1 | 0.02mi |
| 3308 Shoma Dr Royal Palm Beach, FL | 4.0 | 3.5 | 1988 | $2,500 | $1.26 | 25d | 1 | 0.02mi |
| 3515 Shoma Dr Unit 3515 West Palm Beach, FL | 3.0 | 3.5 | 1815 | $3,250 | $1.79 | 25d | 1 | 0.03mi |
| 3808 Shoma Dr Unit 3808 West Palm Beach, FL | 3.0 | 3.0 | 2300 | $2,300 | $1.00 | 25d | 1 | 0.03mi |
| 3106 Shoma Dr Royal Palm Beach, FL | 4.0 | 3.5 | 1988 | $3,900 | $1.96 | 25d | 1 | 0.03mi |
| 3106 Shoma Dr Royal Palm Beach, FL | 4.0 | 3.5 | 1988 | $4,000 | $2.01 | 4d | 1 | 0.03mi |
| 2405 Shoma Dr Royal Palm Beach, FL | 3.0 | 3.5 | 1932 | $2,375 | $1.23 | 3d | 1 | 0.03mi |
| 2108 Shoma Dr Royal Palm Beach, FL | 3.0 | 2.0 | 1457 | $2,400 | $1.65 | 25d | 1 | 0.06mi |
| 2127 Shoma Dr Royal Palm Beach, FL | 2.0 | 2.5 | 1282 | $2,500 | $1.95 | 25d | 1 | 0.06mi |
| 1008 Shoma Dr Unit 394 West Palm Beach, FL | 2.0 | 2.5 | 1282 | $2,400 | $1.87 | 19d | 1 | 0.16mi |
| 147 Kensington Way Royal Palm Beach, FL | 4.0 | 2.5 | 2536 | $4,000 | $1.58 | 25d | 1 | 0.18mi |
| 570 Christina Dr Royal Palm Beach, FL | 1.0–3.0 | 1.0–2.0 | 1044 | $2,862 | $2.74 | 1d | 10 | 0.25mi |
| 11300 Channing Ln Unit 102 Royal Palm Beach, FL | 3.0 | 2.0 | 2111 | $4,299 | $2.04 | 25d | 1 | 0.39mi |
| 1451 Pioneer Way Royal Palm Beach, FL | 3.0 | 2.5 | 1900 | $4,750 | $2.50 | 22d | 1 | 0.41mi |
| 116 Hamilton Ter Royal Palm Beach, FL | 4.0 | 2.5 | 2537 | $3,300 | $1.30 | 3d | 1 | 0.42mi |
| 116 Hamilton Ter Royal Palm Beach, FL | 4.0 | 2.5 | 2537 | $3,500 | $1.38 | 15d | 1 | 0.42mi |
| 9433 Madewood Ct Royal Palm Beach, FL | 4.0 | 2.0 | 2616 | $5,350 | $2.05 | 25d | 1 | 0.45mi |
| 640 Pioneer Way Unit 640 Royal Palm Beach, FL | 3.0 | 2.5 | 1557 | $3,100 | $1.99 | 25d | 1 | 0.46mi |
| 11260 Channing Way Unit 212 Royal Palm Beach, FL | 3.0 | 2.0 | 1417 | $3,174 | $2.24 | 25d | 1 | 0.47mi |
| 113 Canterbury Pl Royal Palm Beach, FL | 4.0 | 2.5 | 2267 | $3,500 | $1.54 | 6d | 1 | 0.48mi |
| 113 Canterbury Pl Royal Palm Beach, FL | 4.0 | 2.5 | 2267 | $3,500 | $1.54 | 25d | 1 | 0.48mi |
| 220 Pioneer Way Royal Palm Beach, FL | 3.0 | 2.5 | 1557 | $3,200 | $2.06 | 8d | 1 | 0.50mi |
| 137 Canterbury Pl Royal Palm Beach, FL | 3.0 | 2.5 | 1856 | $3,500 | $1.89 | 25d | 1 | 0.52mi |
| 169 Berenger Walk Royal Palm Beach, FL | 4.0 | 2.5 | 2262 | $3,750 | $1.66 | 25d | 1 | 0.59mi |
| 175 Berenger Walk Royal Palm Beach, FL | 4.0 | 2.5 | 2204 | $3,600 | $1.63 | 25d | 1 | 0.62mi |
| 1090 Quaye Lake Cir Wellington, FL | 3.0 | 3.0 | 1719 | $3,513 | $2.04 | 15d | 1 | 0.64mi |
| 1090 Quaye Lake Cir Wellington, FL | 2.0 | 3.0 | 1501 | $2,695 | $1.80 | 14d | 1 | 0.64mi |
| 1090 Quaye Lake Cir Wellington, FL | 2.0 | 3.0 | 1429 | $2,761 | $1.93 | 25d | 1 | 0.64mi |
| 11200 Nicole Dr Wellington, FL | 1.0–4.0 | 1.0–3.5 | 1404 | $3,732 | $2.66 | 0d | 34 | 0.66mi |
| 625 Whippoorwill Ter West Palm Beach, FL | 3.0 | 2.0 | 1914 | $4,500 | $2.35 | 25d | 1 | 0.75mi |
| 217 Berenger Walk Royal Palm Beach, FL | 3.0 | 2.5 | 2204 | $3,000 | $1.36 | 17d | 1 | 0.80mi |
| 11020 Town Cir Wellington, FL | 1.0–3.0 | 1.0–2.0 | 1013 | $3,143 | $3.10 | 1d | 14 | 0.85mi |
| 176 Bellezza Ter Royal Palm Beach, FL | 4.0 | 2.5 | 2058 | $3,350 | $1.63 | 11d | 1 | 1.08mi |
| 699 Belle Grove Ln Royal Palm Beach, FL | 3.0 | 2.0 | 1849 | $3,500 | $1.89 | 25d | 1 | 1.14mi |
| 1592 Carriage Brooke Dr Wellington, FL | 3.0 | 2.0 | 1662 | $3,000 | $1.81 | 25d | 1 | 1.15mi |
| 8694 Pioneer Rd West Palm Beach, FL | 4.0 | 3.0 | 2000 | $3,500 | $1.75 | 19d | 1 | 1.20mi |
| 10793 Oak Bend Way Wellington, FL | 4.0 | 2.5 | 1852 | $4,000 | $2.16 | 11d | 1 | 1.29mi |
| 1664 Oak Berry Cir Wellington, FL | 3.0 | 2.0 | 1325 | $3,650 | $2.75 | 25d | 1 | 1.32mi |
| 10709 Pelican Dr Wellington, FL | 2.0 | 2.0 | 1244 | $2,900 | $2.33 | 8d | 1 | 1.35mi |
| 1019 Larch Way Wellington, FL | 4.0 | 2.0 | 2125 | $4,000 | $1.88 | 25d | 1 | 1.37mi |
HOA detail condo
- Monthly dues
- $578 · $6,936/yr
- Assessments
- None detected in remarks — confirm with the listing agent.
Listing history 23 events
-
2026-06-18days on market $299,900 Active 301 DOM
-
2026-06-17days on market $299,900 Active 300 DOM
-
2026-06-16days on market $299,900 Active 299 DOM
-
2026-06-15days on market $299,900 Active 298 DOM
-
2026-06-13days on market $299,900 Active 296 DOM
-
2026-06-09days on market $299,900 Active 292 DOM
-
2026-06-07days on market $299,900 Active 290 DOM
-
2026-06-04days on market $299,900 Active 287 DOM
-
2026-06-03days on market $299,900 Active 286 DOM
-
2026-06-01days on market $299,900 Active 284 DOM
-
2026-05-31days on market $299,900 Active 283 DOM
-
2025-08-21$299,900 Active
-
2025-01-14historical
-
2025-01-02historical $2,300
-
2024-12-19$2,300
-
2024-11-18price $309,900
-
2024-10-26price $329,900
-
2024-10-18$339,900 Active
-
2021-08-27soldstatus $211,000 Closed 80-char remark
Show marketing remark (80 chars)
Shoma Townhomes At Royal Palm BeachLarge 3/3.5 condo with attached 1 car garage.
-
2021-07-28historical Active Under Contract 80-char remark
Show marketing remark (80 chars)
Shoma Townhomes At Royal Palm BeachLarge 3/3.5 condo with attached 1 car garage.
-
2021-07-26$210,000 Active 80-char remark
Show marketing remark (80 chars)
Shoma Townhomes At Royal Palm BeachLarge 3/3.5 condo with attached 1 car garage.
-
2007-11-02historical
-
2007-03-23$225,000
ⓘ Source: listings_history table (triggers on properties + properties_extension) + one-shot
backfill from property_details.listing_events for pre-trigger history.
Tax reassessment forecast FL · Resets to sale price
- Current annual tax
- $4,872 · $406/mo
- Projected year-2 tax
- $4,872 · $406/mo
- Expected delta
- $0/yr ($0/mo · 0.0%)
ⓘ Screening estimate from a state-policy table — verify with the county assessor before closing.
Climate risk First Street
- Flood 7/10 Severe FEMA zone X (unshaded) · 99% chance over 30 yrs
- Wildfire 1/10 Low
- Heat 9/10 Extreme 7 d/yr ≥107°F today · 25 d/yr by 30 yrs out
- Wind 10/10 Extreme 99% chance of damaging wind over 30 yrs
- Air quality 2/10 Low 0 unhealthy d/yr today · 1 by 30 yrs out
Nearby sold comps map
Loading sold comps map…
Walkable amenities ~0.75 mi
Loading nearby amenities…
Taxation est. · year 1
- Rental income
- $38,787
- − Mortgage interest
- −$16,799
- − Property taxes
- −$4,872
- − Insurance
- −$2,297
- − Repairs & maintenance
- −$3,103
- − Management
- −$3,103
- − HOA
- −$6,936
- − Depreciation
- −$8,724
- Taxable loss
- −$7,048
- Est. tax savings @ 24.0%
- +$1,691
- After-tax cash flow
- $-645/yr
For passive investors: Depreciation is non-cash, so a rental often shows a tax loss while cash-flowing — sheltering income. Rental losses are passive: they offset passive income freely, and up to $25,000/yr can offset ordinary (W-2) income if you actively participate and your MAGI is under $100k (phasing out to $0 by $150k); unused losses carry forward. On sale, claimed depreciation is recaptured at up to 25%, and gains may owe capital-gains tax (a 1031 exchange can defer both). Figures are a year-1 estimate at your 24.0% rate — not tax advice; consult a CPA.
Schools (NCES district)
- District
- Palm Beach
- NCES district ID
- 1201500
- Math proficiency
- 46% ▼ -16.00%
- Reading proficiency
- 53% ▼ -4.00%
- Median HH income
- $53,943
- Composite
- 42.72/100
- National rank
- #3160
- State rank
- #34 of 73 in FL
Livability — Royal Palm Beach
- Score
- 79/100
- State rank
- #135
- US rank
- #2039
Category grades
Schools grade is shown separately in the Schools card above.
Census & demographics
- Census place
- Royal Palm Beach, FL
- County
- Palm Beach County · 1,438,312 people
- City population
- 75,299
- Metro
- Miami-Fort Lauderdale-Pompano Beach, FL
- Population (ZIP)
- 60,184
- Household income
- $112,241
- Rent vs Own
- Severe rent burden
- 1566.0
Population outlook (Palm Beach County) Hauer SSP2
- Today (2025)
- 1,637,487 people
- By 2030
- 1,743,255 · +6.5%
- By 2040
- 1,948,712 · +19.0%
- By 2050
- 2,132,979 · +30.3%
- By 2075
- 2,530,027 · +54.5%
- By 2100
- 2,706,979 · +65.3%
Race, ethnicity, and origin ACS 2023
- Neighborhood character
- Diverse neighborhood (Simpson 0.67)
- Race & ethnicity
- White 47% Hispanic / Latino 29% Two or more races 20% Black 13% Asian 6%
- Hispanic origin (detail)
- Mexican 4% Puerto Rican 5% Cuban 6% Dominican 1% Salvadoran 1%
- Common ancestry
- Hispanic 4% Romanian 3% Lithuanian 2%
- Foreign-born
- 26% · Canada, Jamaica, China
- Languages at home
- 67% English-only · Spanish 23% French/Haitian/Cajun 3% Other Indo-European 3%
Political lean MEDSL · Palm Beach
- 2024 margin
- Toss-up / Even · D 50.0% · R 49.2%
- 2008→2024 swing
- -22.1pp toward R · 2008: 22.9pp · 2024: 0.8pp
- All cycles
- 2024: D+0.8 2020: D+12.8 2016: D+15.3 2012: D+17.0 2008: D+22.9
Not yet ingested
- Civics
- —
Market trends
- HPI YoY
- ▼ -152.58%
- Current HPI
- 352.9366
- Rent YoY
- ▲ 2.31%
- Metro
- Miami-Fort Lauderdale-Pompano Beach, FL
- State GDP YoY
- ▲ 3.28%
- F500 in state
- 36
Industry mix (Fortune 500 HQ in FL)
| Industry | F500 HQs | Revenue |
|---|---|---|
| Industrial Technology | 2 | $29B |
|
||
| Insurance | 2 | $17B |
|
||
| Retail | 1 | $60B |
|
||
| Technology Distribution | 1 | $58B |
|
||
| Homebuilding | 1 | $35B |
|
||
| Technology Manufacturing | 1 | $35B |
|
||
Price history
+33.3% since first listed12 events — show timeline
- 2025-08-21 Listed $299,900 Beaches MLS
- 2025-01-14 Listing Removed — Beaches MLS
- 2025-01-02 Rental Removed $2,300 RMLSFL
- 2024-12-19 Listed for Rent $2,300 RMLSFL
- 2024-11-18 Price Changed $309,900 Beaches MLS
- 2024-10-26 Price Changed $329,900 Beaches MLS
- 2024-10-18 Listed $339,900 Beaches MLS
- 2021-08-27 Sold (MLS) $211,000 Beaches MLS
- 2021-07-28 Contingent — Beaches MLS
- 2021-07-26 Listed $210,000 Beaches MLS
- 2007-11-02 Listing Removed — Beaches MLS
- 2007-03-23 Listed $225,000 Beaches MLS
Property tax history
+8.5%/yrLatest (2025): $4,872 · +2.3% YoY. Source: county tax records.
Cash-flow waterfall
monthlySold comps — $/sqft
last 12 mo · ≤1 miLoading sold comps…