 Fourplex
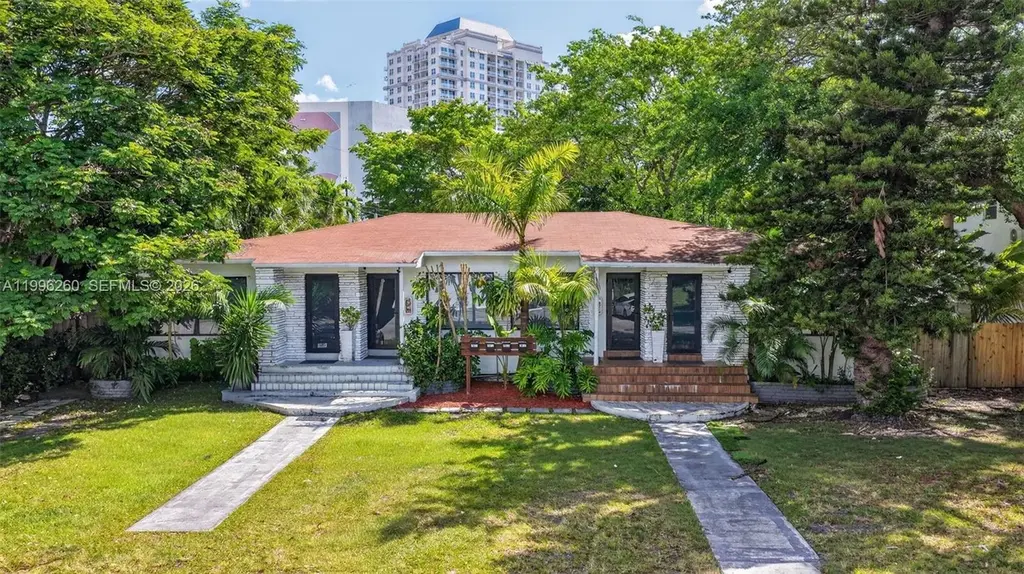
7811 NE 10th Ct · Miami, FL
Flood risk 9/10 · Severe
- FEMA flood zone
- AE
- Chance of flooding over 30 yrs
- 0.99%
- Est. flood insurance / yr
- $1,737 – $8,500
Fire risk 1/10 · Minimal
- Est. fire insurance / yr
- $947 – $1,759
Heat risk 10/10 · Severe
- Hot days now (above 102°F)
- 7 days/yr
- Hot days in 30 yrs
- 29 days/yr
Wind risk 10/10 · Severe
- Chance of severe wind over 30 yrs
- 99.0%
Air-quality risk 2/10 · Minimal
- Unhealthy air days now
- 1 days/yr
- Unhealthy air days in 30 yrs
- 1 days/yr
Risk factors via First Street. Map © Google.
Why this score? — see what drove the D+ grade
The composite is a weighted blend of 9 inputs, each scored 0–100. Each bar is that input's sub-score; the figure is the points it added to the 100-point composite (weight × sub-score).
- Cash flow +16.0/30.0
- ARV discount +7.5/15.0
- DSCR +4.9/10.0
- Schools +4.2/10.0
- 1% rule +3.9/10.0
- Livability +3.9/5.0
- Rent growth +2.6/5.0
- Condition / age +2.5/5.0
- Appreciation +0.0/10.0
$1,499,000
🖨 Deal sheet (PDF) 📄 Offer letter ✓ Due diligence
Multi-family units
County records classify this as Multi-Family (2-4 Unit). Listing-text estimate: 4 units. confirmed
Listing remarks MLS
Amazing Opportunity to own a fouplex east of US1. Just 1 block from the bridge to North Bay Village. Potential Income $60,000 per year. Fully leased to long term tenants. Buy and collect rents from day one. Priced at 6.21% CAP from Potential Income. Annual Expenses $21,099. Next door fouplex is also for sale. Expense Insurance 2,307.00 Landscaping 1,360.00 Management 1,800.00 Real Estate Tax 8,518.43 Total Repairs 4,652.00 Water Sewer 2,462.00 Total Expense 21,099.43
Key facts
- 6 parking spots
- Built 1949
- Listed 75 days
Property features AI
Finance
- Other: Zoning: 4600
- Financial info: This is a multi-unit (hotel-room style) income property with multiple rented units (rents shown per unit type).; Unit type breakdown: four 1-bedroom units renting at $2,400; three furnished 1-bedroom units renting at $2,100; two furnished 1-bedroom units renting at $2,100; one 1-bedroom unit renting at $2,400.; Some units are month-to-month.
Exterior
- Parking: Total of 6 parking spaces; Open parking
- Utilities: Cable available; Public sewer
- Home design: Hotel-room style units; 4-story building; Concrete roof; Block construction
- Construction: Block construction; Concrete roof; Resale property
- Exterior features: Open parking; Less than quarter acre lot
Interior
- Bedrooms: Multiple 1-bedroom hotel-style units (see unit details)
- Flooring: Parquet
- Bathrooms: Multiple full bathrooms (one per unit)
- Heating & cooling: Central heating; Central air conditioning; Individual air conditioning units in some units
- Interior features: Parquet flooring
Neighborhood map
What this means for you Summary
Snapshot
- This is a 4 × 2-bed/2.5-bath units multifamily listed at $1.50M.
Deal economics
- At list price, monthly cash flow is $309 ($4k/yr) — positive. Per door: $77/mo.
- The deal already cash-flows at list — no discount required.
- To meet the 1% rule (rent ≥ 1% of price), the offer needs to be $1.33M (11.1% below list).
- Recommended offer: $1.33M (11.1% below list) — sets the bar for 1% rule.
- Cap rate 6.9% vs local median 1.9% in Miami — top-decile yield for the area; either an underpriced asset or a hidden risk that comps aren't pricing in. Stress-test before assuming the spread holds.
Location & tenants
- Location reads 78/100 on livability (#177 in FL, #2,724 nationally) — a middle-class / working-renter tenant base. Strengths: amenities A+, commute A+, health & safety A+; Watch: employment C-, crime F, cost of living F.
- Miami-Dade (suburban): math 45% / reading 54% proficiency, ranked #40 of 73 in FL (top 55%) — families likely to look elsewhere, expect single-tenant / working-renter base with shorter leases; 64% free/reduced lunch — lower-income household profile, screen leases tightly.
- Zoned schools: Jesse J. Mccrary Jr. Elementary School (math 31% / reading 30%, grade F, #1,862 of 2,144 statewide, top 88%, 376 students, 72% FRL); Horace Mann Middle School (math 23% / reading 31%, grade F, #497 of 571 statewide, top 88%, 528 students, 76% FRL); Miami Edison Senior High School (math 19% / reading 15%, grade F, #597 of 667 statewide, top 90%, 623 students, 72% FRL).
- Zoned-school proficiency averages 25% at this address vs 50% district-wide (-25 pts) — the specific schools serving this property underperform the Miami-Dade average; the district grade overstates school quality for this exact location.
- Market conditions: Rents flat; 369 active listings in the ZIP; 10 comparable units currently listed for rent nearby; rentals at typical pace (median 26d on market — plan ~3-4 weeks tenant-placement turnaround); solid renter incomes; 10,051 units permitted in Miami-Dade County in 2024 (7,758 in 5+ unit buildings).
Forward outlook
- Local home prices are declining (-3.0%/yr); year-one equity from $10k of loan paydown is wiped out by about $45k of value loss. Plan a longer hold.
- Miami-Dade County population projected at +28% by 2050 — long-run rental-demand tailwind backs the buy-and-hold thesis.
Negotiation context
- It's been on market 75 days — a 6% lower offer ($1.41M) is reasonable based on typical stale-listing flexibility.
- 3 sale attempts since 7y ago with the ask held roughly flat each time — persistent listings suggest the price (not the market) is what's stuck; bring a comps-based counter.
- Current owner paid $605k; list at $1.50M implies a 148% gain — meaningful room to come down on a strong offer.
Risks & watch-outs
- Watch-outs: flood insurance adds $427/mo; built in 1949 — expect roof / HVAC / electrical / plumbing capex.
- Climate carrying-cost: in FEMA flood zone AE (mandatory federal flood insurance); severe wind risk, 99% chance of damaging wind over 30y; extreme-heat days projected 7→29/yr by 2055 (HVAC capex compounding) — expect insurance premiums to compound above CPI over the hold.
Questions for the listing agent
- It's been on market 75 days. Have you received any prior offers? Is the seller open to a 11% concession, seller financing, or rate buy-down credit?
- Can we see the unit-by-unit rent roll, current vacancy, and any below-market leases? What's the average tenancy length?
- What capital expenditures (roof, boiler, parking lot, exteriors) have been made in the last 5 years, and what's planned in the next 2?
- Built in 1949 — when were the roof, HVAC, electrical panel, plumbing, and water heater last replaced?
- What's the actual annual flood-insurance premium (NFIP or private), and is the property in a SFHA with mandatory coverage?
- Why hasn't it sold? Are there any deal-killer items the seller is aware of (foundation, flood, title, zoning, code violations)?
- Is there a deadline driving the sale (1031 exchange, divorce, estate, relocation)? That informs how much negotiation room exists.
- Schools are B-rated — typically a magnet for longer-tenancy family renters. What's the average tenant stay here, and is there a school-zone premium baked into asking?
- Crime grade is F in this area — have there been break-ins, vandalism, or insurance claims at this property in the last 3 years? What carrier currently insures it and at what premium?
- The area grade is low — what's the realistic commute time and amenity access for the typical tenant pool here? Any planned neighborhood developments (good or bad) we should know about?
- What's the average days-on-market for RENTAL listings here right now (not sales)? A rising rental-DOM trend means longer vacancies and softer asking-rent achievability than the comps imply.
- What's the recent tenant-quality profile in this submarket — average credit score on applications, eviction rate, late-payment / NSF rate, and stable-employment percentage? A property-management company in the area should have these aggregated.
- How much new apartment / multifamily construction is in the pipeline within 1–3 miles? Heavy new supply (>2% of stock underway) typically softens rents 12–24 months out; light construction supports rent growth.
Investment metrics
- 1% rule
- 0.89% ✗
- Cap rate
- 6.88%
- Cash-on-cash
- 2.10%
- DSCR
- 1.09
- GRM
- 9.4
CMA / ARV
No comps found within radius.
Projected returns pro-forma
-3.0% appreciation · 0.33% rent growth · sell at horizon
- IRR
- -17.9%
- Equity multiple
- 0.39×
- Total profit
- $-258,011
- Equity at exit
- $223,506
- IRR
- -16.2%
- Equity multiple
- 0.20×
- Total profit
- $-334,553
- Equity at exit
- $129,606
Cash invested: $419,720 (down + closing). Projections, not guarantees.
Landlord ↔ Tenant lean methodology
- Overall (STATE)
- 87 Strongly Landlord-Friendly
- State Florida
- 87 Strongly Landlord-Friendly · R+3
- County
- — inherits STATE
- City
- — inherits STATE
ZIP-level market 33138
- Rents YoY
- 0.3%
- Active inventory
- 369
- Price-to-rent
- 37.5×
Monthly cashflow live
- Estimated rent
- $13,327 medium interval (Pro) →
- Mortgage (P&I)
- −$7,861
- Tax from tax record
- −$1,308 /mo · $15,693/yr
- Insurance
- −$625
- Flood insurance flood zone
- −$427 /mo · $5,118/yr
- HOA
- −$0
- Vacancy / Maint / Mgmt
- −$2,799
- Net cashflow
- $309
Break-even live
Sensitivity live
| Price | -10% $1,157 | -5% $733 | +0% $309 | +5% $-116 | +10% $-540 |
|---|---|---|---|---|---|
| Rent | -10% $-744 | -5% $-218 | +0% $309 | +5% $835 | +10% $1,361 |
| Rate | -1.0pp $1,063 | -0.5pp $690 | base $309 | +0.5pp $-80 | +1.0pp $-475 |
4-unit breakdown (identical units grouped — click to expand)
| Units | Beds | Baths | Est. rent |
|---|---|---|---|
| 4× units | 2 | 2.5 | $13,328 |
| #1 | 2 | 2.5 | $3,332 |
| #2 | 2 | 2.5 | $3,332 |
| #3 | 2 | 2.5 | $3,332 |
| #4 | 2 | 2.5 | $3,332 |
| Total (4 units) | $13,327 | ||
UW: 25.0% down · 7.5% · 30yr · 1.5% tax · 5.0% vac · 8.0% maint · 8.0% mgmt
Financing live
Cash to close
- Down payment
- $374,750
- Closing costs
- $44,970
- Reserves months
- —
- Total cash needed
- —
Loan-product check · same deal, 3 products live
Conventional
25% down · 7.5% · 30yr
- Down + closing
- —
- Monthly P&I
- —
- Monthly cashflow
- —
- DSCR
- —
- Eligible?
- —
Personal DTI + credit; lowest rate.
DSCR
20% down · 8.5% · 30yr
- Down + closing
- —
- Monthly P&I
- —
- Monthly cashflow
- —
- DSCR
- —
- Eligible?
- —
No personal income docs; deal must DSCR.
Hard money
10% down · 12.0% · 12mo
- Down + closing
- —
- Monthly P&I
- —
- Monthly cashflow
- —
- DSCR
- —
- Eligible?
- —
Short-term bridge; refi at stabilization.
Rent comps 10 comps
| Address | Beds | Baths | Sqft | Rent | $/sqft | DOM | Units | Dist |
|---|---|---|---|---|---|---|---|---|
| 1025 Belle Meade Island Dr Miami, FL | 5.0 | 3.5 | 4119 | $25,000 | $6.07 | 26d | 1 | 0.14mi |
| 1071 NE 83rd St Miami, FL | 4.0 | 3.0 | 2364 | $21,000 | $8.88 | 26d | 1 | 0.35mi |
| 745 NE 77th St Miami, FL | 4.0 | 5.0 | 3978 | $37,500 | $9.43 | 26d | 1 | 0.41mi |
| 8625 NE 10th Ave Miami, FL | 4.0 | 5.5 | 3550 | $25,000 | $7.04 | 13d | 1 | 0.55mi |
| 7934 West Dr #501 North Bay Village, FL | 4.0 | 3.5 | 3721 | $18,000 | $4.84 | 26d | 1 | 0.99mi |
| 1365 Bay Ter North Bay Village, FL | 5.0 | 4.0 | 3094 | $40,000 | $12.93 | 26d | 1 | 1.13mi |
| 7939 East Dr Unit 1272357P North Bay Village, FL | 3.0–6.0 | 2.0–4.0 | 2642 | $13,612 | $5.15 | 0d | 2 | 1.20mi |
| 1209 NE 96th St #1209 Miami Shores, FL | 5.0 | 4.0 | 3143 | $21,000 | $6.68 | 12d | 1 | 1.20mi |
| 1510 S Treasure Dr Unit SINGLE North Bay Village, FL | 4.0 | 4.0 | 2669 | $21,000 | $7.87 | 0d | 1 | 1.35mi |
| 1510 S Treasure Dr Unit SINGLE North Bay Village, FL | 4.0 | 4.0 | 2669 | $26,000 | $9.74 | 23d | 1 | 1.35mi |
Listing history 26 events
-
2026-06-21days on market $1,499,000 Active 75 DOM
-
2026-06-18days on market $1,499,000 Active 72 DOM
-
2026-06-17days on market $1,499,000 Active 71 DOM
-
2026-06-16days on market $1,499,000 Active 70 DOM
-
2026-06-15days on market $1,499,000 Active 69 DOM
-
2026-06-13days on market $1,499,000 Active 67 DOM
-
2026-06-09days on market $1,499,000 Active 63 DOM
-
2026-06-08days on market $1,499,000 Active 62 DOM
-
2026-06-07days on market $1,499,000 Active 61 DOM
-
2026-06-04days on market $1,499,000 Active 58 DOM
-
2026-06-03days on market $1,499,000 Active 57 DOM
-
2026-06-02days on market $1,499,000 Active 56 DOM
-
2026-06-01days on market $1,499,000 Active 55 DOM
-
2026-05-31days on market $1,499,000 Active 54 DOM
-
2026-04-07$1,550,000 Active
-
2019-07-23soldstatus $605,000
-
2019-07-17soldstatus $605,000 Sold 512-char remark
Show marketing remark (512 chars)
Amazing Opportunity to own a fouplex east of US1. Just 1 block from the bridge to North Bay Village. Potential Income $60,000 per year. Fully leased to long term tenants. Buy and collect rents from day one. Priced at 6.21% CAP from Potential Income. Annual Expenses $21,099. Next door fouplex is also for sale. Expense Insurance 2,307.00 Landscaping 1,360.00 Management 1,800.00 Real Estate Tax 8,518.43 Total Repairs 4,652.00 Water Sewer 2,462.00 Total Expense 21,099.43
-
2019-06-26status Pending 512-char remark
Show marketing remark (512 chars)
Amazing Opportunity to own a fouplex east of US1. Just 1 block from the bridge to North Bay Village. Potential Income $60,000 per year. Fully leased to long term tenants. Buy and collect rents from day one. Priced at 6.21% CAP from Potential Income. Annual Expenses $21,099. Next door fouplex is also for sale. Expense Insurance 2,307.00 Landscaping 1,360.00 Management 1,800.00 Real Estate Tax 8,518.43 Total Repairs 4,652.00 Water Sewer 2,462.00 Total Expense 21,099.43
-
2019-06-06status Backup Contract 512-char remark
Show marketing remark (512 chars)
Amazing Opportunity to own a fouplex east of US1. Just 1 block from the bridge to North Bay Village. Potential Income $60,000 per year. Fully leased to long term tenants. Buy and collect rents from day one. Priced at 6.21% CAP from Potential Income. Annual Expenses $21,099. Next door fouplex is also for sale. Expense Insurance 2,307.00 Landscaping 1,360.00 Management 1,800.00 Real Estate Tax 8,518.43 Total Repairs 4,652.00 Water Sewer 2,462.00 Total Expense 21,099.43
-
2019-06-05status Active 512-char remark
Show marketing remark (512 chars)
Amazing Opportunity to own a fouplex east of US1. Just 1 block from the bridge to North Bay Village. Potential Income $60,000 per year. Fully leased to long term tenants. Buy and collect rents from day one. Priced at 6.21% CAP from Potential Income. Annual Expenses $21,099. Next door fouplex is also for sale. Expense Insurance 2,307.00 Landscaping 1,360.00 Management 1,800.00 Real Estate Tax 8,518.43 Total Repairs 4,652.00 Water Sewer 2,462.00 Total Expense 21,099.43
-
2019-05-23status Pending 512-char remark
Show marketing remark (512 chars)
Amazing Opportunity to own a fouplex east of US1. Just 1 block from the bridge to North Bay Village. Potential Income $60,000 per year. Fully leased to long term tenants. Buy and collect rents from day one. Priced at 6.21% CAP from Potential Income. Annual Expenses $21,099. Next door fouplex is also for sale. Expense Insurance 2,307.00 Landscaping 1,360.00 Management 1,800.00 Real Estate Tax 8,518.43 Total Repairs 4,652.00 Water Sewer 2,462.00 Total Expense 21,099.43
-
2019-05-07$626,000 Active 512-char remark
Show marketing remark (512 chars)
Amazing Opportunity to own a fouplex east of US1. Just 1 block from the bridge to North Bay Village. Potential Income $60,000 per year. Fully leased to long term tenants. Buy and collect rents from day one. Priced at 6.21% CAP from Potential Income. Annual Expenses $21,099. Next door fouplex is also for sale. Expense Insurance 2,307.00 Landscaping 1,360.00 Management 1,800.00 Real Estate Tax 8,518.43 Total Repairs 4,652.00 Water Sewer 2,462.00 Total Expense 21,099.43
-
2014-07-21soldstatus $2,125,000
-
1998-04-28soldstatus $200,000
-
1979-11-01soldstatus $80,000
-
1978-06-01soldstatus $65,500
ⓘ Source: listings_history table (triggers on properties + properties_extension) + one-shot
backfill from property_details.listing_events for pre-trigger history.
Tax reassessment forecast FL · Resets to sale price
- Current annual tax
- $15,693 · $1,308/mo
- Projected year-2 tax
- $15,693 · $1,308/mo
- Expected delta
- $0/yr ($0/mo · -0.0%)
ⓘ Screening estimate from a state-policy table — verify with the county assessor before closing.
Climate risk First Street
- Flood 9/10 Extreme FEMA zone AE · 99% chance over 30 yrs
- Wildfire 1/10 Low
- Heat 10/10 Extreme 7 d/yr ≥102°F today · 29 d/yr by 30 yrs out
- Wind 10/10 Extreme 99% chance of damaging wind over 30 yrs
- Air quality 2/10 Low 1 unhealthy d/yr today · 1 by 30 yrs out
Nearby sold comps map
Loading sold comps map…
Walkable amenities ~0.75 mi
Loading nearby amenities…
Taxation est. · year 1
- Rental income
- $159,924
- − Mortgage interest
- −$83,967
- − Property taxes
- −$15,693
- − Insurance
- −$12,614
- − Repairs & maintenance
- −$12,794
- − Management
- −$12,794
- − Depreciation
- −$43,607
- Taxable loss
- −$21,545
- Est. tax savings @ 24.0%
- +$5,171
- After-tax cash flow
- $8,873/yr
For passive investors: Depreciation is non-cash, so a rental often shows a tax loss while cash-flowing — sheltering income. Rental losses are passive: they offset passive income freely, and up to $25,000/yr can offset ordinary (W-2) income if you actively participate and your MAGI is under $100k (phasing out to $0 by $150k); unused losses carry forward. On sale, claimed depreciation is recaptured at up to 25%, and gains may owe capital-gains tax (a 1031 exchange can defer both). Figures are a year-1 estimate at your 24.0% rate — not tax advice; consult a CPA.
Schools (NCES district)
- District
- Miami-Dade
- NCES district ID
- 1200390
- Math proficiency
- 45% ▼ -16.00%
- Reading proficiency
- 54% ▼ -5.00%
- Median HH income
- $43,928
- Composite
- 41.76/100
- National rank
- #3397
- State rank
- #40 of 73 in FL
Livability — Miami
- Score
- 78/100
- State rank
- #177
- US rank
- #2724
Category grades
Schools grade is shown separately in the Schools card above.
Census & demographics
- Census place
- Miami, FL
- County
- Miami-Dade County · 2,697,751 people
- City population
- 827,308
- Metro
- Miami-Fort Lauderdale-Pompano Beach, FL
- Population (ZIP)
- 28,980
- Household income
- $75,051
- Rent vs Own
- Severe rent burden
- 2049.0
Population outlook (Miami-Dade County) Hauer SSP2
- Today (2025)
- 3,126,439 people
- By 2030
- 3,325,765 · +6.4%
- By 2040
- 3,697,561 · +18.3%
- By 2050
- 4,012,134 · +28.3%
- By 2075
- 4,605,612 · +47.3%
- By 2100
- 4,866,598 · +55.7%
Race, ethnicity, and origin ACS 2023
- Neighborhood character
- Highly diverse neighborhood (Simpson 0.70)
- Race & ethnicity
- Hispanic / Latino 36% White 29% Black 29% Two or more races 21% Asian 1%
- Hispanic origin (detail)
- Puerto Rican 3% Cuban 11% Dominican 2% Salvadoran 3%
- Common ancestry
- Hispanic 16% Estonian 2% Lithuanian 2%
- Foreign-born
- 41% · Canada, Jamaica, Dominican Republic
- Languages at home
- 36% English-only · Spanish 39% French/Haitian/Cajun 19% Other Indo-European 4%
Political lean MEDSL · Miami-Dade
- 2024 margin
- R (+11.4) · D 43.9% · R 55.4%
- 2008→2024 swing
- -27.6pp toward R · 2008: 16.1pp · 2024: -11.4pp
- All cycles
- 2024: R+11.4 2020: D+7.3 2016: D+29.6 2012: D+23.7 2008: D+16.1
Not yet ingested
- Civics
- —
Market trends
- HPI YoY
- ▼ -890.01%
- Current HPI
- 551.4791
- Rent YoY
- ▲ 0.33%
- Metro
- Miami-Fort Lauderdale-Pompano Beach, FL
- State GDP YoY
- ▲ 3.28%
- F500 in state
- 36
Industry mix (Fortune 500 HQ in FL)
| Industry | F500 HQs | Revenue |
|---|---|---|
| Industrial Technology | 2 | $29B |
|
||
| Insurance | 2 | $17B |
|
||
| Retail | 1 | $60B |
|
||
| Technology Distribution | 1 | $58B |
|
||
| Homebuilding | 1 | $35B |
|
||
| Technology Manufacturing | 1 | $35B |
|
||
Price history
+2266.4% since first listed12 events — show timeline
- 2026-04-07 Listed $1,550,000 MARMLS
- 2019-07-23 Sold (Public Records) $605,000 Public Records
- 2019-07-17 Sold (MLS) $605,000 MARMLS
- 2019-06-26 Pending — MARMLS
- 2019-06-06 Pending — MARMLS
- 2019-06-05 Relisted — MARMLS
- 2019-05-23 Pending — MARMLS
- 2019-05-07 Listed $626,000 MARMLS
- 2014-07-21 Sold (Public Records) $2,125,000 Public Records
- 1998-04-28 Sold (Public Records) $200,000 Public Records
- 1979-11-01 Sold (Public Records) $80,000 Public Records
- 1978-06-01 Sold (Public Records) $65,500 Public Records
Property tax history
+9.6%/yrLatest (2025): $15,693 · +6.0% YoY. Source: county tax records.
Cash-flow waterfall
monthlySold comps — $/sqft
last 12 mo · ≤1 miLoading sold comps…