20233 S 85th St E · Webbers Falls, OK
Flood risk 1/10 · Minimal
- FEMA flood zone
- X (unshaded)
- Chance of flooding over 30 yrs
- 0.0%
- Est. flood insurance / yr
- $507 – $1,088
Fire risk 6/10 · Moderate
- Est. fire insurance / yr
- $2,463 – $4,575
Heat risk 6/10 · Moderate
- Hot days now (above 112°F)
- 7 days/yr
- Hot days in 30 yrs
- 18 days/yr
Wind risk 3/10 · Minor
- Chance of severe wind over 30 yrs
- 6.0%
Air-quality risk 2/10 · Minimal
- Unhealthy air days now
- 1 days/yr
- Unhealthy air days in 30 yrs
- 1 days/yr
Risk factors via First Street. Map © Google.
Why this score? — see what drove the B+ grade
The composite is a weighted blend of 9 inputs, each scored 0–100. Each bar is that input's sub-score; the figure is the points it added to the 100-point composite (weight × sub-score).
- Cash flow +30.0/30.0
- 1% rule +10.0/10.0
- DSCR +10.0/10.0
- ARV discount +7.5/15.0
- Appreciation +7.5/10.0
- Schools +3.3/10.0
- Livability +3.1/5.0
- Rent growth +2.5/5.0
- Condition / age +2.5/5.0
$50,000
🖨 Deal sheet (PDF) 📄 Offer letter ✓ Due diligence
Listing remarks
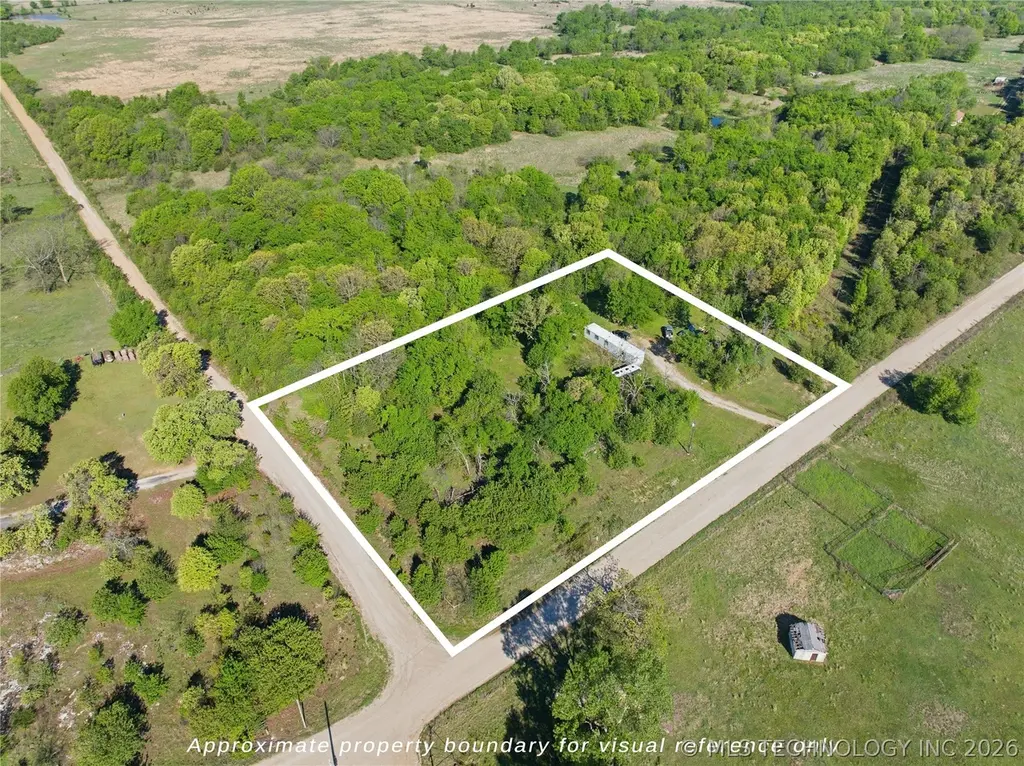
Experience the perfect blend of country freedom in this home on approximately two acres (acreage to be determined by survey). The corner lot property is situated within the highly sought-after Warner School District, offering the space you’ve been dreaming of with the peace of mind of a central location. Whether you are looking for a starter home with room to grow or a peaceful place to downsize without sacrificing land, this property delivers. Sold as-is. Don't miss this opportunity to own your slice of the country!
Key facts
- Corner lot
- 2 acre lot
- Built 1969
Tags
Property features AI
Exterior
- Security: No safety shelter
- Utilities: Electricity available; Phone available; Water available; Septic tank; Rural water source
- Home design: Single-story; Faces north
- Construction: Aluminum siding; Metal roof; Year built reported by owner
- Exterior features: Porch; Partial fencing; Mature trees; Wooded lot
Interior
- Kitchen: Oven; Range
- Flooring: Carpet; Laminate
- Bathrooms: 1 full bathroom
- Interior features: Ceiling fan(s); Laminate counters; Aluminum frame windows
- Laundry & utility: Washer hookup; Electric water heater
Neighborhood map
What this means for you Summary
Snapshot
- This is a 2-bed/1.0-bath manufactured listed at $50k.
Deal economics
- At list price, monthly cash flow is $296 ($4k/yr) — positive.
- The deal already cash-flows at list — no discount required.
- Meets the 1% rule at list price ($812 rent vs $50k).
- Recommended offer: $48k (3.0% below list) — sets the bar for market timing.
Location & tenants
- Location reads 62/100 on livability (#269 in OK) — a middle-class / working-renter tenant base. Strengths: cost of living A+, housing A+, crime A-; Watch: health & safety C-, amenities F, commute F.
- Warner (rural): math 40% / reading 38% proficiency, ranked #24 of 270 in OK (top 9%) — families likely to look elsewhere, expect single-tenant / working-renter base with shorter leases; 63% free/reduced lunch — lower-income household profile, screen leases tightly.
- Zoned schools: Warner Es (math 39% / reading 36%, grade F, #127 of 845 statewide, top 15%, 600 students, 0% FRL); Warner Hs (math 44% / reading 44%, grade F, #15 of 447 statewide, top 4%, 214 students, 0% FRL) — zoned schools average 0% FRL vs 63% district-wide (63 pts lower); this property's tenant base skews higher-income than the district average.
- Market conditions: 19 active listings in the ZIP; 58 units permitted in Muskogee County in 2024 (0 in 5+ unit buildings).
Forward outlook
- In year one you build about $3k of equity ($346 loan paydown + $3k appreciation (5.1% local appreciation)).
- Muskogee County population projected at -15% by 2050 — secular population decline; favor cash flow + early exit over multi-decade hold.
- At projected returns (5.1% appreciation + 3.0% rent growth), your $14k cash investment doubles in ~3 years — after that, you're playing with house money.
Negotiation context
- It's been on market 51 days — a 3% lower offer ($48k) is reasonable based on typical stale-listing flexibility.
Risks & watch-outs
- Climate carrying-cost: major wildfire risk; extreme-heat days projected 7→18/yr by 2055 (HVAC capex compounding) — expect insurance premiums to compound above CPI over the hold.
Questions for the listing agent
- It's been on market 51 days. Have you received any prior offers? Is the seller open to a 3% concession, seller financing, or rate buy-down credit?
- Built in 1969 — when were the roof, HVAC, electrical panel, plumbing, and water heater last replaced?
- Is there a deadline driving the sale (1031 exchange, divorce, estate, relocation)? That informs how much negotiation room exists.
- Schools are F-rated, which usually means shorter tenancies and higher turnover. Who's the typical renter profile here, and what's been the actual vacancy rate?
- What's the average days-on-market for RENTAL listings here right now (not sales)? A rising rental-DOM trend means longer vacancies and softer asking-rent achievability than the comps imply.
- What's the recent tenant-quality profile in this submarket — average credit score on applications, eviction rate, late-payment / NSF rate, and stable-employment percentage? A property-management company in the area should have these aggregated.
- How much new for-sale + rental construction is in the pipeline within 1–3 miles? Heavy new supply typically softens prices + rents 12–24 months out; constrained supply supports both.
Investment metrics
- 1% rule
- 1.62% ✓
- Cap rate
- 13.39%
- Cash-on-cash
- 25.34%
- DSCR
- 2.13
- GRM
- 5.1
CMA / ARV
No comps found within radius.
Projected returns pro-forma
5.07% appreciation · 3.0% rent growth · sell at horizon
- IRR
- 35.1%
- Equity multiple
- 3.18×
- Total profit
- $30,559
- Equity at exit
- $28,537
- IRR
- 33.4%
- Equity multiple
- 6.43×
- Total profit
- $76,044
- Equity at exit
- $49,419
Cash invested: $14,000 (down + closing). Projections, not guarantees.
Landlord ↔ Tenant lean methodology
- Overall (STATE)
- 83 Strongly Landlord-Friendly
- State Oklahoma
- 83 Strongly Landlord-Friendly · R+20
- County
- — inherits STATE
- City
- — inherits STATE
ZIP-level market 74470
- Home prices YoY
- 1.8%
- Active inventory
- 19
- Price-to-rent
- 5.1×
Monthly cashflow live
- Estimated rent
- $812 medium interval (Pro) →
- Mortgage (P&I)
- −$262
- Tax est. 1.5%
- −$62 /mo · $750/yr
- Insurance
- −$21
- HOA
- −$0
- Vacancy / Maint / Mgmt
- −$170
- Net cashflow
- $296
Break-even live
Sensitivity live
| Price | -10% $330 | -5% $313 | +0% $296 | +5% $278 | +10% $261 |
|---|---|---|---|---|---|
| Rent | -10% $232 | -5% $264 | +0% $296 | +5% $328 | +10% $360 |
| Rate | -1.0pp $321 | -0.5pp $308 | base $296 | +0.5pp $283 | +1.0pp $270 |
UW: 25.0% down · 7.5% · 30yr · 1.5% tax · 5.0% vac · 8.0% maint · 8.0% mgmt
Financing live
Cash to close
- Down payment
- $12,500
- Closing costs
- $1,500
- Reserves months
- —
- Total cash needed
- —
Loan-product check · same deal, 3 products live
Conventional
25% down · 7.5% · 30yr
- Down + closing
- —
- Monthly P&I
- —
- Monthly cashflow
- —
- DSCR
- —
- Eligible?
- —
Personal DTI + credit; lowest rate.
DSCR
20% down · 8.5% · 30yr
- Down + closing
- —
- Monthly P&I
- —
- Monthly cashflow
- —
- DSCR
- —
- Eligible?
- —
No personal income docs; deal must DSCR.
Hard money
10% down · 12.0% · 12mo
- Down + closing
- —
- Monthly P&I
- —
- Monthly cashflow
- —
- DSCR
- —
- Eligible?
- —
Short-term bridge; refi at stabilization.
Listing history 7 events
-
2026-06-07statusdays on market $50,000 Pending 51 DOM
-
2026-06-02days on market $50,000 Active 49 DOM
-
2026-06-01days on market $50,000 Active 48 DOM
-
2026-05-31days on market $50,000 Active 47 DOM
-
2026-05-30days on market $50,000 Active 46 DOM
-
2026-04-13$50,000 Active
-
2006-04-28soldstatus $393,500
ⓘ Source: listings_history table (triggers on properties + properties_extension) + one-shot
backfill from property_details.listing_events for pre-trigger history.
Climate risk First Street
- Flood 1/10 Low FEMA zone X (unshaded) · 0% chance over 30 yrs
- Wildfire 6/10 Major
- Heat 6/10 Major 7 d/yr ≥112°F today · 18 d/yr by 30 yrs out
- Wind 3/10 Moderate 6% chance of damaging wind over 30 yrs
- Air quality 2/10 Low 1 unhealthy d/yr today · 1 by 30 yrs out
Nearby sold comps map
Loading sold comps map…
Walkable amenities ~0.75 mi
Loading nearby amenities…
Taxation est. · year 1
- Rental income
- $9,740
- − Mortgage interest
- −$2,801
- − Property taxes
- −$750
- − Insurance
- −$250
- − Repairs & maintenance
- −$779
- − Management
- −$779
- − Depreciation
- −$1,455
- Taxable income
- $2,926
- Est. tax owed @ 24.0%
- −$702
- After-tax cash flow
- $2,846/yr
For passive investors: Depreciation is non-cash, so a rental often shows a tax loss while cash-flowing — sheltering income. Rental losses are passive: they offset passive income freely, and up to $25,000/yr can offset ordinary (W-2) income if you actively participate and your MAGI is under $100k (phasing out to $0 by $150k); unused losses carry forward. On sale, claimed depreciation is recaptured at up to 25%, and gains may owe capital-gains tax (a 1031 exchange can defer both). Figures are a year-1 estimate at your 24.0% rate — not tax advice; consult a CPA.
Schools (NCES district)
- District
- Warner
- NCES district ID
- 4031650
- Math proficiency
- 40% ▼ -11.00%
- Reading proficiency
- 38% ▼ -20.00%
- Median HH income
- $41,068
- Composite
- 32.83/100
- National rank
- #5619
- State rank
- #24 of 270 in OK
Livability — Webbers Falls
- Score
- 62/100
- State rank
- #269
- US rank
- #17101
Category grades
Schools grade is shown separately in the Schools card above.
Census & demographics
- Population (ZIP)
- 1,362
Population outlook (Muskogee County) Hauer SSP2
- Today (2025)
- 66,842 people
- By 2030
- 64,969 · -2.8%
- By 2040
- 60,920 · -8.9%
- By 2050
- 56,978 · -14.8%
- By 2075
- 47,160 · -29.4%
- By 2100
- 35,336 · -47.1%
Race, ethnicity, and origin ACS 2023
- Neighborhood character
- Diverse neighborhood (Simpson 0.62)
- Race & ethnicity
- White 61% Two or more races 20% Native American 17% Asian 1%
- Common ancestry
- Italian 5% Slovak 1% Serbian 1%
- Foreign-born
- 1% · China, Vietnam
- Languages at home
- 98% English-only · Spanish 1% Chinese 1%
Political lean MEDSL · Muskogee
- 2024 margin
- Solid R (+37.6) · D 30.4% · R 68.0% · Other 1.7%
- 2008→2024 swing
- -22.6pp toward R · 2008: -15.0pp · 2024: -37.6pp
- All cycles
- 2024: R+37.6 2020: R+33.9 2016: R+29.2 2012: R+14.8 2008: R+15.0
Not yet ingested
- Civics
- —
Market trends
- HPI YoY
- ▲ 5.07%
- Current HPI
- 283.3825
- Rent YoY
- —
- Metro
- —
- State GDP YoY
- ▲ 1.55%
- F500 in state
- 6
Industry mix (Fortune 500 HQ in OK)
| Industry | F500 HQs | Revenue |
|---|---|---|
| Energy | 3 | $48B |
|
||
Price history
-87.3% since first listed2 events — show timeline
- 2026-04-13 Listed $50,000 MLS Technology, Inc.
- 2006-04-28 Sold (Public Records) $393,500 Public Records
Property tax history
+6.5%/yrLatest (2025): $98 · +6.5% YoY. Source: county tax records.
Cash-flow waterfall
monthlySold comps — $/sqft
last 12 mo · ≤1 miLoading sold comps…