54194 W Organ Pipe Rd · Ak-Chin Village, AZ
Flood risk 1/10 · Minimal
- FEMA flood zone
- X (unshaded)
- Chance of flooding over 30 yrs
- 0.0%
- Est. flood insurance / yr
- $507 – $1,088
Fire risk 4/10 · Minor
- Est. fire insurance / yr
- $610 – $1,132
Heat risk 9/10 · Severe
- Hot days now (above 114°F)
- 7 days/yr
- Hot days in 30 yrs
- 18 days/yr
Wind risk 1/10 · Minimal
- Chance of severe wind over 30 yrs
- —
Air-quality risk 1/10 · Minimal
- Unhealthy air days now
- 0 days/yr
- Unhealthy air days in 30 yrs
- 0 days/yr
Risk factors via First Street. Map © Google.
Why this score? — see what drove the C- grade
The composite is a weighted blend of 9 inputs, each scored 0–100. Each bar is that input's sub-score; the figure is the points it added to the 100-point composite (weight × sub-score).
- Cash flow +21.3/30.0
- ARV discount +10.4/15.0
- DSCR +6.8/10.0
- 1% rule +4.3/10.0
- Livability +2.5/5.0
- Condition / age +2.5/5.0
- Rent growth +2.0/5.0
- Schools +1.5/10.0
- Appreciation +0.0/10.0
$185,000
🖨 Deal sheet 📄 Offer letter ✓ Due diligence
Listing remarks
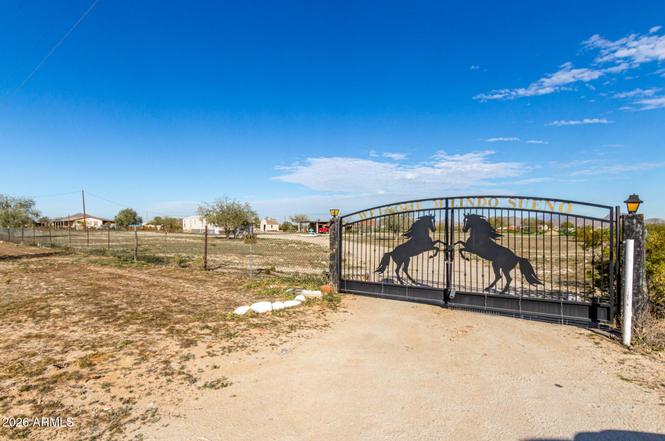
Welcome to Mi Lindo Sueño! This 3+ acre ranch sits at the peaceful outskirts of Maricopa, offering beautiful mountain views and serene country living while remaining conveniently close to city amenities. The manufactured home features a semi-open floor plan with vaulted ceilings that create a bright, airy atmosphere, a spacious kitchen with abundant storage & appliances, and a primary bedroom with a bathroom. Step out to the back porch to an ideal spot to relax and enjoy spectacular sunsets. The expansive land includes multiple storage sheds and ample space for horses, livestock, and your vision of ranch life. Whether you're seeking a peaceful retreat or room to grow, this prop
Key facts
- Spacious kitchen
- Space for horses
- Back porch
Tags
Property features AI
Finance
- HOA & community: No association fees
Exterior
- Parking: RV gate; Separate storage area
- Utilities: Septic (in and connected); Water hauled
- Home design: Manufactured/mobile home; Fee simple ownership; Mountain views; Dirt road surface
- Construction: Wood siding and wood frame construction; Painted exterior; Composition roof
- Exterior features: Chain-link and wire fencing; Storage area; Horses allowed; Natural desert front and back; Dirt front and back; County-maintained road access
Interior
- Kitchen: Refrigerator; Disposal
- Bedrooms: Up to 3 possible bedrooms
- Flooring: Laminate; Tile; Wood
- Bathrooms: 2 full bathrooms
- Heating & cooling: Electric heating; Central air conditioning
- Interior features: High-speed internet; Eat-in kitchen; No interior steps; Vaulted ceilings; Full bathroom in master bedroom; Dual-pane windows; Storage
- Laundry & utility: Laundry inside
Neighborhood map
What this means for you Summary
Snapshot
- This is a 3-bed/2.0-bath manufactured listed at $185k.
Deal economics
- At list price, monthly cash flow is $270 ($3k/yr) — positive.
- The deal already cash-flows at list — no discount required.
- To meet the 1% rule (rent ≥ 1% of price), the offer needs to be $172k (7.3% below list).
- Recommended offer: $163k (12.0% below list) — sets the bar for market timing.
- Cap rate 8.0% vs local median 3.2% in Ak-Chin Village — top-decile yield for the area; either an underpriced asset or a hidden risk that comps aren't pricing in. Stress-test before assuming the spread holds.
Location & tenants
- Location reads: area grade C — affects rentability + tenant quality, not the cash-flow math above.
- Casa Grande Union High School District (4453) (suburban): math 14% / reading 21% proficiency, ranked #193 of 249 in AZ (top 78%) — low school quality limits family demand, transient renter base, plan for 1-2y turnover.
- Zoned schools: Vista Grande High School (math 10% / reading 16%, grade F, #279 of 381 statewide, top 73%, 1,790 students, 54% FRL).
- Market conditions: Rents soft (-2.1%/yr); 415 active listings in the ZIP; solid renter incomes; 9,504 units permitted in Pinal County in 2024 (776 in 5+ unit buildings).
Forward outlook
- Local home prices are declining (-3.0%/yr); year-one equity from $1k of loan paydown is wiped out by about $6k of value loss. Plan a longer hold.
Negotiation context
- It's been on market 142 days — a 12% lower offer ($163k) is reasonable based on typical stale-listing flexibility.
- 13 sale attempts since 23y ago; this cycle's ask is 825% above the opening price — seller raised mid-cycle; expect resistance to lowballs.
Risks & watch-outs
- Climate carrying-cost: extreme-heat days projected 7→18/yr by 2055 (HVAC capex compounding) — expect insurance premiums to compound above CPI over the hold.
Questions for the listing agent
- It's been on market 142 days. Have you received any prior offers? Is the seller open to a 12% concession, seller financing, or rate buy-down credit?
- Why hasn't it sold? Are there any deal-killer items the seller is aware of (foundation, flood, title, zoning, code violations)?
- Is there a deadline driving the sale (1031 exchange, divorce, estate, relocation)? That informs how much negotiation room exists.
- What's the average days-on-market for RENTAL listings here right now (not sales)? A rising rental-DOM trend means longer vacancies and softer asking-rent achievability than the comps imply.
- What's the recent tenant-quality profile in this submarket — average credit score on applications, eviction rate, late-payment / NSF rate, and stable-employment percentage? A property-management company in the area should have these aggregated.
- How much new for-sale + rental construction is in the pipeline within 1–3 miles? Heavy new supply typically softens prices + rents 12–24 months out; constrained supply supports both.
Investment metrics
- 1% rule
- 0.93% ✗
- Cap rate
- 8.04%
- Cash-on-cash
- 6.25%
- DSCR
- 1.28
- GRM
- 9.0
CMA / ARV
- ARV (on-the-fly)
- $197,760
- Comps found
- 2
Show comp detail 2 sales within ~0.75 mi
| Address | Dist | Beds/Ba | Sqft | Sold | Price | $/sf | Match |
|---|---|---|---|---|---|---|---|
| 54084 W Badger Rd | 0.36mi | 2/2.0 (-1) | 1,057 (+10%) | 22mo | $217,500 | $206 | 43 |
| 53129 W Badger Rd | 0.72mi | 2/2.0 (-1) | 910 (-5%) | 15mo | $140,000 | $154 | 41 |
Match score weights: distance 35% · size 25% · config 20% · recency 20%. Top-matched comps best support the ARV.
Projected returns pro-forma
-3.0% appreciation · 0.0% rent growth · sell at horizon
- IRR
- -9.7%
- Equity multiple
- 0.65×
- Total profit
- $-17,913
- Equity at exit
- $27,584
- IRR
- -4.4%
- Equity multiple
- 0.74×
- Total profit
- $-13,274
- Equity at exit
- $15,995
Cash invested: $51,800 (down + closing). Projections, not guarantees.
Landlord ↔ Tenant lean methodology
- Overall (STATE)
- 87 Strongly Landlord-Friendly
- State Arizona
- 87 Strongly Landlord-Friendly · R+3
- County
- — inherits STATE
- City
- — inherits STATE
ZIP-level market 85139
- Home prices YoY
- -17.4%
- Rents YoY
- -2.1%
- Active inventory
- 415
- Price-to-rent
- 9.0×
Monthly cashflow live
- Estimated rent
- $1,715 medium interval (Pro) →
- Mortgage (P&I)
- −$970
- Tax from tax record
- −$38 /mo · $456/yr
- Insurance
- −$77
- HOA
- −$0
- Vacancy / Maint / Mgmt
- −$360
- Net cashflow
- $270
Break-even live
UW: 25.0% down · 7.5% · 30yr · 1.5% tax · 5.0% vac · 8.0% maint · 8.0% mgmt
Financing live
Cash to close
- Down payment
- $46,250
- Closing costs
- $5,550
- Reserves months
- —
- Total cash needed
- —
Loan-product check · same deal, 3 products live
Conventional
25% down · 7.5% · 30yr
- Down + closing
- —
- Monthly P&I
- —
- Monthly cashflow
- —
- DSCR
- —
- Eligible?
- —
Personal DTI + credit; lowest rate.
DSCR
20% down · 8.5% · 30yr
- Down + closing
- —
- Monthly P&I
- —
- Monthly cashflow
- —
- DSCR
- —
- Eligible?
- —
No personal income docs; deal must DSCR.
Hard money
10% down · 12.0% · 12mo
- Down + closing
- —
- Monthly P&I
- —
- Monthly cashflow
- —
- DSCR
- —
- Eligible?
- —
Short-term bridge; refi at stabilization.
Listing history 50 events
-
2026-06-18days on market $185,000 Active 142 DOM
-
2026-06-17days on market $185,000 Active 141 DOM
-
2026-06-16days on market $185,000 Active 140 DOM
-
2026-06-15days on market $185,000 Active 139 DOM
-
2026-06-13days on market $185,000 Active 137 DOM
-
2026-06-13days on market $185,000 Active 136 DOM
-
2026-06-09days on market $185,000 Active 133 DOM
-
2026-06-08days on market $185,000 Active 132 DOM
-
2026-06-07days on market $185,000 Active 131 DOM
-
2026-06-04days on market $185,000 Active 129 DOM
-
2026-06-03days on market $185,000 Active 128 DOM
-
2026-06-02days on market $185,000 Active 127 DOM
-
2026-06-01days on market $185,000 Active 126 DOM
-
2026-05-31days on market $185,000 Active 125 DOM
-
2026-04-03price $185,000
-
2026-03-19price $189,000
-
2026-03-03price $194,500
-
2026-02-20price $195,000
-
2026-01-26price $200,000
-
2026-01-26$20,000 Active
-
2025-05-13historical
-
2025-01-28price $190,000
-
2025-01-19status Active
-
2025-01-03historical Under Contract Accepting Backups
-
2024-12-31status Active
-
2024-12-27historical Under Contract Accepting Backups
-
2024-11-13$200,000 Active
-
2024-09-10historical
-
2024-07-31price $208,000
-
2024-07-02$215,000 Active
-
2024-07-02historical
-
2024-06-20price $219,900
-
2024-06-01$225,000 Active
-
2024-04-09historical
-
2024-01-01$250,000 Active
-
2023-05-11soldstatus $195,000 Closed
-
2023-05-11soldstatus $190,000
-
2023-05-03status Pending
-
2023-02-09$195,000 Active
-
2022-12-30historical
-
2022-07-17price $204,900
-
2022-07-06status Active
-
2022-07-06status Pending
-
2022-06-04$215,000 Active
-
2021-10-18historical
-
2021-09-13$199,900 Active
-
2004-04-30historical
-
2003-10-21$58,000
-
2003-08-01historical
-
2003-02-28$58,000
ⓘ Source: listings_history table (triggers on properties + properties_extension) + one-shot
backfill from property_details.listing_events for pre-trigger history.
Tax reassessment forecast AZ · Resets to sale price
- Current annual tax
- $456 · $38/mo
- Projected year-2 tax
- $1,221 · $102/mo
- Expected delta
- +$765/yr (+$64/mo · 167.9%)
ⓘ Screening estimate from a state-policy table — verify with the county assessor before closing.
Climate risk First Street
- Flood 1/10 Low FEMA zone X (unshaded) · 0% chance over 30 yrs
- Wildfire 4/10 Moderate
- Heat 9/10 Extreme 7 d/yr ≥114°F today · 18 d/yr by 30 yrs out
- Wind 1/10 Low
- Air quality 1/10 Low 0 unhealthy d/yr today · 0 by 30 yrs out
Nearby sold comps map
Loading sold comps map…
Walkable amenities ~0.75 mi
Loading nearby amenities…
Taxation est. · year 1
- Rental income
- $20,583
- − Mortgage interest
- −$10,363
- − Property taxes
- −$456
- − Insurance
- −$925
- − Repairs & maintenance
- −$1,647
- − Management
- −$1,647
- − Depreciation
- −$5,382
- Taxable income
- $164
- Est. tax owed @ 24.0%
- −$39
- After-tax cash flow
- $3,198/yr
For passive investors: Depreciation is non-cash, so a rental often shows a tax loss while cash-flowing — sheltering income. Rental losses are passive: they offset passive income freely, and up to $25,000/yr can offset ordinary (W-2) income if you actively participate and your MAGI is under $100k (phasing out to $0 by $150k); unused losses carry forward. On sale, claimed depreciation is recaptured at up to 25%, and gains may owe capital-gains tax (a 1031 exchange can defer both). Figures are a year-1 estimate at your 24.0% rate — not tax advice; consult a CPA.
Schools (NCES district)
- District
- Casa Grande Union High School District (4453)
- NCES district ID
- 0401740
- Math proficiency
- 14% ▼ -15.00%
- Reading proficiency
- 21% ▼ -10.00%
- Median HH income
- $45,373
- Composite
- 15.38/100
- National rank
- #9319
- State rank
- #193 of 249 in AZ
Livability — Ak-Chin Village
No livability data for this city. (Only ~50 U.S. cities are tracked.)
Census & demographics
- County
- Pinal County · 399,947 people
- Metro
- Phoenix-Mesa-Chandler, AZ
- Population (ZIP)
- 20,784
- Household income
- $86,894
- Rent vs Own
- Severe rent burden
- 272.0
Population outlook (Pinal County) Hauer SSP2
- Today (2025)
- 437,574 people
- By 2030
- 446,903 · +2.1%
- By 2040
- 452,589 · +3.4%
- By 2050
- 444,126 · +1.5%
- By 2075
- 430,300 · -1.7%
- By 2100
- 393,536 · -10.1%
Race, ethnicity, and origin ACS 2023
- Neighborhood character
- Diverse neighborhood (Simpson 0.68)
- Race & ethnicity
- White 48% Hispanic / Latino 28% Two or more races 13% Black 9% Native American 8% Asian 2%
- Hispanic origin (detail)
- Mexican 25%
- Common ancestry
- Portuguese 2% Lithuanian 2% Italian 2%
- Foreign-born
- 10% · Canada
- Languages at home
- 80% English-only · Spanish 17% Vietnamese 1% Other Asian/Pacific 0%
Political lean MEDSL · Pinal
- 2024 margin
- Strong R (+22.1) · D 38.5% · R 60.6%
- 2008→2024 swing
- -7.6pp toward R · 2008: -14.5pp · 2024: -22.1pp
- All cycles
- 2024: R+22.1 2020: R+17.3 2016: R+19.3 2012: R+17.1 2008: R+14.5
Not yet ingested
- Civics
- —
Market trends
- HPI YoY
- ▼ -66.22%
- Current HPI
- 313.8539
- Rent YoY
- ▼ -2.10%
- Metro
- Phoenix-Mesa-Chandler, AZ
- State GDP YoY
- ▲ 4.54%
- F500 in state
- 20
Industry mix (Fortune 500 HQ in AZ)
| Industry | F500 HQs | Revenue |
|---|---|---|
| Technology | 2 | $13B |
|
||
| Mining / Metals | 1 | $23B |
|
||
| Environmental Services | 1 | $16B |
|
||
| Metals / Steel | 1 | $14B |
|
||
| Technology Distribution | 1 | $9B |
|
||
| Homebuilding | 1 | $8B |
|
||
Price history
+219.0% since first listed36 events — show timeline
- 2026-04-03 Price Changed $185,000 ARMLS
- 2026-03-19 Price Changed $189,000 ARMLS
- 2026-03-03 Price Changed $194,500 ARMLS
- 2026-02-20 Price Changed $195,000 ARMLS
- 2026-01-26 Price Changed $200,000 ARMLS
- 2026-01-26 Listed $20,000 ARMLS
- 2025-05-13 Listing Removed — ARMLS
- 2025-01-28 Price Changed $190,000 ARMLS
- 2025-01-19 Relisted — ARMLS
- 2025-01-03 Contingent — ARMLS
- 2024-12-31 Relisted — ARMLS
- 2024-12-27 Contingent — ARMLS
- 2024-11-13 Listed $200,000 ARMLS
- 2024-09-10 Listing Removed — ARMLS
- 2024-07-31 Price Changed $208,000 ARMLS
- 2024-07-02 Listing Removed — ARMLS
- 2024-07-02 Listed $215,000 ARMLS
- 2024-06-20 Price Changed $219,900 ARMLS
- 2024-06-01 Listed $225,000 ARMLS
- 2024-04-09 Listing Removed — ARMLS
- 2024-01-01 Listed $250,000 ARMLS
- 2023-05-11 Sold (Public Records) $190,000 Public Records
- 2023-05-11 Sold (MLS) $195,000 ARMLS
- 2023-05-03 Pending — ARMLS
- 2023-02-09 Listed $195,000 ARMLS
- 2022-12-30 Listing Removed — ARMLS
- 2022-07-17 Price Changed $204,900 ARMLS
- 2022-07-06 Relisted — ARMLS
- 2022-07-06 Pending — ARMLS
- 2022-06-04 Listed $215,000 ARMLS
- 2021-10-18 Listing Removed — ARMLS
- 2021-09-13 Listed $199,900 ARMLS
- 2004-04-30 Listing Removed — ARMLS
- 2003-10-21 Listed $58,000 ARMLS
- 2003-08-01 Listing Removed — ARMLS
- 2003-02-28 Listed $58,000 ARMLS
Property tax history
-3.2%/yrLatest (2025): $456 · +13.8% YoY. Source: county tax records.
Cash-flow waterfall
monthlySold comps — $/sqft
last 12 mo · ≤1 miLoading sold comps…