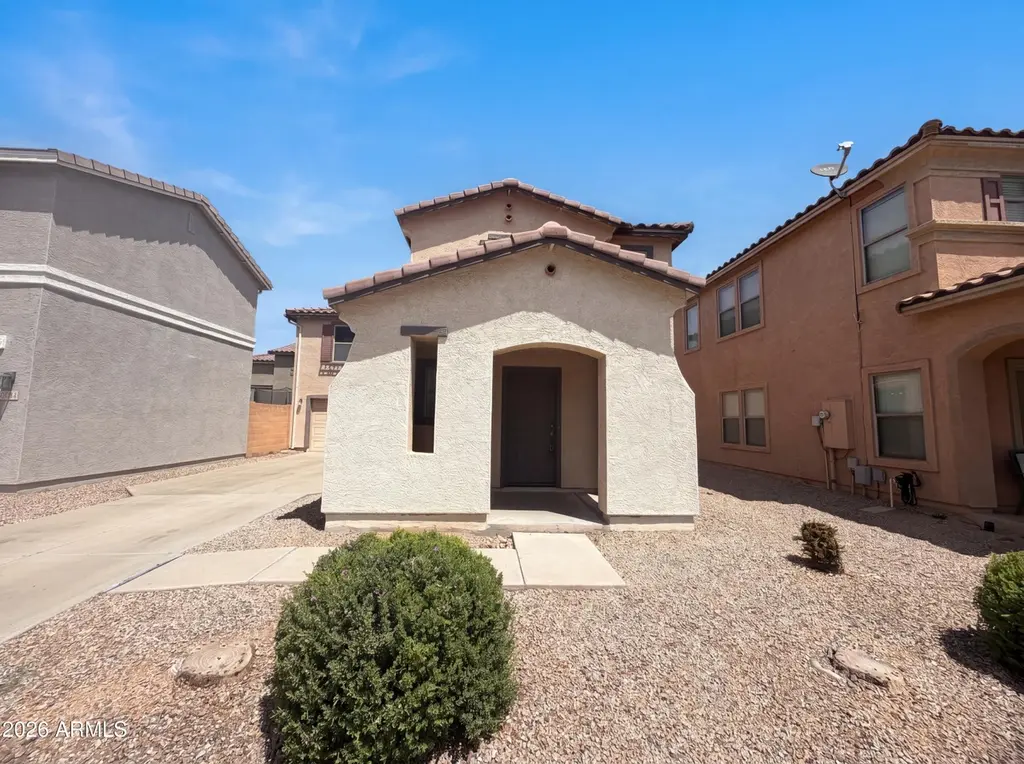
21158 E Stonecrest Dr · Queen Creek, AZ
Flood risk No data
- FEMA flood zone
- —
- Chance of flooding over 30 yrs
- —
- Est. flood insurance / yr
- —
Fire risk No data
- Est. fire insurance / yr
- —
Heat risk No data
- Hot days now (above threshold)
- —
- Hot days in 30 yrs
- —
Wind risk No data
- Chance of severe wind over 30 yrs
- —
Air-quality risk No data
- Unhealthy air days now
- —
- Unhealthy air days in 30 yrs
- —
Risk factors via First Street. Map © Google.
Why this score? — see what drove the D- grade
The composite is a weighted blend of 9 inputs, each scored 0–100. Each bar is that input's sub-score; the figure is the points it added to the 100-point composite (weight × sub-score).
- ARV discount +14.0/15.0
- Cash flow +7.8/30.0
- Schools +4.9/10.0
- Livability +3.6/5.0
- Rent growth +2.6/5.0
- Condition / age +2.5/5.0
- DSCR +1.9/10.0
- 1% rule +1.6/10.0
- Appreciation +0.0/10.0
$367,000
🖨 Deal sheet 📄 Offer letter ✓ Due diligence
Listing remarks MLS
Beautiful two story home in the Indigo Trails community in Queen Creek! This move in ready home offers an open floor plan design, 3 bedrooms, 2.5 bath, large and spacious master bedroom, and a private patio. The HUGE driveway adds plenty of parking space. Easy access to everywhere with nearby shopping and services. The trifecta of properties could be the perfect starter home, investment property, or lock and leave vacation home!
Key facts
- Double sinks
- Functional island
- Covered patio
Tags
Property features AI
Finance
- HOA & community: Monthly association fee of $129; Association covers grounds maintenance
Exterior
- Parking: Covered 2 parking spaces; 2-car garage
- Security: Owned security system
- Utilities: City water; Public sewer
- Home design: Single family residence; Fee simple ownership
- Construction: Synthetic stucco and painted wood frame construction; Tile roof
- Exterior features: Block fence; Desert front landscaping; Desert back landscaping
Interior
- Kitchen: Built-in microwave; Dishwasher; Kitchen island; Laminate counters; Eat-in kitchen
- Bedrooms: 3 bedrooms
- Flooring: Carpet; Tile
- Bathrooms: 2 full bathrooms; 1 half bathroom
- Heating & cooling: Electric heating; Has heating; Has cooling; Cooling: Other
- Interior features: Double vanity; Eat-in kitchen; Kitchen island; Full bath in primary bedroom; Has fireplace; Laminate counters
- Laundry & utility: Upstairs laundry; Washer/dryer hookup only
Neighborhood map
What this means for you Summary
Snapshot
- This is a 3-bed/2.5-bath single-family listed at $367k.
Deal economics
- At list price, monthly cash flow is $-403 ($-5k/yr) — negative.
- To cash-flow at today's rent, offer at most $296k (19.4% below list).
- To meet the 1% rule (rent ≥ 1% of price), the offer needs to be $244k (33.5% below list).
- Recommended offer: $244k (33.5% below list) — sets the bar for 1% rule.
- Cap rate 5.0% vs local median 2.7% in Queen Creek — top-decile yield for the area; either an underpriced asset or a hidden risk that comps aren't pricing in. Stress-test before assuming the spread holds.
Location & tenants
- Location reads 72/100 on livability (#27 in AZ) — a middle-class / working-renter tenant base. Strengths: crime A+, employment A+, housing A+; Watch: health & safety C-, commute F, cost of living F.
- Queen Creek Unified District (4245) (suburban): math 55% / reading 53% proficiency, ranked #25 of 249 in AZ (top 10%) — acceptable for families but not a draw, mixed tenant base, ~2y average lease.
- Zoned schools: Faith Mather Sossaman Elementary School (math 73% / reading 61%, grade B+, #73 of 1,109 statewide, top 7%, 1,114 students, 14% FRL); Queen Creek Junior High School (math 49% / reading 53%, grade C, #23 of 218 statewide, top 11%, 554 students, 17% FRL); Queen Creek High School (math 43% / reading 45%, grade F, #64 of 381 statewide, top 17%, 2,233 students, 15% FRL).
- Market conditions: Rents flat; 850 active listings in the ZIP; 30 comparable units currently listed for rent nearby; rentals at typical pace (median 17d on market — plan ~3-4 weeks tenant-placement turnaround); high-income renter base; 36,011 units permitted in Maricopa County in 2024 (12,801 in 5+ unit buildings).
Forward outlook
- Local home prices are declining (-3.0%/yr); year-one equity from $3k of loan paydown is wiped out by about $11k of value loss. Plan a longer hold.
- Maricopa County population projected at +38% by 2050 — long-run rental-demand tailwind backs the buy-and-hold thesis.
Negotiation context
- It's been on market 52 days — a 3% lower offer ($356k) is reasonable based on typical stale-listing flexibility.
- 3 sale attempts since 12y ago with the ask held roughly flat each time — persistent listings suggest the price (not the market) is what's stuck; bring a comps-based counter.
- Current owner paid $164k; list at $367k implies a 124% gain — meaningful room to come down on a strong offer.
Questions for the listing agent
- What do current leases actually rent for vs. the listed asking? Can we see a recent rent roll and the last 12 months of T-12 income?
- It's been on market 52 days. Have you received any prior offers? Is the seller open to a 34% concession, seller financing, or rate buy-down credit?
- What does the HOA fee cover, when was the last increase, and are there any pending special assessments or reserve-fund shortfalls?
- Is there a deadline driving the sale (1031 exchange, divorce, estate, relocation)? That informs how much negotiation room exists.
- Schools are A-rated — typically a magnet for longer-tenancy family renters. What's the average tenant stay here, and is there a school-zone premium baked into asking?
- The area grade is low — what's the realistic commute time and amenity access for the typical tenant pool here? Any planned neighborhood developments (good or bad) we should know about?
- What's the average days-on-market for RENTAL listings here right now (not sales)? A rising rental-DOM trend means longer vacancies and softer asking-rent achievability than the comps imply.
- What's the recent tenant-quality profile in this submarket — average credit score on applications, eviction rate, late-payment / NSF rate, and stable-employment percentage? A property-management company in the area should have these aggregated.
- How much new for-sale + rental construction is in the pipeline within 1–3 miles? Heavy new supply typically softens prices + rents 12–24 months out; constrained supply supports both.
Investment metrics
- 1% rule
- 0.66% ✗
- Cap rate
- 4.97%
- Cash-on-cash
- -4.71%
- DSCR
- 0.79
- GRM
- 12.5
CMA / ARV
- ARV (median comp)
- $428,915
- List price
- $367,000
- Delta
- -14.44%
- Verdict
- UNDERPRICED
- Comps
- 20 within 1.0 mi
Show comp detail 12 sales within ~0.75 mi
| Address | Dist | Beds/Ba | Sqft | Sold | Price | $/sf | Match |
|---|---|---|---|---|---|---|---|
| 21187 E Tierra Grande Dr | 0.06mi | 3/2.5 | 1,675 (-5%) | 1mo | $390,000 | $233 | 88 |
| 21182 E Stonecrest Dr | 0.05mi | 3/2.5 | 1,675 (-5%) | 3mo | $360,000 | $215 | 87 |
| 22657 S 212th St | 0.26mi | 3/2.0 | 1,681 (-5%) | 3mo | $440,000 | $262 | 76 |
| 21157 E Estrella Rd | 0.51mi | 3/2.0 | 1,759 (-0%) | 1mo | $520,000 | $296 | 73 |
| 21013 E Aldecoa Dr | 0.25mi | 3/2.5 | 1,567 (-11%) | 1mo | $399,999 | $255 | 69 |
| 21072 E Stonecrest Dr | 0.18mi | 3/2.0 | 1,528 (-13%) | 1mo | $396,000 | $259 | 67 |
| 21382 E Via Del Rancho St | 0.52mi | 3/2.0 | 1,721 (-2%) | 4mo | $415,000 | $241 | 66 |
| 22938 S 208th St | 0.50mi | 3/2.0 | 1,870 (+6%) | 3mo | $459,000 | $245 | 62 |
| 21136 E Poco Calle -- | 0.68mi | 3/2.0 | 1,659 (-6%) | 1mo | $465,000 | $280 | 56 |
| 21062 E Via Del Sol -- | 0.73mi | 3/2.0 | 1,659 (-6%) | 3mo | $462,500 | $279 | 52 |
| 23277 S 215th St | 0.71mi | 4/2.0 (+1) | 1,692 (-4%) | 2mo | $409,000 | $242 | 52 |
| 21026 E Calle Luna Ct | 0.70mi | 3/2.0 | 1,638 (-7%) | 3mo | $515,000 | $314 | 52 |
Match score weights: distance 35% · size 25% · config 20% · recency 20%. Top-matched comps best support the ARV.
Projected returns pro-forma
-3.0% appreciation · 0.59% rent growth · sell at horizon
- IRR
- -26.8%
- Equity multiple
- 0.11×
- Total profit
- $-91,015
- Equity at exit
- $54,721
- IRR
- -34.0%
- Equity multiple
- -0.32×
- Total profit
- $-135,273
- Equity at exit
- $31,731
Cash invested: $102,760 (down + closing). Projections, not guarantees.
Landlord ↔ Tenant lean methodology
- Overall (STATE)
- 87 Strongly Landlord-Friendly
- State Arizona
- 87 Strongly Landlord-Friendly · R+3
- County
- — inherits STATE
- City
- — inherits STATE
ZIP-level market 85142
- Home prices YoY
- -30.6%
- Rents YoY
- 0.6%
- Active inventory
- 850
- Price-to-rent
- 12.5×
Monthly cashflow live
- Estimated rent
- $2,440 high interval (Pro) →
- Mortgage (P&I)
- −$1,925
- Tax from tax record
- −$124 /mo · $1,491/yr
- Insurance
- −$153
- HOA
- −$129
- Vacancy / Maint / Mgmt
- −$512
- Net cashflow
- $-403
Break-even live
UW: 25.0% down · 7.5% · 30yr · 1.5% tax · 5.0% vac · 8.0% maint · 8.0% mgmt
Financing live
Cash to close
- Down payment
- $91,750
- Closing costs
- $11,010
- Reserves months
- —
- Total cash needed
- —
Loan-product check · same deal, 3 products live
Conventional
25% down · 7.5% · 30yr
- Down + closing
- —
- Monthly P&I
- —
- Monthly cashflow
- —
- DSCR
- —
- Eligible?
- —
Personal DTI + credit; lowest rate.
DSCR
20% down · 8.5% · 30yr
- Down + closing
- —
- Monthly P&I
- —
- Monthly cashflow
- —
- DSCR
- —
- Eligible?
- —
No personal income docs; deal must DSCR.
Hard money
10% down · 12.0% · 12mo
- Down + closing
- —
- Monthly P&I
- —
- Monthly cashflow
- —
- DSCR
- —
- Eligible?
- —
Short-term bridge; refi at stabilization.
Rent comps 30 comps
| Address | Beds | Baths | Sqft | Rent | $/sqft | DOM | Units | Dist |
|---|---|---|---|---|---|---|---|---|
| 21122 E Stonecrest Dr Queen Creek, AZ | 3.0 | 2.5 | 1864 | $2,100 | $1.13 | 5d | 1 | 0.06mi |
| 21187 E Tierra Grande Dr Queen Creek, AZ | 3.0 | 2.5 | 1675 | $2,100 | $1.25 | 24d | 1 | 0.06mi |
| 22224 S 211th Way Queen Creek, AZ | 4.0 | 2.5 | 2171 | $2,400 | $1.11 | 3d | 1 | 0.10mi |
| 21162 E Aspen Valley Dr Queen Creek, AZ | 4.0 | 2.0 | 1681 | $2,750 | $1.64 | 16d | 1 | 0.16mi |
| 20902 E Via del Palo Queen Creek, AZ | 4.0 | 2.0 | 1678 | $2,215 | $1.32 | 17d | 1 | 0.33mi |
| 22203 S 214th St Queen Creek, AZ | 3.0 | 2.0 | 1695 | $2,500 | $1.47 | 24d | 1 | 0.33mi |
| 21937 S 214th St Queen Creek, AZ | 3.0 | 2.0 | 1783 | $2,405 | $1.35 | 24d | 1 | 0.42mi |
| 21937 S 214th St Queen Creek, AZ | 3.0 | 2.0 | 1783 | $2,305 | $1.29 | 16d | 1 | 0.42mi |
| 21316 E Via del Rancho Queen Creek, AZ | 4.0 | 2.0 | 2400 | $2,495 | $1.04 | 43d | 1 | 0.43mi |
| 21059 E Estrella Rd Queen Creek, AZ | 4.0 | 3.0 | 1944 | $2,535 | $1.30 | 1d | 1 | 0.63mi |
| 21260 E Calle Luna Queen Creek, AZ | 3.0 | 2.0 | 1284 | $1,999 | $1.56 | 5d | 1 | 0.64mi |
| 23277 S 215th St Queen Creek, AZ | 4.0 | 2.0 | 1692 | $2,400 | $1.42 | 43d | 1 | 0.71mi |
| 23196 S 216th St Queen Creek, AZ | 4.0 | 2.5 | 2111 | $2,470 | $1.17 | 24d | 1 | 0.73mi |
| 21870 E Gold Canyon Dr Queen Creek, AZ | 3.0 | 2.0 | 1320 | $2,150 | $1.63 | 43d | 1 | 0.82mi |
| 21319 E Alyssa Rd Queen Creek, AZ | 3.0 | 2.0 | 1476 | $2,400 | $1.63 | 24d | 1 | 0.87mi |
| 21319 E Alyssa Rd Queen Creek, AZ | 3.0 | 2.0 | 1476 | $2,400 | $1.63 | 43d | 1 | 0.87mi |
| 21858 E Puesta del Sol Queen Creek, AZ | 3.0 | 2.0 | 1320 | $1,895 | $1.44 | 10d | 1 | 0.87mi |
| 21858 E Puesta del Sol Queen Creek, AZ | 3.0 | 2.0 | 1320 | $1,895 | $1.44 | 24d | 1 | 0.87mi |
| 20866 S 213th St Queen Creek, AZ | 3.0 | 2.0 | 1385 | $2,800 | $2.02 | 14d | 1 | 0.95mi |
| 21005 E Pecan Ln Queen Creek, AZ | 3.0 | 2.0 | 1500 | $2,400 | $1.60 | 5d | 1 | 0.98mi |
| 20450 E Ocotillo Rd Queen Creek, AZ | 1.0–3.0 | 1.0–2.0 | 935 | $2,243 | $2.40 | 1d | 17 | 0.98mi |
| 22063 E Via del Rancho Queen Creek, AZ | 4.0 | 2.0 | 2046 | $2,725 | $1.33 | 18d | 1 | 1.00mi |
| 20390 E Broadmoor Trl Queen Creek, AZ | 4.0 | 2.5 | 1959 | $2,700 | $1.38 | 5d | 1 | 1.05mi |
| 21192 E Saddle Way Queen Creek, AZ | 3.0 | 2.0 | 1859 | $2,495 | $1.34 | 1d | 1 | 1.06mi |
| 21192 E Saddle Way Queen Creek, AZ | 3.0 | 2.0 | 1859 | $2,595 | $1.40 | 18d | 1 | 1.06mi |
| 21442 E Saddle Ct Queen Creek, AZ | 4.0 | 2.0 | 1916 | $2,595 | $1.35 | 14d | 1 | 1.09mi |
| 22217 E Via del Palo Queen Creek, AZ | 3.0 | 2.5 | 1775 | $2,100 | $1.18 | 43d | 1 | 1.11mi |
| 20821 E Saddle Way Queen Creek, AZ | 4.0 | 2.0 | 2300 | $3,395 | $1.48 | 16d | 1 | 1.13mi |
| 20588 S Ellsworth Lp Rd Queen Creek, AZ | 1.0–3.0 | 1.0–2.0 | 1053 | $2,340 | $2.22 | 1d | 36 | 1.40mi |
| 22352 E Via del Palo Queen Creek, AZ | 4.0 | 2.0 | 1863 | $2,149 | $1.15 | 10d | 1 | 1.46mi |
HOA detail
- Monthly dues
- $129 · $1,548/yr
Listing history 30 events
-
2026-06-18days on market $367,000 Active 52 DOM
-
2026-06-17days on market $367,000 Active 51 DOM
-
2026-06-16days on market $367,000 Active 50 DOM
-
2026-06-15days on market $367,000 Active 49 DOM
-
2026-06-13days on market $367,000 Active 47 DOM
-
2026-06-13days on market $367,000 Active 46 DOM
-
2026-06-09days on market $367,000 Active 43 DOM
-
2026-06-08days on market $367,000 Active 42 DOM
-
2026-06-07days on market $367,000 Active 41 DOM
-
2026-06-04pricedays on market $367,000 Active 38 DOM
-
2026-06-03days on market $378,000 Active 37 DOM
-
2026-06-02days on market $378,000 Active 36 DOM
-
2026-06-01days on market $378,000 Active 35 DOM
-
2026-05-31days on market $378,000 Active 34 DOM
-
2026-05-14price $378,000 519-char remark
-
2026-04-27$383,000 Active 519-char remark
-
2016-01-21soldstatus $164,000 Closed 432-char remark
Show marketing remark (432 chars)
Beautiful two story home in the Indigo Trails community in Queen Creek! This move in ready home offers an open floor plan design, 3 bedrooms, 2.5 bath, large and spacious master bedroom, and a private patio. The HUGE driveway adds plenty of parking space. Easy access to everywhere with nearby shopping and services. The trifecta of properties could be the perfect starter home, investment property, or lock and leave vacation home!
-
2016-01-21soldstatus $164,000
Show marketing remark (432 chars)
Beautiful two story home in the Indigo Trails community in Queen Creek! This move in ready home offers an open floor plan design, 3 bedrooms, 2.5 bath, large and spacious master bedroom, and a private patio. The HUGE driveway adds plenty of parking space. Easy access to everywhere with nearby shopping and services. The trifecta of properties could be the perfect starter home, investment property, or lock and leave vacation home!
-
2016-01-06status Pending 432-char remark
Show marketing remark (432 chars)
Beautiful two story home in the Indigo Trails community in Queen Creek! This move in ready home offers an open floor plan design, 3 bedrooms, 2.5 bath, large and spacious master bedroom, and a private patio. The HUGE driveway adds plenty of parking space. Easy access to everywhere with nearby shopping and services. The trifecta of properties could be the perfect starter home, investment property, or lock and leave vacation home!
-
2015-12-18$174,988 Active 432-char remark
Show marketing remark (432 chars)
Beautiful two story home in the Indigo Trails community in Queen Creek! This move in ready home offers an open floor plan design, 3 bedrooms, 2.5 bath, large and spacious master bedroom, and a private patio. The HUGE driveway adds plenty of parking space. Easy access to everywhere with nearby shopping and services. The trifecta of properties could be the perfect starter home, investment property, or lock and leave vacation home!
-
2014-12-26historical
-
2014-10-17price $170,000
-
2014-09-26price $173,500
-
2014-08-30price $179,798
-
2014-08-20price $179,898
-
2014-08-19price $179,899
-
2014-08-08price $179,900
-
2014-07-30price $183,999
-
2014-06-10price $184,000
-
2014-05-17$189,900 Active
ⓘ Source: listings_history table (triggers on properties + properties_extension) + one-shot
backfill from property_details.listing_events for pre-trigger history.
Tax reassessment forecast AZ · Resets to sale price
- Current annual tax
- $1,491 · $124/mo
- Projected year-2 tax
- $2,422 · $202/mo
- Expected delta
- +$931/yr (+$78/mo · 62.5%)
ⓘ Screening estimate from a state-policy table — verify with the county assessor before closing.
Nearby sold comps map
Loading sold comps map…
Walkable amenities ~0.75 mi
Loading nearby amenities…
Taxation est. · year 1
- Rental income
- $29,280
- − Mortgage interest
- −$20,558
- − Property taxes
- −$1,491
- − Insurance
- −$1,835
- − Repairs & maintenance
- −$2,342
- − Management
- −$2,342
- − HOA
- −$1,548
- − Depreciation
- −$10,676
- Taxable loss
- −$11,513
- Est. tax savings @ 24.0%
- +$2,763
- After-tax cash flow
- $-2,075/yr
For passive investors: Depreciation is non-cash, so a rental often shows a tax loss while cash-flowing — sheltering income. Rental losses are passive: they offset passive income freely, and up to $25,000/yr can offset ordinary (W-2) income if you actively participate and your MAGI is under $100k (phasing out to $0 by $150k); unused losses carry forward. On sale, claimed depreciation is recaptured at up to 25%, and gains may owe capital-gains tax (a 1031 exchange can defer both). Figures are a year-1 estimate at your 24.0% rate — not tax advice; consult a CPA.
Schools (NCES district)
- District
- Queen Creek Unified District (4245)
- NCES district ID
- 0406810
- Math proficiency
- 55% ▼ -8.00%
- Reading proficiency
- 53% ▼ -6.00%
- Median HH income
- $84,928
- Composite
- 49.46/100
- National rank
- #2003
- State rank
- #25 of 249 in AZ
Livability — Queen Creek
- Score
- 72/100
- State rank
- #27
- US rank
- #5874
Category grades
Schools grade is shown separately in the Schools card above.
Census & demographics
- Census place
- Queen Creek, AZ
- County
- Maricopa County · 4,537,380 people
- City population
- 93,700
- Metro
- Phoenix-Mesa-Chandler, AZ
- Population (ZIP)
- 93,700
- Household income
- $129,367
- Rent vs Own
- Severe rent burden
- 1106.0
Population outlook (Maricopa County) Hauer SSP2
- Today (2025)
- 4,979,203 people
- By 2030
- 5,378,229 · +8.0%
- By 2040
- 6,156,598 · +23.6%
- By 2050
- 6,872,376 · +38.0%
- By 2075
- 8,401,270 · +68.7%
- By 2100
- 9,247,439 · +85.7%
Race, ethnicity, and origin ACS 2023
- Neighborhood character
- Predominantly White (66%)
- Race & ethnicity
- White 66% Hispanic / Latino 22% Two or more races 14% Black 4% Asian 3%
- Hispanic origin (detail)
- Mexican 17%
- Common ancestry
- Italian 3% Romanian 3% Portuguese 2%
- Foreign-born
- 8% · Canada
- Languages at home
- 86% English-only · Spanish 11% Other Indo-European 1% Tagalog/Filipino 1%
Political lean MEDSL · Maricopa
- 2024 margin
- Toss-up / Even · D 47.7% · R 51.2% · Other 1.1%
- 2008→2024 swing
- +7.1pp toward D · 2008: -10.6pp · 2024: -3.5pp
- All cycles
- 2024: R+3.5 2020: D+2.2 2016: R+3.5 2012: R+12.0 2008: R+10.6
Not yet ingested
- Civics
- —
Market trends
- HPI YoY
- ▼ -145.50%
- Current HPI
- 329.9469
- Rent YoY
- ▲ 0.59%
- Metro
- Phoenix-Mesa-Chandler, AZ
- State GDP YoY
- ▲ 4.54%
- F500 in state
- 20
Industry mix (Fortune 500 HQ in AZ)
| Industry | F500 HQs | Revenue |
|---|---|---|
| Technology | 2 | $13B |
|
||
| Mining / Metals | 1 | $23B |
|
||
| Environmental Services | 1 | $16B |
|
||
| Metals / Steel | 1 | $14B |
|
||
| Technology Distribution | 1 | $9B |
|
||
| Homebuilding | 1 | $8B |
|
||
Price history
+93.3% since first listed17 events — show timeline
- 2026-06-04 Price Changed $367,000 ARMLS
- 2026-05-14 Price Changed $378,000 ARMLS
- 2026-04-27 Listed $383,000 ARMLS
- 2016-01-21 Sold (Public Records) $164,000 Public Records
- 2016-01-21 Sold (MLS) $164,000 ARMLS
- 2016-01-06 Pending — ARMLS
- 2015-12-18 Listed $174,988 ARMLS
- 2014-12-26 Listing Removed — ARMLS
- 2014-10-17 Price Changed $170,000 ARMLS
- 2014-09-26 Price Changed $173,500 ARMLS
- 2014-08-30 Price Changed $179,798 ARMLS
- 2014-08-20 Price Changed $179,898 ARMLS
- 2014-08-19 Price Changed $179,899 ARMLS
- 2014-08-08 Price Changed $179,900 ARMLS
- 2014-07-30 Price Changed $183,999 ARMLS
- 2014-06-10 Price Changed $184,000 ARMLS
- 2014-05-17 Listed $189,900 ARMLS
Property tax history
+2.8%/yrLatest (2025): $1,491 · -3.1% YoY. Source: county tax records.
Cash-flow waterfall
monthlySold comps — $/sqft
last 12 mo · ≤1 miLoading sold comps…