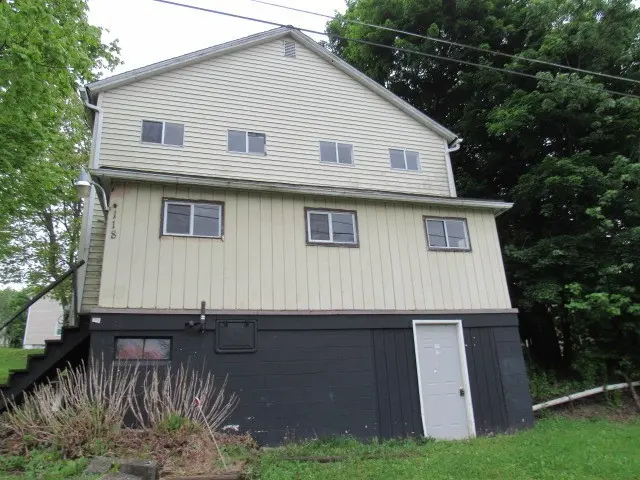
118 21st St · Derry, PA
Flood risk 1/10 · Minimal
- FEMA flood zone
- X (unshaded)
- Chance of flooding over 30 yrs
- 0.0%
- Est. flood insurance / yr
- $507 – $1,088
Fire risk 1/10 · Minimal
- Est. fire insurance / yr
- $511 – $949
Heat risk 3/10 · Minor
- Hot days now (above 94°F)
- 7 days/yr
- Hot days in 30 yrs
- 18 days/yr
Wind risk 2/10 · Minimal
- Chance of severe wind over 30 yrs
- 0.0%
Air-quality risk 2/10 · Minimal
- Unhealthy air days now
- 1 days/yr
- Unhealthy air days in 30 yrs
- 3 days/yr
Risk factors via First Street. Map © Google.
Why this score? — see what drove the B+ grade
The composite is a weighted blend of 9 inputs, each scored 0–100. Each bar is that input's sub-score; the figure is the points it added to the 100-point composite (weight × sub-score).
- Cash flow +29.9/30.0
- DSCR +10.0/10.0
- 1% rule +8.2/10.0
- Appreciation +7.6/10.0
- ARV discount +7.5/15.0
- Schools +4.3/10.0
- Livability +3.4/5.0
- Rent growth +2.5/5.0
- Condition / age +2.5/5.0
$80,000
🖨 Deal sheet 📄 Offer letter ✓ Due diligence
Listing remarks MLS
Great Family Home Over 1,600 Sq. Ft Living Area, Hard Cote Walls New Carpet & Paint Large Rooms , Enclosed Front Porch & Rear Patio
Key facts
- Off street parking
- Centrally located
- Colonial home
Tags
Property features AI
Exterior
- Parking: Off-street parking
- Utilities: Public water; Public sewer
- Home design: Two-story home; Resale property; Vinyl siding
- Construction: Vinyl siding exterior; Built with standard foundation
- Exterior features: Public transportation access
Interior
- Kitchen: Kitchen on main level
- Bedrooms: Three bedrooms (two upper-level bedrooms; third bedroom on upper level)
- Flooring: Carpet
- Bathrooms: One full bathroom
- Heating & cooling: Forced air heating; Oil heating
- Interior features: Carpet flooring; Full unfinished basement
Neighborhood map
What this means for you Summary
Snapshot
- This is a 3-bed/1.0-bath other listed at $80k.
Deal economics
- At list price, monthly cash flow is $296 ($4k/yr) — positive.
- The deal already cash-flows at list — no discount required.
- Meets the 1% rule at list price ($1k rent vs $80k).
- Recommended offer: $79k (1.5% below list) — sets the bar for market timing.
- Cap rate 10.7% vs local median 3.5% in Derry — top-decile yield for the area; either an underpriced asset or a hidden risk that comps aren't pricing in. Stress-test before assuming the spread holds.
Location & tenants
- Location reads 67/100 on livability (#952 in PA) — a middle-class / working-renter tenant base. Strengths: crime A+, cost of living A+, housing A+; Watch: employment D+, amenities F, commute F.
- Derry Area SD (rural): math 41% / reading 62% proficiency, ranked #169 of 539 in PA (top 31%) — acceptable for families but not a draw, mixed tenant base, ~2y average lease.
- Market conditions: 2 active listings in the ZIP; 1 comparable units currently listed for rent nearby; 415 units permitted in Westmoreland County in 2024 (10 in 5+ unit buildings).
Forward outlook
- In year one you build about $5k of equity ($553 loan paydown + $4k appreciation (5.2% local appreciation)).
- Westmoreland County population projected at -19% by 2050 — secular population decline; favor cash flow + early exit over multi-decade hold.
- At projected returns (5.2% appreciation + 3.0% rent growth), your $22k cash investment doubles in ~3 years — after that, you're playing with house money.
- By year 7, paydown + projected appreciation supports a ~$30k cash-out refi (75% LTV) — recoverable capital for the next deal without selling this one.
Negotiation context
- It's been on market 16 days — a 2% lower offer ($79k) is reasonable based on typical stale-listing flexibility.
- 2 sale attempts since 22y ago with the ask held roughly flat each time — persistent listings suggest the price (not the market) is what's stuck; bring a comps-based counter.
Risks & watch-outs
- Watch-outs: built in 1910 — expect roof / HVAC / electrical / plumbing capex.
Questions for the listing agent
- Built in 1910 — when were the roof, HVAC, electrical panel, plumbing, and water heater last replaced?
- Is there a deadline driving the sale (1031 exchange, divorce, estate, relocation)? That informs how much negotiation room exists.
- Schools are B-rated — typically a magnet for longer-tenancy family renters. What's the average tenant stay here, and is there a school-zone premium baked into asking?
- What's the average days-on-market for RENTAL listings here right now (not sales)? A rising rental-DOM trend means longer vacancies and softer asking-rent achievability than the comps imply.
- What's the recent tenant-quality profile in this submarket — average credit score on applications, eviction rate, late-payment / NSF rate, and stable-employment percentage? A property-management company in the area should have these aggregated.
- How much new for-sale + rental construction is in the pipeline within 1–3 miles? Heavy new supply typically softens prices + rents 12–24 months out; constrained supply supports both.
Investment metrics
- 1% rule
- 1.32% ✓
- Cap rate
- 10.73%
- Cash-on-cash
- 15.85%
- DSCR
- 1.71
- GRM
- 6.3
CMA / ARV
No comps found within radius.
Projected returns pro-forma
5.2% appreciation · 3.0% rent growth · sell at horizon
- IRR
- 27.0%
- Equity multiple
- 2.71×
- Total profit
- $38,209
- Equity at exit
- $46,311
- IRR
- 25.8%
- Equity multiple
- 5.41×
- Total profit
- $98,825
- Equity at exit
- $80,746
Cash invested: $22,400 (down + closing). Projections, not guarantees.
Landlord ↔ Tenant lean methodology
- Overall (STATE)
- 62 Landlord-Friendly
- State Pennsylvania
- 62 Landlord-Friendly · EVEN
- County
- — inherits STATE
- City
- — inherits STATE
ZIP-level market 15671
- Home prices YoY
- 4.9%
- Active inventory
- 2
- Price-to-rent
- 6.3×
Monthly cashflow live
- Estimated rent
- $1,058 medium interval (Pro) →
- Mortgage (P&I)
- −$420
- Tax from tax record
- −$87 /mo · $1,050/yr
- Insurance
- −$33
- HOA
- −$0
- Vacancy / Maint / Mgmt
- −$222
- Net cashflow
- $296
Break-even live
UW: 25.0% down · 7.5% · 30yr · 1.5% tax · 5.0% vac · 8.0% maint · 8.0% mgmt
Financing live
Cash to close
- Down payment
- $20,000
- Closing costs
- $2,400
- Reserves months
- —
- Total cash needed
- —
Loan-product check · same deal, 3 products live
Conventional
25% down · 7.5% · 30yr
- Down + closing
- —
- Monthly P&I
- —
- Monthly cashflow
- —
- DSCR
- —
- Eligible?
- —
Personal DTI + credit; lowest rate.
DSCR
20% down · 8.5% · 30yr
- Down + closing
- —
- Monthly P&I
- —
- Monthly cashflow
- —
- DSCR
- —
- Eligible?
- —
No personal income docs; deal must DSCR.
Hard money
10% down · 12.0% · 12mo
- Down + closing
- —
- Monthly P&I
- —
- Monthly cashflow
- —
- DSCR
- —
- Eligible?
- —
Short-term bridge; refi at stabilization.
Rent comps 1 comps
| Address | Beds | Baths | Sqft | Rent | $/sqft | DOM | Units | Dist |
|---|---|---|---|---|---|---|---|---|
| 1253 Saint RTE Derry, PA | 3.0 | 2.0 | 1204 | $1,058 | $0.88 | 1d | 1 | 1.35mi |
Listing history 10 events
-
2026-06-18days on market $80,000 Active 16 DOM
-
2026-06-17days on market $80,000 Active 15 DOM
-
2026-06-16days on market $80,000 Active 14 DOM
-
2026-06-15days on market $80,000 Active 13 DOM
-
2026-06-13days on market $80,000 Active 11 DOM
-
2026-06-09days on market $80,000 Active 7 DOM
-
2026-06-08days on market $80,000 Active 6 DOM
-
2026-06-07days on market $80,000 Active 5 DOM
-
2026-06-02remarks 251-char remark
-
2026-06-02$80,000 Active 1 DOM
ⓘ Source: listings_history table (triggers on properties + properties_extension) + one-shot
backfill from property_details.listing_events for pre-trigger history.
Tax reassessment forecast PA · Partial reset (capped growth)
- Current annual tax
- $1,050 · $87/mo
- Projected year-2 tax
- $1,157 · $96/mo
- Expected delta
- +$107/yr (+$9/mo · 10.2%)
ⓘ Screening estimate from a state-policy table — verify with the county assessor before closing.
Climate risk First Street
- Flood 1/10 Low FEMA zone X (unshaded) · 0% chance over 30 yrs
- Wildfire 1/10 Low
- Heat 3/10 Moderate 7 d/yr ≥94°F today · 18 d/yr by 30 yrs out
- Wind 2/10 Low 0% chance of damaging wind over 30 yrs
- Air quality 2/10 Low 1 unhealthy d/yr today · 3 by 30 yrs out
Nearby sold comps map
Loading sold comps map…
Walkable amenities ~0.75 mi
Loading nearby amenities…
Taxation est. · year 1
- Rental income
- $12,702
- − Mortgage interest
- −$4,481
- − Property taxes
- −$1,050
- − Insurance
- −$400
- − Repairs & maintenance
- −$1,016
- − Management
- −$1,016
- − Depreciation
- −$2,327
- Taxable income
- $2,411
- Est. tax owed @ 24.0%
- −$579
- After-tax cash flow
- $2,972/yr
For passive investors: Depreciation is non-cash, so a rental often shows a tax loss while cash-flowing — sheltering income. Rental losses are passive: they offset passive income freely, and up to $25,000/yr can offset ordinary (W-2) income if you actively participate and your MAGI is under $100k (phasing out to $0 by $150k); unused losses carry forward. On sale, claimed depreciation is recaptured at up to 25%, and gains may owe capital-gains tax (a 1031 exchange can defer both). Figures are a year-1 estimate at your 24.0% rate — not tax advice; consult a CPA.
Schools (NCES district)
- District
- Derry Area SD
- NCES district ID
- 4207560
- Math proficiency
- 41% ▼ -13.00%
- Reading proficiency
- 62% ▼ -7.00%
- Median HH income
- $44,439
- Composite
- 43.42/100
- National rank
- #3012
- State rank
- #169 of 539 in PA
Livability — Derry
- Score
- 67/100
- State rank
- #952
- US rank
- #10435
Category grades
Schools grade is shown separately in the Schools card above.
Census & demographics
- Population (ZIP)
- 607
Population outlook (Westmoreland County) Hauer SSP2
- Today (2025)
- 342,555 people
- By 2030
- 331,717 · -3.2%
- By 2040
- 304,976 · -11.0%
- By 2050
- 277,444 · -19.0%
- By 2075
- 224,607 · -34.4%
- By 2100
- 171,084 · -50.1%
Race, ethnicity, and origin ACS 2023
- Neighborhood character
- Predominantly White (95%)
- Race & ethnicity
- White 95% Two or more races 5%
- Common ancestry
- Romanian 21% Subsaharan African 2% Lithuanian 1%
Political lean MEDSL · Westmoreland
- 2024 margin
- Strong R (+28.4) · D 35.4% · R 63.9%
- 2008→2024 swing
- -11.7pp toward R · 2008: -16.7pp · 2024: -28.4pp
- All cycles
- 2024: R+28.4 2020: R+28.3 2016: R+31.3 2012: R+23.7 2008: R+16.7
Not yet ingested
- Civics
- —
Market trends
- HPI YoY
- ▲ 5.20%
- Current HPI
- 111.5271
- Rent YoY
- —
- Metro
- —
- State GDP YoY
- ▲ 1.68%
- F500 in state
- 34
Industry mix (Fortune 500 HQ in PA)
| Industry | F500 HQs | Revenue |
|---|---|---|
| Healthcare | 2 | $309B |
|
||
| Insurance | 2 | $27B |
|
||
| Telecommunications / Media | 1 | $124B |
|
||
| Industrial Distribution | 1 | $22B |
|
||
| Financial Services | 1 | $20B |
|
||
| Chemicals / Materials | 1 | $18B |
|
||
Price history
+60.0% since first listed6 events — show timeline
- 2026-06-02 Listed $80,000 West Penn MLS
- 2015-03-03 Sold (Public Records) $76,900 Public Records
- 2004-10-22 Sold (Public Records) $70,000 Public Records
- 2004-09-30 Sold (MLS) $70,000 West Penn MLS
- 2004-07-02 Listed $67,900 West Penn MLS
- 2002-08-01 Sold (Public Records) $50,000 Public Records
Property tax history
+2.1%/yrLatest (2026): $1,050 · +0.8% YoY. Source: county tax records.
Cash-flow waterfall
monthlySold comps — $/sqft
last 12 mo · ≤1 miLoading sold comps…