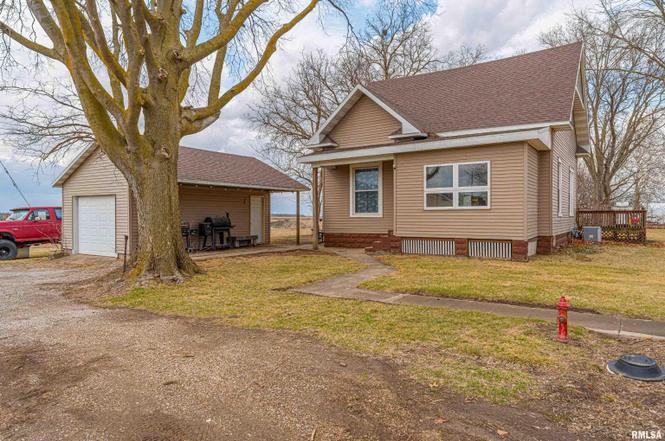
403 W Delavan St · New Holland, IL
Flood risk 1/10 · Minimal
- FEMA flood zone
- X (unshaded)
- Chance of flooding over 30 yrs
- 0.0%
- Est. flood insurance / yr
- $473 – $860
Fire risk 1/10 · Minimal
- Est. fire insurance / yr
- $804 – $1,492
Heat risk 3/10 · Minor
- Hot days now (above 106°F)
- 7 days/yr
- Hot days in 30 yrs
- 19 days/yr
Wind risk 2/10 · Minimal
- Chance of severe wind over 30 yrs
- 2.0%
Air-quality risk 2/10 · Minimal
- Unhealthy air days now
- 1 days/yr
- Unhealthy air days in 30 yrs
- 2 days/yr
Risk factors via First Street. Map © Google.
Why this score? — see what drove the C+ grade
The composite is a weighted blend of 9 inputs, each scored 0–100. Each bar is that input's sub-score; the figure is the points it added to the 100-point composite (weight × sub-score).
- Cash flow +24.8/30.0
- DSCR +8.0/10.0
- ARV discount +7.5/15.0
- 1% rule +6.6/10.0
- Appreciation +5.0/10.0
- Livability +3.2/5.0
- Rent growth +2.5/5.0
- Condition / age +2.5/5.0
- Schools +2.2/10.0
$89,000
🖨 Deal sheet 📄 Offer letter ✓ Due diligence
Listing remarks MLS
This is a spacious 2 bedroom home. Family room could be easily converted to 3rd bedroom. This one needs some TLC but has lots of potential. Very large lot - nice street appeal. Property is sold "as-is" and "where-is" with no warranties expressed or implied.
Key facts
- Covered porch area
- Tiled eat-in kitchen
- Enclosed front porch
Tags
Property features AI
Exterior
- Parking: Detached 1-car garage
- Utilities: Public water; Septic system
- Home design: Single-family residence; Built in 1910; Total living area approx. 1237
- Construction: Shingle roof; Crawl space and partial, unfinished basement
- Exterior features: Replacement windows; Level lot
Interior
- Kitchen: No appliances included
- Bedrooms: 2 bedrooms (both on the main level) — Bedroom 1 approx. 14 x 10, Bedroom 2 approx. 12 x 12
- Flooring: Carpet in bedrooms, living areas and laundry; Tile in kitchen and dining room
- Bathrooms: 1 full bathroom
- Heating & cooling: Forced air heating; Central air conditioning
- Interior features: Ceiling fan(s); Electric fireplace in the living room
- Laundry & utility: Dedicated laundry room (main level)
Neighborhood map
What this means for you Summary
Snapshot
- This is a 2-bed/1.0-bath other listed at $89k.
Deal economics
- At list price, monthly cash flow is $188 ($2k/yr) — positive.
- The deal already cash-flows at list — no discount required.
- Meets the 1% rule at list price ($1k rent vs $89k).
- Recommended offer: $81k (9.0% below list) — sets the bar for market timing.
Location & tenants
- Location reads 63/100 on livability (#767 in IL) — a middle-class / working-renter tenant base. Strengths: cost of living A+, housing A+, employment B+; Watch: crime D, amenities F, commute F.
- New Holland-Middletown Ed 88 (rural): math 15% / reading 25% proficiency, ranked #684 of 919 in IL (top 74%) — low school quality limits family demand, transient renter base, plan for 1-2y turnover.
- Zoned schools: New Holland-Middletown Elem Sch (math 5% / reading 24%, grade F, #1,259 of 2,056 statewide, top 62%, 75 students, 0% FRL) — zoned schools average 0% FRL vs 44% district-wide (44 pts lower); this property's tenant base skews higher-income than the district average.
- Market conditions: 2 active listings in the ZIP; 10 units permitted in Logan County in 2024 (0 in 5+ unit buildings).
Forward outlook
- In year one you build about $3k of equity ($615 loan paydown + $3k appreciation (3.0% local appreciation)).
- Logan County population projected at -11% by 2050 — secular population decline; favor cash flow + early exit over multi-decade hold.
- At projected returns (3.0% appreciation + 3.0% rent growth), your $25k cash investment doubles in ~5 years — after that, you're playing with house money.
- By year 10, paydown + projected appreciation supports a ~$32k cash-out refi (75% LTV) — recoverable capital for the next deal without selling this one.
Negotiation context
- It's been on market 104 days — a 9% lower offer ($81k) is reasonable based on typical stale-listing flexibility.
- 3 sale attempts since 17y ago; this cycle's ask has dropped $10k (10%) from the opening price — seller is motivated, your offer sets the floor, not the list.
- Current owner paid $17k; list at $89k implies a 424% gain — meaningful room to come down on a strong offer.
Risks & watch-outs
- Watch-outs: built in 1910 — expect roof / HVAC / electrical / plumbing capex.
Questions for the listing agent
- It's been on market 104 days. Have you received any prior offers? Is the seller open to a 9% concession, seller financing, or rate buy-down credit?
- Built in 1910 — when were the roof, HVAC, electrical panel, plumbing, and water heater last replaced?
- Why hasn't it sold? Are there any deal-killer items the seller is aware of (foundation, flood, title, zoning, code violations)?
- Is there a deadline driving the sale (1031 exchange, divorce, estate, relocation)? That informs how much negotiation room exists.
- Schools are D-rated, which usually means shorter tenancies and higher turnover. Who's the typical renter profile here, and what's been the actual vacancy rate?
- Crime grade is D in this area — have there been break-ins, vandalism, or insurance claims at this property in the last 3 years? What carrier currently insures it and at what premium?
- What's the average days-on-market for RENTAL listings here right now (not sales)? A rising rental-DOM trend means longer vacancies and softer asking-rent achievability than the comps imply.
- What's the recent tenant-quality profile in this submarket — average credit score on applications, eviction rate, late-payment / NSF rate, and stable-employment percentage? A property-management company in the area should have these aggregated.
- How much new for-sale + rental construction is in the pipeline within 1–3 miles? Heavy new supply typically softens prices + rents 12–24 months out; constrained supply supports both.
Investment metrics
- 1% rule
- 1.16% ✓
- Cap rate
- 8.83%
- Cash-on-cash
- 9.05%
- DSCR
- 1.40
- GRM
- 7.2
CMA / ARV
No comps found within radius.
Projected returns pro-forma
3.0% appreciation · 3.0% rent growth · sell at horizon
- IRR
- 16.0%
- Equity multiple
- 1.91×
- Total profit
- $22,710
- Equity at exit
- $40,018
- IRR
- 17.6%
- Equity multiple
- 3.57×
- Total profit
- $64,122
- Equity at exit
- $61,673
Cash invested: $24,920 (down + closing). Projections, not guarantees.
Landlord ↔ Tenant lean methodology
- Overall (STATE)
- 43 Moderately Tenant-Leaning
- State Illinois
- 43 Moderately Tenant-Leaning · D+7
- County
- — inherits STATE
- City
- — inherits STATE
ZIP-level market 62671
- Active inventory
- 2
- Price-to-rent
- 7.2×
Monthly cashflow live
- Estimated rent
- $1,032 medium interval (Pro) →
- Mortgage (P&I)
- −$467
- Tax from tax record
- −$124 /mo · $1,486/yr
- Insurance
- −$37
- HOA
- −$0
- Vacancy / Maint / Mgmt
- −$217
- Net cashflow
- $188
Break-even live
UW: 25.0% down · 7.5% · 30yr · 1.5% tax · 5.0% vac · 8.0% maint · 8.0% mgmt
Financing live
Cash to close
- Down payment
- $22,250
- Closing costs
- $2,670
- Reserves months
- —
- Total cash needed
- —
Loan-product check · same deal, 3 products live
Conventional
25% down · 7.5% · 30yr
- Down + closing
- —
- Monthly P&I
- —
- Monthly cashflow
- —
- DSCR
- —
- Eligible?
- —
Personal DTI + credit; lowest rate.
DSCR
20% down · 8.5% · 30yr
- Down + closing
- —
- Monthly P&I
- —
- Monthly cashflow
- —
- DSCR
- —
- Eligible?
- —
No personal income docs; deal must DSCR.
Hard money
10% down · 12.0% · 12mo
- Down + closing
- —
- Monthly P&I
- —
- Monthly cashflow
- —
- DSCR
- —
- Eligible?
- —
Short-term bridge; refi at stabilization.
Listing history 22 events
-
2026-06-18days on market $89,000 Active 104 DOM
-
2026-06-17days on market $89,000 Active 103 DOM
-
2026-06-16days on market $89,000 Active 102 DOM
-
2026-06-15days on market $89,000 Active 101 DOM
-
2026-06-13days on market $89,000 Active 99 DOM
-
2026-06-12pricedays on market $89,000 Active 98 DOM
-
2026-06-09days on market $99,000 Active 95 DOM
-
2026-06-08days on market $99,000 Active 94 DOM
-
2026-06-07days on market $99,000 Active 93 DOM
-
2026-06-05days on market $99,000 Active 91 DOM
-
2026-06-04days on market $99,000 Active 89 DOM
-
2026-06-02days on market $99,000 Active 88 DOM
-
2026-06-01days on market $99,000 Active 87 DOM
-
2026-05-31days on market $99,000 Active 86 DOM
-
2026-05-31days on market $99,000 Active 85 DOM
-
2026-03-06$99,000 Active
-
2012-06-28soldstatus $17,000
-
2012-06-27soldstatus $17,000 277-char remark
Show marketing remark (277 chars)
This is a spacious 2 bedroom home. Family room could be easily converted to 3rd bedroom. This one needs some TLC but has lots of potential. Very large lot - nice street appeal. Property is sold "as-is" and "where-is" with no warranties expressed or implied.
-
2012-05-03$18,900 277-char remark
Show marketing remark (277 chars)
This is a spacious 2 bedroom home. Family room could be easily converted to 3rd bedroom. This one needs some TLC but has lots of potential. Very large lot - nice street appeal. Property is sold "as-is" and "where-is" with no warranties expressed or implied.
-
2009-03-23soldstatus $40,000
-
2009-03-20soldstatus $44,800 194-char remark
Show marketing remark (194 chars)
OLDER HOME ON CORNER LOT. EDGE OF TOWN. HOT WATER HEAT, FIREPLACE, BUILT-INS, & FLOORED ATTIC THAT COULD BECOME A LOFT. PROPERTY HAS EXTRA 2 LOTS THAT RUN BEHIND THIS HOME-taxes on lots-$220
-
2009-01-24$51,900 194-char remark
Show marketing remark (194 chars)
OLDER HOME ON CORNER LOT. EDGE OF TOWN. HOT WATER HEAT, FIREPLACE, BUILT-INS, & FLOORED ATTIC THAT COULD BECOME A LOFT. PROPERTY HAS EXTRA 2 LOTS THAT RUN BEHIND THIS HOME-taxes on lots-$220
ⓘ Source: listings_history table (triggers on properties + properties_extension) + one-shot
backfill from property_details.listing_events for pre-trigger history.
Tax reassessment forecast IL · Partial reset (capped growth)
- Current annual tax
- $1,486 · $124/mo
- Projected year-2 tax
- $1,753 · $146/mo
- Expected delta
- +$267/yr (+$22/mo · 18.0%)
ⓘ Screening estimate from a state-policy table — verify with the county assessor before closing.
Climate risk First Street
- Flood 1/10 Low FEMA zone X (unshaded) · 0% chance over 30 yrs
- Wildfire 1/10 Low
- Heat 3/10 Moderate 7 d/yr ≥106°F today · 19 d/yr by 30 yrs out
- Wind 2/10 Low 2% chance of damaging wind over 30 yrs
- Air quality 2/10 Low 1 unhealthy d/yr today · 2 by 30 yrs out
Nearby sold comps map
Loading sold comps map…
Walkable amenities ~0.75 mi
Loading nearby amenities…
Taxation est. · year 1
- Rental income
- $12,387
- − Mortgage interest
- −$4,985
- − Property taxes
- −$1,486
- − Insurance
- −$445
- − Repairs & maintenance
- −$991
- − Management
- −$991
- − Depreciation
- −$2,589
- Taxable income
- $900
- Est. tax owed @ 24.0%
- −$216
- After-tax cash flow
- $2,038/yr
For passive investors: Depreciation is non-cash, so a rental often shows a tax loss while cash-flowing — sheltering income. Rental losses are passive: they offset passive income freely, and up to $25,000/yr can offset ordinary (W-2) income if you actively participate and your MAGI is under $100k (phasing out to $0 by $150k); unused losses carry forward. On sale, claimed depreciation is recaptured at up to 25%, and gains may owe capital-gains tax (a 1031 exchange can defer both). Figures are a year-1 estimate at your 24.0% rate — not tax advice; consult a CPA.
Schools (NCES district)
- District
- New Holland-Middletown Ed 88
- NCES district ID
- 1700103
- Math proficiency
- 15% ▲ 5.00%
- Reading proficiency
- 25% ▲ 5.00%
- Median HH income
- $55,706
- Composite
- 21.68/100
- National rank
- #13592
- State rank
- #684 of 919 in IL
Livability — New Holland
- Score
- 63/100
- State rank
- #767
- US rank
- #15390
Category grades
Schools grade is shown separately in the Schools card above.
Census & demographics
- Census place
- New Holland, IL
- Population (ZIP)
- 472
Population outlook (Logan County) Hauer SSP2
- Today (2025)
- 28,066 people
- By 2030
- 27,370 · -2.5%
- By 2040
- 26,078 · -7.1%
- By 2050
- 24,908 · -11.3%
- By 2075
- 22,504 · -19.8%
- By 2100
- 19,226 · -31.5%
Race, ethnicity, and origin ACS 2023
- Neighborhood character
- Predominantly White (91%)
- Race & ethnicity
- White 91% Hispanic / Latino 5% Native American 5% Two or more races 4%
- Common ancestry
- Slovak 3% Romanian 2% Lithuanian 1%
- Foreign-born
- 5% · Canada
- Languages at home
- 98% English-only · Spanish 2%
Political lean MEDSL · Logan
- 2024 margin
- Solid R (+41.5) · D 28.2% · R 69.8% · Other 2.0%
- 2008→2024 swing
- -24.6pp toward R · 2008: -16.9pp · 2024: -41.5pp
- All cycles
- 2024: R+41.5 2020: R+39.8 2016: R+40.1 2012: R+32.1 2008: R+16.9
Not yet ingested
- Civics
- —
Market trends
- HPI YoY
- —
- Current HPI
- —
- Rent YoY
- —
- Metro
- —
- State GDP YoY
- ▲ 1.59%
- F500 in state
- 60
Industry mix (Fortune 500 HQ in IL)
| Industry | F500 HQs | Revenue |
|---|---|---|
| Insurance | 4 | $201B |
|
||
| Consumer Goods | 4 | $87B |
|
||
| Industrial Machinery | 3 | $64B |
|
||
| Healthcare | 2 | $55B |
|
||
| Retail / Pharmacy | 1 | $148B |
|
||
| Agriculture / Food | 1 | $86B |
|
||
Price history
+90.8% since first listed7 events — show timeline
- 2026-03-06 Listed $99,000 RMLSA as Distributed by MLS Grid
- 2012-06-28 Sold (Public Records) $17,000 Public Records
- 2012-06-27 Sold (MLS) $17,000 RMLSA as Distributed by MLS Grid
- 2012-05-03 Listed $18,900 RMLSA as Distributed by MLS Grid
- 2009-03-23 Sold (Public Records) $40,000 Public Records
- 2009-03-20 Sold (MLS) $44,800 RMLSA as Distributed by MLS Grid
- 2009-01-24 Listed $51,900 RMLSA as Distributed by MLS Grid
Property tax history
-1.6%/yrLatest (2024): $1,486 · +7.4% YoY. Source: county tax records.
Cash-flow waterfall
monthlySold comps — $/sqft
last 12 mo · ≤1 miLoading sold comps…