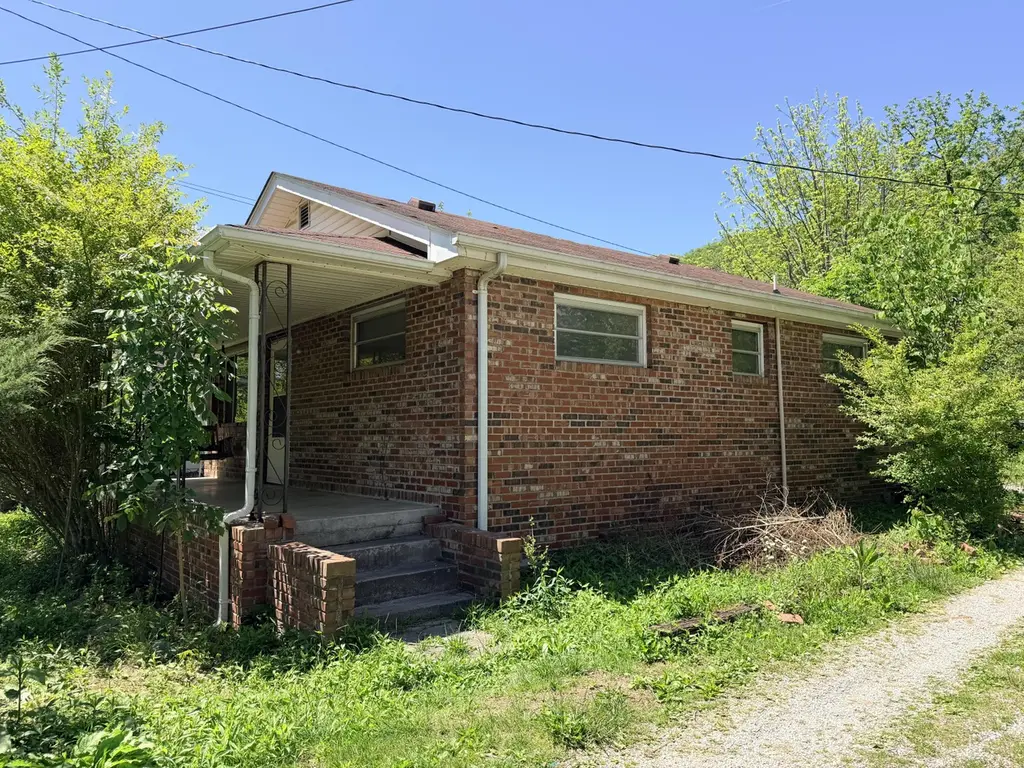
329 State Highway 522 · Coxton, KY
Flood risk 8/10 · Major
- FEMA flood zone
- X (shaded)
- Chance of flooding over 30 yrs
- 0.99%
- Est. flood insurance / yr
- $507 – $1,088
Fire risk 3/10 · Minor
- Est. fire insurance / yr
- $839 – $1,559
Heat risk 5/10 · Moderate
- Hot days now (above 96°F)
- 9 days/yr
- Hot days in 30 yrs
- 26 days/yr
Wind risk 2/10 · Minimal
- Chance of severe wind over 30 yrs
- 1.0%
Air-quality risk 1/10 · Minimal
- Unhealthy air days now
- 0 days/yr
- Unhealthy air days in 30 yrs
- 0 days/yr
Risk factors via First Street. Map © Google.
Why this score? — see what drove the B grade
The composite is a weighted blend of 9 inputs, each scored 0–100. Each bar is that input's sub-score; the figure is the points it added to the 100-point composite (weight × sub-score).
- Cash flow +30.0/30.0
- 1% rule +10.0/10.0
- DSCR +10.0/10.0
- ARV discount +7.5/15.0
- Appreciation +4.6/10.0
- Livability +2.7/5.0
- Rent growth +2.5/5.0
- Condition / age +2.5/5.0
- Schools +2.0/10.0
$27,500
🖨 Deal sheet 📄 Offer letter ✓ Due diligence
Listing remarks
Looking for a home to make your own? Then this home is call your name! In need of some TLC, this home gives you the perfect opportunity to make it your own. Located ideally in the Rosspoint community, you're only minutes away from downtown Harlan. Buyer to verify water and septic.
Key facts
- 4,791 sq ft lot
- Built 1930
- Listed 9 days
Property features AI
Exterior
- Utilities: Public water; Septic tank sewer
- Home design: Single-story house
- Construction: Brick veneer exterior; Block foundation; Shingle roof; Built area approximately 873
- Exterior features: Shed(s)
Interior
- Bedrooms: 5 total rooms (includes bedrooms and living areas)
- Flooring: Carpet; Hardwood
- Bathrooms: 1 full bathroom
- Interior features: Crawl space basement; No fireplace
Neighborhood map
What this means for you Summary
Snapshot
- This is a 2-bed/1.0-bath other listed at $28k.
Deal economics
- At list price, monthly cash flow is $416 ($5k/yr) — positive.
- The deal already cash-flows at list — no discount required.
- Meets the 1% rule at list price ($847 rent vs $28k).
Location & tenants
- Location reads 54/100 on livability (#478 in KY) — a working-class tenant base; expect higher turnover. Strengths: cost of living A+, housing A+, crime A; Watch: amenities F, commute F, employment F.
- Harlan County (rural): math 16% / reading 35% proficiency, ranked #149 of 165 in KY (top 90%) — low school quality limits family demand, transient renter base, plan for 1-2y turnover; 65% free/reduced lunch — lower-income household profile, screen leases tightly.
- Zoned schools: Harlan County High School (math 17% / reading 27%, grade F, #202 of 254 statewide, top 82%, 997 students, 80% FRL) — zoned schools average 80% FRL vs 65% district-wide (16 pts higher); higher-poverty schools than district average — tighter screening recommended.
- Market conditions: 8 active listings in the ZIP.
Forward outlook
- Local home prices are declining (-0.8%/yr); year-one equity from $190 of loan paydown is wiped out by about $219 of value loss. Plan a longer hold.
- Harlan County population projected at -34% by 2050 — secular population decline; favor cash flow + early exit over multi-decade hold.
- At projected returns (-0.8% appreciation + 3.0% rent growth), your $8k cash investment doubles in ~2 years — after that, you're playing with house money.
Negotiation context
- Only 9 days on market — expect competitive offers; lowballing is unlikely to land.
Risks & watch-outs
- Watch-outs: flood insurance adds $66/mo; built in 1930 — expect roof / HVAC / electrical / plumbing capex.
- Climate carrying-cost: severe flood risk; extreme-heat days projected 9→26/yr by 2055 (HVAC capex compounding) — expect insurance premiums to compound above CPI over the hold.
Questions for the listing agent
- Built in 1930 — when were the roof, HVAC, electrical panel, plumbing, and water heater last replaced?
- What's the actual annual flood-insurance premium (NFIP or private), and is the property in a SFHA with mandatory coverage?
- Is there a deadline driving the sale (1031 exchange, divorce, estate, relocation)? That informs how much negotiation room exists.
- Schools are F-rated, which usually means shorter tenancies and higher turnover. Who's the typical renter profile here, and what's been the actual vacancy rate?
- What's the average days-on-market for RENTAL listings here right now (not sales)? A rising rental-DOM trend means longer vacancies and softer asking-rent achievability than the comps imply.
- What's the recent tenant-quality profile in this submarket — average credit score on applications, eviction rate, late-payment / NSF rate, and stable-employment percentage? A property-management company in the area should have these aggregated.
- How much new for-sale + rental construction is in the pipeline within 1–3 miles? Heavy new supply typically softens prices + rents 12–24 months out; constrained supply supports both.
Investment metrics
- 1% rule
- 3.08% ✓
- Cap rate
- 27.34%
- Cash-on-cash
- 75.15%
- DSCR
- 4.34
- GRM
- 2.7
CMA / ARV
No comps found within radius.
Projected returns pro-forma
-0.8% appreciation · 3.0% rent growth · sell at horizon
- IRR
- 66.0%
- Equity multiple
- 4.21×
- Total profit
- $24,716
- Equity at exit
- $6,908
- IRR
- 68.7%
- Equity multiple
- 8.58×
- Total profit
- $58,335
- Equity at exit
- $7,486
Cash invested: $7,700 (down + closing). Projections, not guarantees.
Landlord ↔ Tenant lean methodology
- Overall (STATE)
- 83 Strongly Landlord-Friendly
- State Kentucky
- 83 Strongly Landlord-Friendly · R+16
- County
- — inherits STATE
- City
- — inherits STATE
ZIP-level market 40806
- Home prices YoY
- -0.5%
- Active inventory
- 8
- Price-to-rent
- 2.7×
Monthly cashflow live
- Estimated rent
- $847 medium interval (Pro) →
- Mortgage (P&I)
- −$144
- Tax from tax record
- −$31 /mo · $375/yr
- Insurance
- −$11
- Flood insurance flood zone
- −$66 /mo · $798/yr
- HOA
- −$0
- Vacancy / Maint / Mgmt
- −$178
- Net cashflow
- $416
Break-even live
UW: 25.0% down · 7.5% · 30yr · 1.5% tax · 5.0% vac · 8.0% maint · 8.0% mgmt
Financing live
Cash to close
- Down payment
- $6,875
- Closing costs
- $825
- Reserves months
- —
- Total cash needed
- —
Loan-product check · same deal, 3 products live
Conventional
25% down · 7.5% · 30yr
- Down + closing
- —
- Monthly P&I
- —
- Monthly cashflow
- —
- DSCR
- —
- Eligible?
- —
Personal DTI + credit; lowest rate.
DSCR
20% down · 8.5% · 30yr
- Down + closing
- —
- Monthly P&I
- —
- Monthly cashflow
- —
- DSCR
- —
- Eligible?
- —
No personal income docs; deal must DSCR.
Hard money
10% down · 12.0% · 12mo
- Down + closing
- —
- Monthly P&I
- —
- Monthly cashflow
- —
- DSCR
- —
- Eligible?
- —
Short-term bridge; refi at stabilization.
Listing history 6 events
-
2026-06-07statusdays on market $27,500 Pending 9 DOM
-
2026-06-03days on market $27,500 Active 8 DOM
-
2026-06-02days on market $27,500 Active 7 DOM
-
2026-06-01days on market $27,500 Active 6 DOM
-
2026-05-31days on market $27,500 Active 5 DOM
-
2026-05-26$27,500 Active
ⓘ Source: listings_history table (triggers on properties + properties_extension) + one-shot
backfill from property_details.listing_events for pre-trigger history.
Tax reassessment forecast KY · Resets to sale price
- Current annual tax
- $375 · $31/mo
- Projected year-2 tax
- $375 · $31/mo
- Expected delta
- $0/yr ($0/mo · 0.0%)
ⓘ Screening estimate from a state-policy table — verify with the county assessor before closing.
Climate risk First Street
- Flood 8/10 Severe FEMA zone X (shaded) · 99% chance over 30 yrs
- Wildfire 3/10 Moderate
- Heat 5/10 Major 9 d/yr ≥96°F today · 26 d/yr by 30 yrs out
- Wind 2/10 Low 100% chance of damaging wind over 30 yrs
- Air quality 1/10 Low 0 unhealthy d/yr today · 0 by 30 yrs out
Nearby sold comps map
Loading sold comps map…
Walkable amenities ~0.75 mi
Loading nearby amenities…
Taxation est. · year 1
- Rental income
- $10,165
- − Mortgage interest
- −$1,540
- − Property taxes
- −$375
- − Insurance
- −$935
- − Repairs & maintenance
- −$813
- − Management
- −$813
- − Depreciation
- −$800
- Taxable income
- $4,888
- Est. tax owed @ 24.0%
- −$1,173
- After-tax cash flow
- $3,816/yr
For passive investors: Depreciation is non-cash, so a rental often shows a tax loss while cash-flowing — sheltering income. Rental losses are passive: they offset passive income freely, and up to $25,000/yr can offset ordinary (W-2) income if you actively participate and your MAGI is under $100k (phasing out to $0 by $150k); unused losses carry forward. On sale, claimed depreciation is recaptured at up to 25%, and gains may owe capital-gains tax (a 1031 exchange can defer both). Figures are a year-1 estimate at your 24.0% rate — not tax advice; consult a CPA.
Schools (NCES district)
- District
- Harlan County
- NCES district ID
- 2102540
- Math proficiency
- 16% ▼ -26.00%
- Reading proficiency
- 35% ▼ -24.00%
- Median HH income
- $26,283
- Composite
- 20.13/100
- National rank
- #8642
- State rank
- #149 of 165 in KY
Livability — Coxton
- Score
- 54/100
- State rank
- #478
- US rank
- #23957
Category grades
Schools grade is shown separately in the Schools card above.
Census & demographics
- Population (ZIP)
- 1,827
Population outlook (Harlan County) Hauer SSP2
- Today (2025)
- 24,324 people
- By 2030
- 22,492 · -7.5%
- By 2040
- 19,052 · -21.7%
- By 2050
- 16,060 · -34.0%
- By 2075
- 10,525 · -56.7%
- By 2100
- 6,933 · -71.5%
Race, ethnicity, and origin ACS 2023
- Neighborhood character
- Predominantly White (97%)
- Race & ethnicity
- White 97% Two or more races 3%
- Common ancestry
- Lithuanian 3%
Political lean MEDSL · Harlan
- 2024 margin
- Solid R (+76.2) · D 11.6% · R 87.7%
- 2008→2024 swing
- -30.0pp toward R · 2008: -46.2pp · 2024: -76.2pp
- All cycles
- 2024: R+76.2 2020: R+71.8 2016: R+72.2 2012: R+64.0 2008: R+46.2
Not yet ingested
- Civics
- —
Market trends
- HPI YoY
- ▼ -0.80%
- Current HPI
- 171.773
- Rent YoY
- —
- Metro
- —
- State GDP YoY
- ▲ 1.81%
- F500 in state
- 4
Industry mix (Fortune 500 HQ in KY)
| Industry | F500 HQs | Revenue |
|---|---|---|
| Healthcare | 1 | $118B |
|
||
| Food / Beverage | 1 | $7B |
|
||
Price history
1 event — show timeline
- 2026-05-26 Listed $27,500 ImagineMLS
Property tax history
-0.2%/yrLatest (2025): $375 · -0.2% YoY. Source: county tax records.
Cash-flow waterfall
monthlySold comps — $/sqft
last 12 mo · ≤1 miLoading sold comps…