 Fourplex
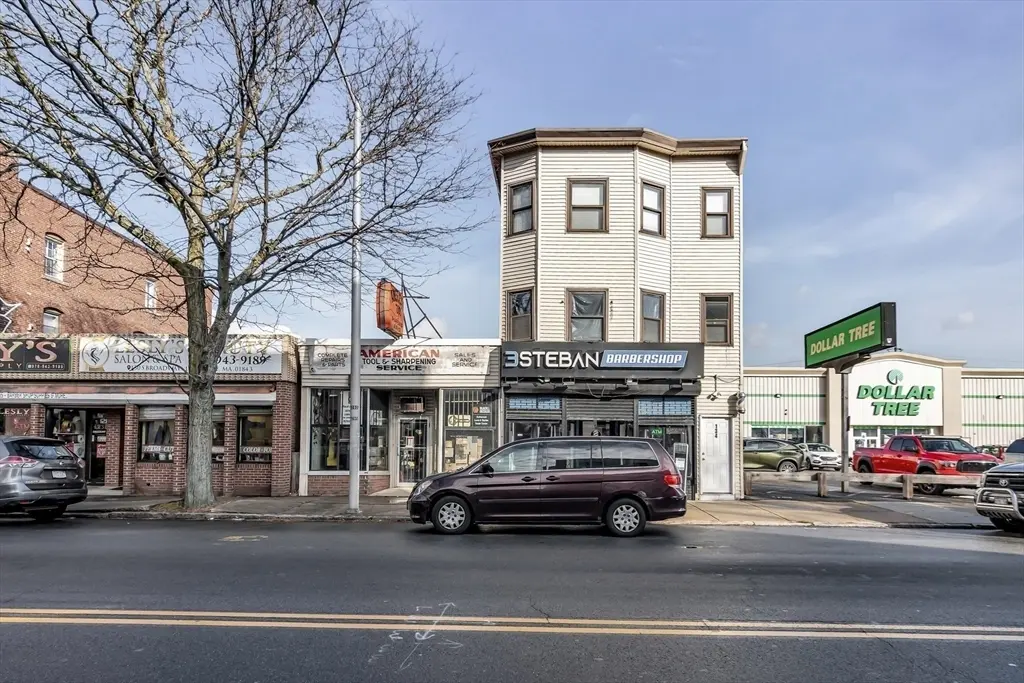
132-134 S Broadway · Lawrence, MA
Flood risk No data
- FEMA flood zone
- —
- Chance of flooding over 30 yrs
- —
- Est. flood insurance / yr
- —
Fire risk No data
- Est. fire insurance / yr
- —
Heat risk 5/10 · Moderate
- Hot days now (above threshold)
- 7 days/yr
- Hot days in 30 yrs
- 16 days/yr
Wind risk No data
- Chance of severe wind over 30 yrs
- —
Air-quality risk 2/10 · Minimal
- Unhealthy air days now
- 2 days/yr
- Unhealthy air days in 30 yrs
- 2 days/yr
Risk factors via First Street. Map © Google.
Why this score? — see what drove the C grade
The composite is a weighted blend of 9 inputs, each scored 0–100. Each bar is that input's sub-score; the figure is the points it added to the 100-point composite (weight × sub-score).
- Cash flow +27.3/30.0
- DSCR +9.5/10.0
- 1% rule +7.4/10.0
- Condition / age +4.0/5.0
- Livability +3.5/5.0
- Rent growth +3.2/5.0
- Schools +1.2/10.0
- ARV discount +0.0/15.0
- Appreciation +0.0/10.0
$1,089,900
🖨 Deal sheet 📄 Offer letter ✓ Due diligence
Multi-family units
County records classify this as Multi-Family (2-4 Unit). Listing-text estimate: 4 units. confirmed
Listing remarks MLS
Welcome to 132–134 S Broadway St, a well-located multi-family property offering strong income potential in the heart of Lawrence. Well-positioned mixed-use property featuring 2 updated residential units and 2 commercial storefronts in a high-visibility, high-traffic location. The residential units offer modern updates, comfortable layouts, and strong rental appeal, ideal for consistent income. The commercial spaces provide excellent street exposure along South Broadway, perfect for retail, office, or service-based tenants. A rare opportunity to own a 4-unit income-producing property in one of Lawrence’s most active commercial corridors, close to downtown, public transportation, and major routes. Strong cash-flow potential with multiple revenue streams in a prime location—ideal for investors or owner-occupants.
Key facts
- 3,600 sq ft lot
- Built 1900
- Listed 40 days
Tags
Neighborhood map
What this means for you Summary
Snapshot
- This is a 4 × 6-bed/3.0-bath units multifamily listed at $1.09M. Condition is rated good.
Deal economics
- At list price, monthly cash flow is $3k ($38k/yr) — positive. Per door: $788/mo.
- The deal already cash-flows at list — no discount required.
- Meets the 1% rule at list price ($14k rent vs $1.09M).
- Recommended offer: $1.06M (3.0% below list) — sets the bar for market timing.
- Cap rate 9.8% vs local median 4.1% in Lawrence — top-decile yield for the area; either an underpriced asset or a hidden risk that comps aren't pricing in. Stress-test before assuming the spread holds.
Location & tenants
- Location reads 70/100 on livability (#133 in MA) — a middle-class / working-renter tenant base. Strengths: commute A+, health & safety A+; Watch: crime C-, schools D, amenities D.
- Lawrence (suburban): math 10% / reading 19% proficiency, ranked #300 of 302 in MA (top 99%) — low school quality limits family demand, transient renter base, plan for 1-2y turnover; 83% free/reduced lunch — lower-income household profile, screen leases tightly.
- Market conditions: Rents rising (+2.7%/yr); 12 active listings in the ZIP; 1,032 units permitted in Essex County in 2024 (590 in 5+ unit buildings).
- At $13,524/mo this rent would consume 240% of the median local household income ($68k/yr) (locally 1661% of renters already pay >50% of income on rent) — very limited rent-growth headroom before tenants either downsize or default.
Forward outlook
- Local home prices are declining (-3.0%/yr); year-one equity from $8k of loan paydown is wiped out by about $33k of value loss. Plan a longer hold.
- Essex County population projected at +15% by 2050 — long-run rental-demand tailwind backs the buy-and-hold thesis.
- At projected returns (-3.0% appreciation + 2.7% rent growth), your $305k cash investment doubles in ~10 years — after that, you're playing with house money.
Negotiation context
- It's been on market 40 days — a 3% lower offer ($1.06M) is reasonable based on typical stale-listing flexibility.
Risks & watch-outs
- Watch-outs: built in 1900 — expect roof / HVAC / electrical / plumbing capex.
- Climate carrying-cost: extreme-heat days projected 7→16/yr by 2055 (HVAC capex compounding) — expect insurance premiums to compound above CPI over the hold.
Questions for the listing agent
- It's been on market 40 days. Have you received any prior offers? Is the seller open to a 3% concession, seller financing, or rate buy-down credit?
- Can we see the unit-by-unit rent roll, current vacancy, and any below-market leases? What's the average tenancy length?
- What capital expenditures (roof, boiler, parking lot, exteriors) have been made in the last 5 years, and what's planned in the next 2?
- Built in 1900 — when were the roof, HVAC, electrical panel, plumbing, and water heater last replaced?
- Is there a deadline driving the sale (1031 exchange, divorce, estate, relocation)? That informs how much negotiation room exists.
- Schools are D-rated, which usually means shorter tenancies and higher turnover. Who's the typical renter profile here, and what's been the actual vacancy rate?
- What's the average days-on-market for RENTAL listings here right now (not sales)? A rising rental-DOM trend means longer vacancies and softer asking-rent achievability than the comps imply.
- What's the recent tenant-quality profile in this submarket — average credit score on applications, eviction rate, late-payment / NSF rate, and stable-employment percentage? A property-management company in the area should have these aggregated.
- How much new apartment / multifamily construction is in the pipeline within 1–3 miles? Heavy new supply (>2% of stock underway) typically softens rents 12–24 months out; light construction supports rent growth.
Investment metrics
- 1% rule
- 1.24% ✓
- Cap rate
- 9.76%
- Cash-on-cash
- 12.39%
- DSCR
- 1.55
- GRM
- 6.7
CMA / ARV
- ARV (median comp)
- $877,856
- List price
- $1,089,900
- Delta
- 24.15%
- Verdict
- OVERPRICED
- Comps
- 20 within 1.0 mi
Projected returns pro-forma
-3.0% appreciation · 2.74% rent growth · sell at horizon
- IRR
- 1.8%
- Equity multiple
- 1.07×
- Total profit
- $20,811
- Equity at exit
- $162,508
- IRR
- 11.1%
- Equity multiple
- 1.86×
- Total profit
- $263,040
- Equity at exit
- $94,235
Cash invested: $305,172 (down + closing). Projections, not guarantees.
Landlord ↔ Tenant lean methodology
- Overall (STATE)
- 20 Strongly Tenant-Friendly
- State Massachusetts
- 20 Strongly Tenant-Friendly · D+15
- County
- — inherits STATE
- City
- — inherits STATE
ZIP-level market 01843
- Home prices YoY
- -10.4%
- Rents YoY
- 2.7%
- Active inventory
- 12
- Price-to-rent
- 26.9×
Monthly cashflow live
- Estimated rent
- $13,524 medium interval (Pro) →
- Mortgage (P&I)
- −$5,716
- Tax est. 1.5%
- −$1,362 /mo · $16,348/yr
- Insurance
- −$454
- HOA
- −$0
- Vacancy / Maint / Mgmt
- −$2,840
- Net cashflow
- $3,152
Break-even live
4-unit breakdown (identical units grouped — click to expand)
| Units | Beds | Baths | Est. rent |
|---|---|---|---|
| 4× units | 6 | 3 | $13,524 |
| #1 | 6 | 3 | $3,381 |
| #2 | 6 | 3 | $3,381 |
| #3 | 6 | 3 | $3,381 |
| #4 | 6 | 3 | $3,381 |
| Total (4 units) | $13,524 | ||
UW: 25.0% down · 7.5% · 30yr · 1.5% tax · 5.0% vac · 8.0% maint · 8.0% mgmt
Financing live
Cash to close
- Down payment
- $272,475
- Closing costs
- $32,697
- Reserves months
- —
- Total cash needed
- —
Loan-product check · same deal, 3 products live
Conventional
25% down · 7.5% · 30yr
- Down + closing
- —
- Monthly P&I
- —
- Monthly cashflow
- —
- DSCR
- —
- Eligible?
- —
Personal DTI + credit; lowest rate.
DSCR
20% down · 8.5% · 30yr
- Down + closing
- —
- Monthly P&I
- —
- Monthly cashflow
- —
- DSCR
- —
- Eligible?
- —
No personal income docs; deal must DSCR.
Hard money
10% down · 12.0% · 12mo
- Down + closing
- —
- Monthly P&I
- —
- Monthly cashflow
- —
- DSCR
- —
- Eligible?
- —
Short-term bridge; refi at stabilization.
Listing history 2 events
-
2026-05-13price $1,089,900 839-char remark
Show marketing remark (839 chars)
Welcome to 132–134 S Broadway St, a well-located multi-family property offering strong income potential in the heart of Lawrence. Well-positioned mixed-use property featuring 2 updated residential units and 2 commercial storefronts in a high-visibility, high-traffic location. The residential units offer modern updates, comfortable layouts, and strong rental appeal, ideal for consistent income. The commercial spaces provide excellent street exposure along South Broadway, perfect for retail, office, or service-based tenants. A rare opportunity to own a 4-unit income-producing property in one of Lawrence’s most active commercial corridors, close to downtown, public transportation, and major routes. Strong cash-flow potential with multiple revenue streams in a prime location—ideal for investors or owner-occupants.
-
2026-04-16$1,150,000 New 839-char remark
Show marketing remark (839 chars)
Welcome to 132–134 S Broadway St, a well-located multi-family property offering strong income potential in the heart of Lawrence. Well-positioned mixed-use property featuring 2 updated residential units and 2 commercial storefronts in a high-visibility, high-traffic location. The residential units offer modern updates, comfortable layouts, and strong rental appeal, ideal for consistent income. The commercial spaces provide excellent street exposure along South Broadway, perfect for retail, office, or service-based tenants. A rare opportunity to own a 4-unit income-producing property in one of Lawrence’s most active commercial corridors, close to downtown, public transportation, and major routes. Strong cash-flow potential with multiple revenue streams in a prime location—ideal for investors or owner-occupants.
ⓘ Source: listings_history table (triggers on properties + properties_extension) + one-shot
backfill from property_details.listing_events for pre-trigger history.
Climate risk First Street
- Heat 5/10 Major
- Air quality 2/10 Low 2 unhealthy d/yr today · 2 by 30 yrs out
Nearby sold comps map
Loading sold comps map…
Walkable amenities ~0.75 mi
Loading nearby amenities…
Taxation est. · year 1
- Rental income
- $162,288
- − Mortgage interest
- −$61,051
- − Property taxes
- −$16,348
- − Insurance
- −$5,450
- − Repairs & maintenance
- −$12,983
- − Management
- −$12,983
- − Depreciation
- −$31,706
- Taxable income
- $21,766
- Est. tax owed @ 24.0%
- −$5,224
- After-tax cash flow
- $32,599/yr
For passive investors: Depreciation is non-cash, so a rental often shows a tax loss while cash-flowing — sheltering income. Rental losses are passive: they offset passive income freely, and up to $25,000/yr can offset ordinary (W-2) income if you actively participate and your MAGI is under $100k (phasing out to $0 by $150k); unused losses carry forward. On sale, claimed depreciation is recaptured at up to 25%, and gains may owe capital-gains tax (a 1031 exchange can defer both). Figures are a year-1 estimate at your 24.0% rate — not tax advice; consult a CPA.
Condition & rehab AI · 12 photos
A well-maintained multi-family property with modern updates and strong rental appeal.
Value-add opportunities
- Both Paint exterior — Enhances curb appeal and value
- Both Clean gutters — Improves drainage and property value
Renovation cost estimate screening
Value-add ROI direction
- Both Paint exterior — Enhances curb appeal and value ↑
- Both Clean gutters — Improves drainage and property value ↑
ⓘ Cost ranges are severity-bucket heuristics (US national rule-of-thumb). Get contractor quotes + a written scope before underwriting a rehab budget.
Schools (NCES district)
- District
- Lawrence
- NCES district ID
- 2506660
- Math proficiency
- 10% ▼ -21.00%
- Reading proficiency
- 19% ▼ -11.00%
- Median HH income
- $34,802
- Composite
- 11.87/100
- National rank
- #9672
- State rank
- #300 of 302 in MA
Livability — Lawrence
- Score
- 70/100
- State rank
- #133
- US rank
- #7750
Category grades
Schools grade is shown separately in the Schools card above.
Census & demographics
- Census place
- Lawrence, MA
- County
- Essex County · 632,995 people
- City population
- 35,967
- Metro
- Boston-Cambridge-Newton, MA-NH
- Population (ZIP)
- 27,445
- Household income
- $67,585
- Rent vs Own
- Severe rent burden
- 1661.0
Population outlook (Essex County) Hauer SSP2
- Today (2025)
- 840,920 people
- By 2030
- 872,201 · +3.7%
- By 2040
- 927,918 · +10.3%
- By 2050
- 970,206 · +15.4%
- By 2075
- 1,077,993 · +28.2%
- By 2100
- 1,103,053 · +31.2%
Race, ethnicity, and origin ACS 2023
- Neighborhood character
- Predominantly Hispanic (73%)
- Race & ethnicity
- Hispanic / Latino 73% White 19% Two or more races 16% Asian 4% Black 3%
- Hispanic origin (detail)
- Mexican 1% Puerto Rican 18% Dominican 46%
- Common ancestry
- Lithuanian 2% Estonian 2% Swedish 1%
- Foreign-born
- 40% · Canada, Vietnam, China
- Languages at home
- 28% English-only · Spanish 64% Other Indo-European 4% Other Asian/Pacific 1%
Political lean MEDSL · Essex
- 2024 margin
- Strong D (+20.3) · D 59.2% · R 38.9% · Other 1.9%
- 2008→2024 swing
- 0.0pp no change · 2008: 20.3pp · 2024: 20.3pp
- All cycles
- 2024: D+20.3 2020: D+29.1 2016: D+22.5 2012: D+16.2 2008: D+20.3
Not yet ingested
- Civics
- —
Market trends
- HPI YoY
- ▼ -49.58%
- Current HPI
- 427.9146
- Rent YoY
- ▲ 2.74%
- Metro
- Boston-Cambridge-Newton, MA-NH
- State GDP YoY
- ▲ 2.28%
- F500 in state
- 38
Industry mix (Fortune 500 HQ in MA)
| Industry | F500 HQs | Revenue |
|---|---|---|
| Technology | 3 | $17B |
|
||
| Insurance | 2 | $84B |
|
||
| Retail | 2 | $76B |
|
||
| Life Sciences | 1 | $43B |
|
||
| Energy Technology | 1 | $31B |
|
||
| Aerospace / Defense | 1 | $18B |
|
||
Price history
-5.2% since first listed2 events — show timeline
- 2026-05-13 Price Changed $1,089,900 MLS PIN
- 2026-04-16 Listed $1,150,000 MLS PIN
Cash-flow waterfall
monthlySold comps — $/sqft
last 12 mo · ≤1 miLoading sold comps…